
ETH
No ATH for Ethereum Price? ETH Whale Selling Persists Amid Election Boost

During Wednesday’s trading session, the cryptocurrency market witnessed a surge in buying pressure as Donald Trump secured his victory as the 47th U.S. President. The pioneer cryptocurrency, Bitcoin, surged 8.8% to a new high of $75,400, boosting recovery in the altcoin market. However, the Ethereum price could struggle to hit new ATH as crypto whale continues to offload ETH.
By press time, the ETH price trades at $2,647 with an intraday gain of 9.89%. According to Coingecko, Ether’s marketcap holds at $319.2 Billion, and 24-hour trading volume is at $38.169 Billion.
Ethereum Price ATH Delayed? Whale Sales Overshadow Election Momentum
On November 6th, the cryptocurrency market experienced a significant rally as Donald Trump secured the necessary 270 electoral votes to become the 47th President of the United States. Amid this rally, a crypto whale who received 150,000 ETH through the ICO recently transferred a substantial 25,000 ETH (worth approximately $65.63 Million) to Kraken at an average price of $2,625.
According to Lookonchain, this whale has sold a total of 90,000 ETH of the 150,000 coins at an average value of $2,527 (worth around $227.45M).
Breakdown of the Whale’s ETH Sales:
- July 2019: Sold 5,000 ETH at $218 ($1.09M).
- June 2024: Sold 10,000 ETH at $3,539 ($35.39M).
- September–October 2024: Sold 50,000 ETH at $2,516 ($125.34M).
- November 2024: Sold 25,000 ETH at $2,625 ($65.63M).
Historically, whale selling has coincided with major market tops and spurred a bearish sentiment in the market. Amid the supply pressure, the Ethereum price could witness a stalled recovery momentum and struggle to hit a new All-time-high.
在今天的大幅上涨后,通过 ICO 获得 15 万枚 ETH 的鲸鱼又准备出售一部分 ETH:过去 40 分钟里他将 2.5 万枚 ETH ($65.63M) 转进了 Kraken。
到现在他通过 ICO 获得的 15 万枚 ETH 已经以 $2,527 的均价出售了 9 万枚 ($227.45M):
一、2019 年 7 月以 $218 的价格出售 5,000 ETH ($1.09M);… https://t.co/fsr487zjLd pic.twitter.com/K9qVxaEOso— 余烬 (@EmberCN) November 6, 2024
ETH Chart Analysis Shows Porlong Consolidation Within Triangle
Over the past three months, the Ethereum price prediction has traded sideways, resonating within a symmetrical triangle pattern. The price action strictly resonated within two converging trendlines, indicating a lack of dominance from buyers or sellers.
With a massive green candle today, the ETH price is at $2,661, still consolidating within the triangle and 3% away from a major breakout. If the sellers continue to defend this resistance, the Ether price will revert again and prolong its sideways trend.

Therefore, a potential breakout from overhead resistance is necessary for buyers to regain control over the asset. If the ETH price surpasses the dynamic with the daily candle closing, the bullish momentum will accelerate to drive a surge above $3,500.
Frequently Asked Questions (FAQs)
Ethereum’s price recovery has been limited due to persistent selling by crypto whales
Following Trump’s election as the 47th U.S. President, the crypto market saw a rally, with Bitcoin hitting $75,400 and Ethereum gaining 9.89%, trading at $2,647
The symmetrical triangle pattern indicates consolidation, with ETH price oscillating between two converging trendlines. An upside breakout from this pattern is essential for buyers to regain control and push ETH towards the $3,500 mark or higher.
Sahil Mahadik
Sahil is a dedicated full-time trader with over three years of experience in the financial markets. Armed with a strong grasp of technical analysis, he keeps a vigilant eye on the daily price movements of top assets and indices. Drawn by his fascination with financial instruments, Sahil enthusiastically embraced the emerging realm of cryptocurrency, where he continues to explore opportunities driven by his passion for trading
Disclaimer: The presented content may include the personal opinion of the author and is subject to market condition. Do your market research before investing in cryptocurrencies. The author or the publication does not hold any responsibility for your personal financial loss.
Source link


Ethereum price surged 12% in four days, overtaking Solana and XRP as Trump’s policy shift boosted risk appetite across global markets.
Ethereum’s Undervalued Status Powers Late Rally Over SOL and XRP
Ethereum price broke above $1,825 on April 25, marking its highest level in 50 days.
Despite a sluggish start to the week, ETH now posts a 12% gain on the weekly timeframe, overtaking top Layer-1 rivals Solana (SOL) and XRP.
A major driver of Ethereum’s late rally was its undervalued status.
At the start of the week, ETH struggled for traction, consolidating below $1,600 for a 14-day stretch between April 9 and April 23.
While ETH remained stuck under the $1,620 resistance, Bitcoin (BTC), XRP, and Solana had already broken major psychological barriers—$90,000, $2.20, and $150 respectively—earlier in the week.

However, after former U.S. President Donald Trump softened his stance on tariffs and pressured the Federal Reserve for rate cuts, global market sentiment flipped positive.
Investors sitting on sidelined capital viewed ETH as undervalued relative to the broader market.Rapid inflows pushed Ethereum price from $1,600 on April 22 to $1,825 by Saturday, April 26—a 12% surge in just four days.

Ethereum’s late rally now places it ahead of Solana and XRP in weekly performance, with the latter two posting 5.3% and 6.9% gains, respectively, according to CoinGecko data as of April 26.
Bullish Investors Stake 91,000 ETH Amid Rumors of Institutional Migration From Ethereum to Solana
Trends observed on the Ethereum 2.0 staking network further affirm the narrative that investors piled into ETH following Trump’s tariff rollback hints earlier this week.
According to official Beacon Chain data, Ethereum has witnessed a consistent flow of new deposits since April 22.
As seen on Beaconcha.in, total ETH staked stood at 34,055,790 on April 22.

Following Trump’s announcement of a call with Chinese President Xi Jinping, deposits steadily climbed, reaching 34,146,222 ETH at press time on April 26.
This reflects an increase of 90,432 ETH—equivalent to approximately $164 million at current market prices.
Increased staking typically impacts asset prices positively for two key reasons: First, it reduces the circulating supply of tradable ETH on exchanges, tightening liquidity during periods of strong demand.
This supply shock helped ETH outpace rivals SOL and XRP on the weekly timeframe, despite its slow start.
Second, rising staking participation signals continued confidence among Ethereum’s core developers and large investors in the network’s long-term viability.
Such moves often encourage neutral traders and new entrants to take long positions.
Additionally, Ethereum staking enforces time constraints on liquidity.
According to validator platform Figment.io, withdrawals from the Beacon Chain can take up to nine days.
This lock-up period means the $164 million in new staking deposits will not be available for instant sell-offs, helping to establish strong short-term support for ETH even if broader market sentiment softens next week.
Ethereum Price Forecast Today: ETH Eyes $1,950 if Momentum Holds Above $1,800
Ethereum price is hovering above $1,802 at press time on April 26, as bulls look to set a strong bullish cluster above the key psychological $1,800 level.
The Keltner Channel indicator shows ETH rebounding from near the lower band at $1,511, with ETH price action now targeting the midline resistance at $1,928.
Volume Delta confirms bullish momentum, printing a positive 47,260 ETH on the latest session, the highest in two weeks.
The Relative Strength Index (RSI) has bounced sharply from oversold territory at 31.74 to 39.58, suggesting strengthening bullish divergence.

Ethereum price forecast today suggests a continuation toward $1,928 if buyers maintain dominance.
A daily close above $1,850 would validate a trend shift toward the Keltner Channel midline, with $1,950 emerging as the next major resistance.
Conversely, failure to hold $1,800 could expose ETH to renewed selling pressure, with immediate downside risk to $1,700 where prior consolidation occurred.
However, considering the improving Etheruem market volume dynamics and RSI recovery, odds now slightly favor a bullish continuation into early May.
Frequently Asked Questions (FAQs)
Ethereum surged 12% after Trump’s softer tariff stance boosted market sentiment and $164 million flowed into ETH staking.
Staking reduces ETH’s tradable supply, tightening liquidity during demand surges, and signals long-term investor confidence in the network.
Ethereum faces resistance at $1,850 and $1,928, with a potential breakout opening a path toward $1,950 in early May.
ibrahim
Crypto analyst covering derivatives markets, macro trends, technical analysis, and DeFi. His works feature in-depth market insights, price forecasts, and institutional-grade research on digital assets.
Disclaimer: The presented content may include the personal opinion of the author and is subject to market condition. Do your market research before investing in cryptocurrencies. The author or the publication does not hold any responsibility for your personal financial loss.
Source link

Reason to trust
![]()
Strict editorial policy that focuses on accuracy, relevance, and impartiality
Created by industry experts and meticulously reviewed
The highest standards in reporting and publishing
Strict editorial policy that focuses on accuracy, relevance, and impartiality
Morbi pretium leo et nisl aliquam mollis. Quisque arcu lorem, ultricies quis pellentesque nec, ullamcorper eu odio.
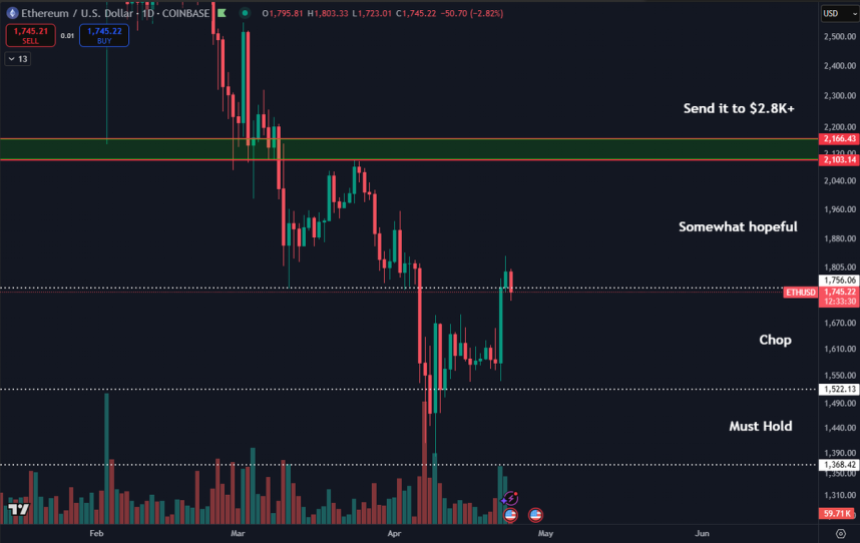
Ethereum is trading above $1,700 after a volatile few weeks, with bulls now trying to reclaim higher levels and flip resistance into support. Despite lingering macroeconomic tensions and the ongoing trade standoff between the US and China, markets are beginning to price in optimism as investors anticipate progress in negotiations. This renewed sentiment has lifted risk assets like ETH, which is showing early signs of a potential breakout.
Related Reading
Analysts are closely watching Ethereum’s current price action, which suggests a possible shift in trend. Top analyst Daan shared a technical view on X, highlighting that ETH is attempting to retake its previous horizontal support around $1,750. If successful, this would mark the first time in months that Ethereum reclaims a key support level after previously rejecting it and setting lower lows.
As Ethereum fights to regain lost ground, all eyes are on this critical level. A breakout here could lead to a renewed surge across the altcoin market, reinforcing growing speculation that the worst of the correction may already be behind us.
Ethereum Bulls Attempt to Shift Market Structure
Ethereum has rallied impressively, gaining over 32% from its local low of $1,383. This recovery has brought ETH to a critical price level, where bulls must hold and build momentum to break the broader downtrend that has defined much of 2024. A sustained move above current levels could mark a long-awaited shift in market structure, providing confidence that Ethereum is ready to trend higher over the medium term.
However, broader macroeconomic forces continue to weigh heavily on investor sentiment. Ongoing trade tensions between the United States and China remain unresolved, with each new tariff threat adding further strain on global supply chains. These geopolitical pressures threaten to limit risk appetite, and any further escalation could stall Ethereum’s recovery. On the flip side, a diplomatic breakthrough could trigger a strong shift in investor positioning across all risk assets, including crypto.
In the meantime, Ethereum must defend current levels to keep bullish momentum intact. Daan’s analysis highlighted that ETH is currently testing the $1,750 level, which previously acted as key support. If Ethereum can reclaim this horizontal zone, it would mark the first time in months that ETH retakes rather than rejects a critical level. Daan emphasized that daily closes above $1,750 are ideal and would confirm strength, potentially opening the door for a larger breakout.
Related Reading
ETH Price Holds Key Levels, Bulls Must Reclaim $2K Soon
Ethereum is currently trading at $1,770, maintaining strength above the 4-hour 200 EMA—a key short-term indicator that has historically acted as both resistance and support during critical trend shifts. Bulls have managed to defend this level over the past few sessions, signaling growing confidence and momentum as Ethereum attempts to recover from its recent downtrend.
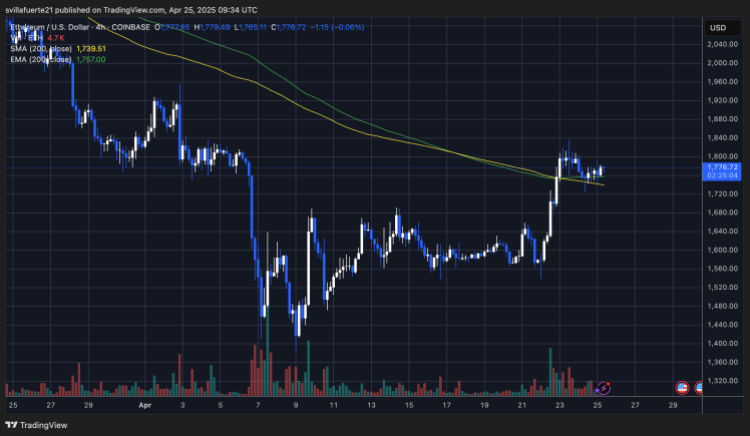
Holding above the $1,700 zone is now essential to avoid triggering another wave of selling. This level has become the new battleground for bulls and bears, and continued consolidation above it may lay the groundwork for a broader rally. The next major objective is a decisive reclaim of the $2,000 level. A breakout above this threshold would mark a strong shift in sentiment and could trigger additional upside as sidelined buyers re-enter the market.
Related Reading
However, caution remains warranted. A failure to hold current support would invalidate the recovery narrative and open the door to further losses. If Ethereum breaks below $1,700 with volume, it could revisit the $1,500 level, which has acted as a historical demand zone. That would reinforce a longer-term bearish structure and delay any hopes of a full-scale recovery.
Featured image from Dall-E, chart from TradingView
Source link
Cardano
Cardano Creator Charles Hoskinson Says Ethereum Might Not ‘Survive’ Next 10 to 15 Years – Here Are His Reasons

The founder of the smart contract platform Cardano (ADA), Charles Hoskinson, is warning that the future of Ethereum (ETH) could be in question.
In an Ask Me Anything (AMA) on his YouTube channel, Hoskinson says he doesn’t “think Ethereum will survive more than 10 to 15 years.”
According to Hoskinson, Ethereum faces existential threats both from within its ecosystem and externally.
“The [Ethereum] layer-2s will continue to suckle out all of the alpha and people will start fighting and it will get harder and harder for [Ethereum co-founder] Vitalik [Buterin] to be able to hold it together through sheer force of will.
And users will gradually migrate to other places and then they’re going to get eclipsed by Bitcoin DeFi (decentralized finance). Because once that turns on, the TVL (total value locked) will be larger than Ethereum and a lot of people will start migrating in that particular direction…
…and the other thing is they’re being eaten alive by Solana and Sui and these other things.
So, brilliant project. It’s just a victim of its own success. Like MySpace [social network] or any of these other things that have a lot of network effect and momentum. BlackBerry [smartphone] is another example. But people have fundamentally different paradigms that over the long term are intrinsically superior. And they creep up on you.”
The Cardano creator says that Ethereum’s problems can be traced to three mistakes made by the founders and developers.
“The number one problem Ethereum has is that they took an easy road out where they did three things wrong.
So first off, wrong protocols. They have the wrong accounting model, they have the wrong virtual machine and they have the wrong consensus model.
All of these were self-inflicted wounds. People told them not to do it, they did it and they got where they needed to go.
Second, what they chose to do to solve these problems is put in all these weird slashing economics and layer-twos and other things and now they’re living with all of the consequences of these types of things.
And third, they really don’t have a good on-chain governance system
So really what needs to happen is you need a parallel track with solving all those three things.”
Follow us on X, Facebook and Telegram
Don’t Miss a Beat – Subscribe to get email alerts delivered directly to your inbox
Check Price Action
Surf The Daily Hodl Mix
 

Disclaimer: Opinions expressed at The Daily Hodl are not investment advice. Investors should do their due diligence before making any high-risk investments in Bitcoin, cryptocurrency or digital assets. Please be advised that your transfers and trades are at your own risk, and any losses you may incur are your responsibility. The Daily Hodl does not recommend the buying or selling of any cryptocurrencies or digital assets, nor is The Daily Hodl an investment advisor. Please note that The Daily Hodl participates in affiliate marketing.
Generated Image: Midjourney
Source link

XRP Price Shows Strength — Breakout Above Key Levels Possible?

Expert Reveals Why The Ethereum-To-Bitcoin Ratio Is Falling

Analyst Says Solana-Based Memecoin Going Much Higher, Sees PENGU Facing ‘True Test’ After April Surge

Nike sued for $5 million over its shutdown of NFT platform RTFKT

Biological Age vs. Chronological Age: Redefining Age in the Digital Era

TRUMP whale regrets sale, pays double to buy back meme coins

Stripe Tests New Stablecoin Project as $3.7T Market Looms

Falling Wedge Pattern Confirms $264 target
Dogecoin Confirms Daily Trend Reversal With Breakout, Retest, And New Uptrend

Ethereum community members propose new fee structure for the app layer

Crypto Investors Sue Nike, Accuse Apparel Giant of Rug Pull After Abrupt Closure of Metaverse Business: Report

Top cryptocurrencies to watch: Pi Network, XRP, Sui

This Week in Crypto Games: Ubisoft’s ‘Might & Magic’, ‘Peaky Blinders’ in Development

Why Arbitrum-Nvidia Partnership Collapsed – And What It Means for Web3

Tariff Carnage Starting to Fulfill BTC’s ‘Store of Value’ Promise


 24/7 Cryptocurrency News6 months ago
Arthur Hayes, Murad’s Prediction For Meme Coins, AI & DeFi Coins For 2025

 Bitcoin3 months ago
Expert Sees Bitcoin Dipping To $50K While Bullish Signs Persist

 Ripple Price1 month ago
3 Voting Polls Show Why Ripple’s XRP Price Could Hit $10 Soon

 24/7 Cryptocurrency News4 months ago
Aptos Leverages Chainlink To Enhance Scalability and Data Access

 Bitcoin6 months ago
Bitcoin Could Rally to $80,000 on the Eve of US Elections

 Opinion6 months ago
Crypto’s Big Trump Gamble Is Risky

 Bitcoin5 months ago
Institutional Investors Go All In on Crypto as 57% Plan to Boost Allocations as Bull Run Heats Up, Sygnum Survey Reveals

 Altcoins3 months ago
Sonic Now ‘Golden Standard’ of Layer-2s After Scaling Transactions to 16,000+ per Second, Says Andre Cronje

✓ Share: