layer 1
Polkadot price forms a rare pattern, 76% jump possible
Published
6 months agoon
By
admin
Polkadot price may be preparing for a major bullish breakout as a rare pattern that has been forming since August nears its completion.
Polkadot (DOT), a top layer-1 network, was trading at $4.30 on Friday, Nov. 8 after rising for four consecutive days. It has jumped by 18% from its lowest point this year month, meaning that it is approaching a bull market.
Crypto analysts are bullish on Polkadot despite of its weak fundamentals. One of the main themes has been a falling wedge pattern that has been forming since Aug. 1. In an X post, a crypto analyst known as Globe of Crypto, estimated that the coin could jump to between $9 and $10 when the break out happens. If this happens, it will see DOT token more than double.
A potential catalyst for the Polkadot price is the new connection of the network to other chains like Ethereum, Optimism, Arbitrum, Base, and Binance Smart Chain. This connection, which has been enabled by Hyperbridge, means that users can move assets across these chains without relying on middlemen.
Meanwhile, there are signs that open interest in the futures market is picking up momentum. DOT’s open interest rose to over $269 million, its highest level since June 17. It has had a strong comeback after bottoming at $179 million in September.
Still, the biggest challenge for Polkadot is that it has not gained a lot of traction among developers. Its ecosystem growth has been relatively weak such that it has been passed by other newer networks like Base and Sui.
Polkadot price analysis
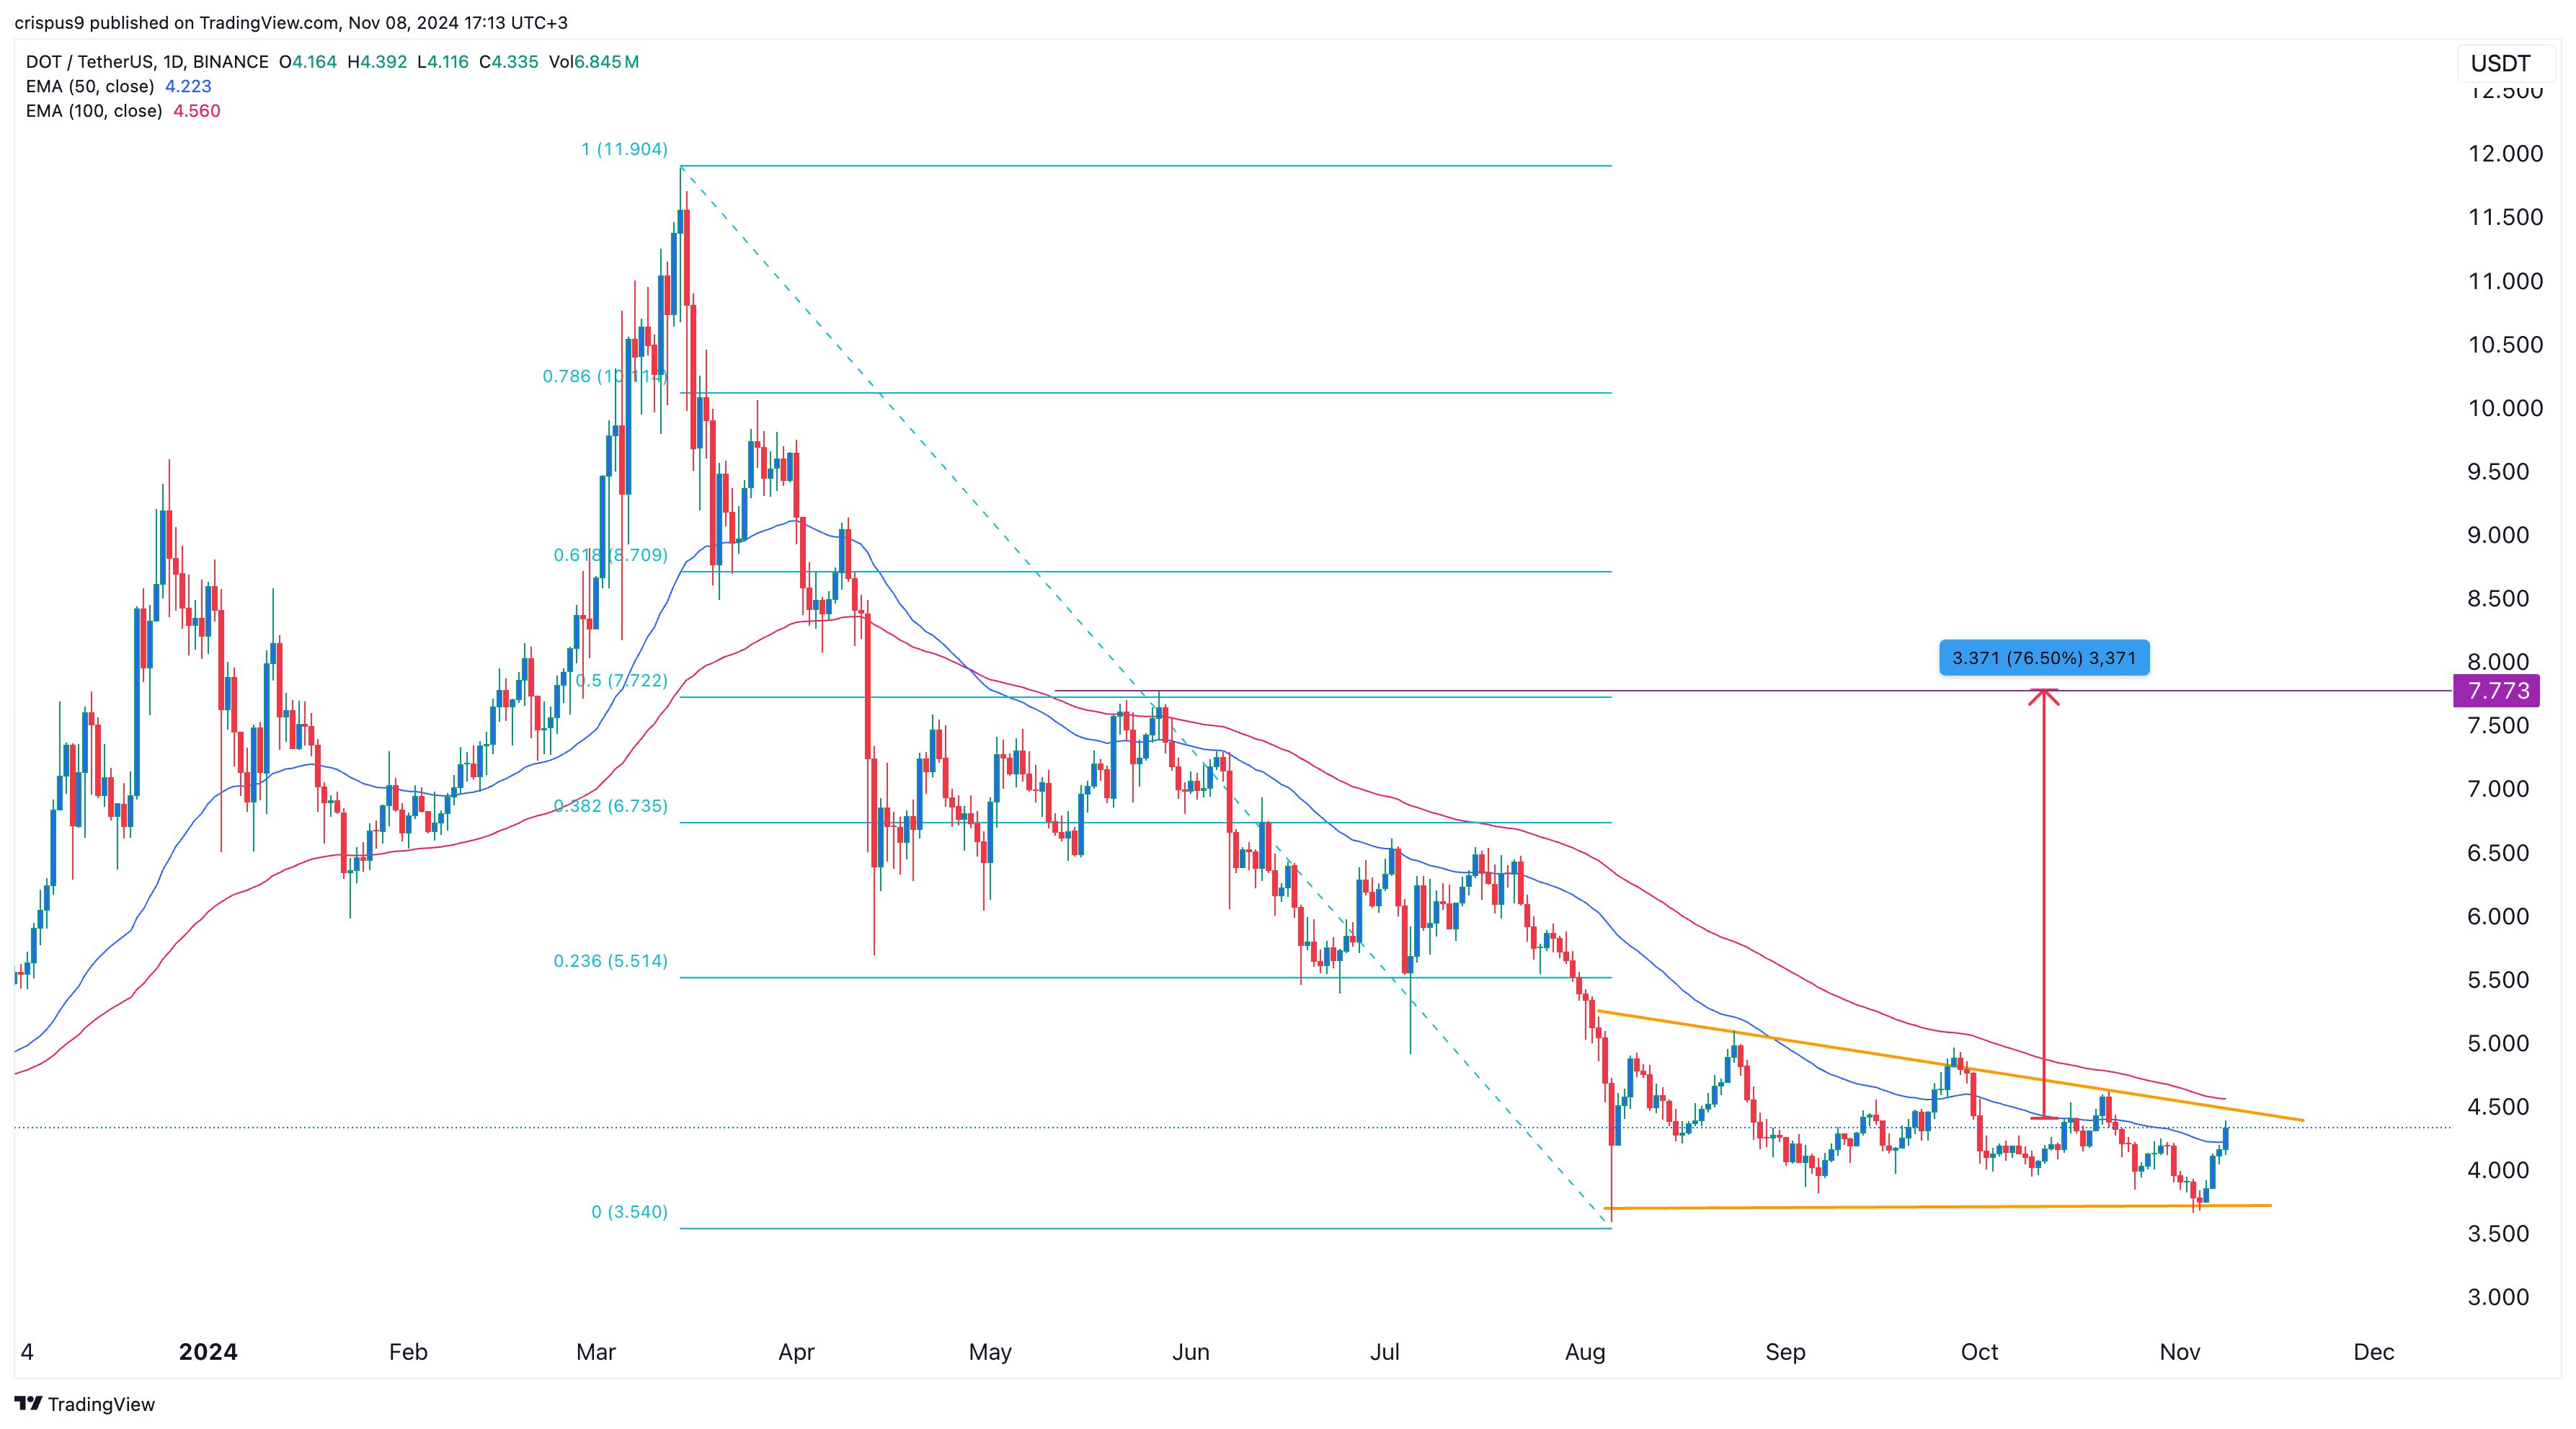
The daily chart shows that the DOT price has been in a tight range in the past few months. In this period, it has constantly remained below the 50-day and 100-day moving averages.
On the positive side, it has formed a falling wedge pattern, which is now nearing the confluence level. Such a move, especially at a time when oscillators like the Relative Strength Index (RSI) and Stochastic have pointed upwards, is a sign that the coin will soon have a bullish breakout.
If this happens, Polkadot price may jump to $7.77, its highest swing since May 27 and the 50% Fibonacci Retracement point. If this happens, the token will jump by 76.50% from the current level. This view will become invalid if it moves below this month’s low at $3.66.
Source link
You may like


Tariff Carnage Starting to Fulfill BTC’s ‘Store of Value’ Promise


The cost of innovation — Regulations are Web3’s greatest asset


Best Crypto to Buy as Derivatives Exchange CME Set to Launch XRP Futures


Metaplanet Buys Additional ¥1.92 Billion Worth Of Bitcoin


Here Are Four Signs the Stock Market Has Bottomed, According to Fundstrat’s Tom Lee


Bitcoin dips below $94,000 as ETFs record $3b weekly inflow
layer 1
Ethereum eyes $2,000 as spot ETH ETFs buck worrying trend
Published
21 hours agoon
April 26, 2025By
admin
The Ethereum price bounced back this week as investors bought the dip, and the Fear and Greed Index exited the fear zone.
Ethereum (ETH) rose to $1,800, up 30% from its lowest level this year. The rebound, which coincided with that of other cryptocurrencies, pushed its market cap to almost $220 billion.
There are signs that crypto investors are embracing the fear of missing out, or FOMO. The Crypto Fear and Greed Index has jumped from the extreme fear zone 18 to the neutral point of $53 today. If the trend gains steam, it will enter the greed zone soon.
Further, Wall Street investors are becoming interested in Ethereum as it bucked a worrying trend. All spot ETH ETFs had net inflows of over $157 million, the best performance since February. They had net outflows in the last consecutive weeks, the longest losing streak since their approval.
Ethereum had other positive metrics this week. For example, DEX protocols in the network handled over $11.5 billion in volume, bringing the 30-day volume to $57 billion. The 24-hour volume rose to $1.7 billion, with Uniswap, Curve Finance, Fluid, and Maverick Protocol having the biggest market share.
Ethereum price may continue doing well in the coming days as investors target the psychological point at $2,000. The risk to this outlook is the perpetual futures funding rate has plunged, a sign that short sellers are paying a fee to buyers to maintain their trades.
Ethereum price technical analysis
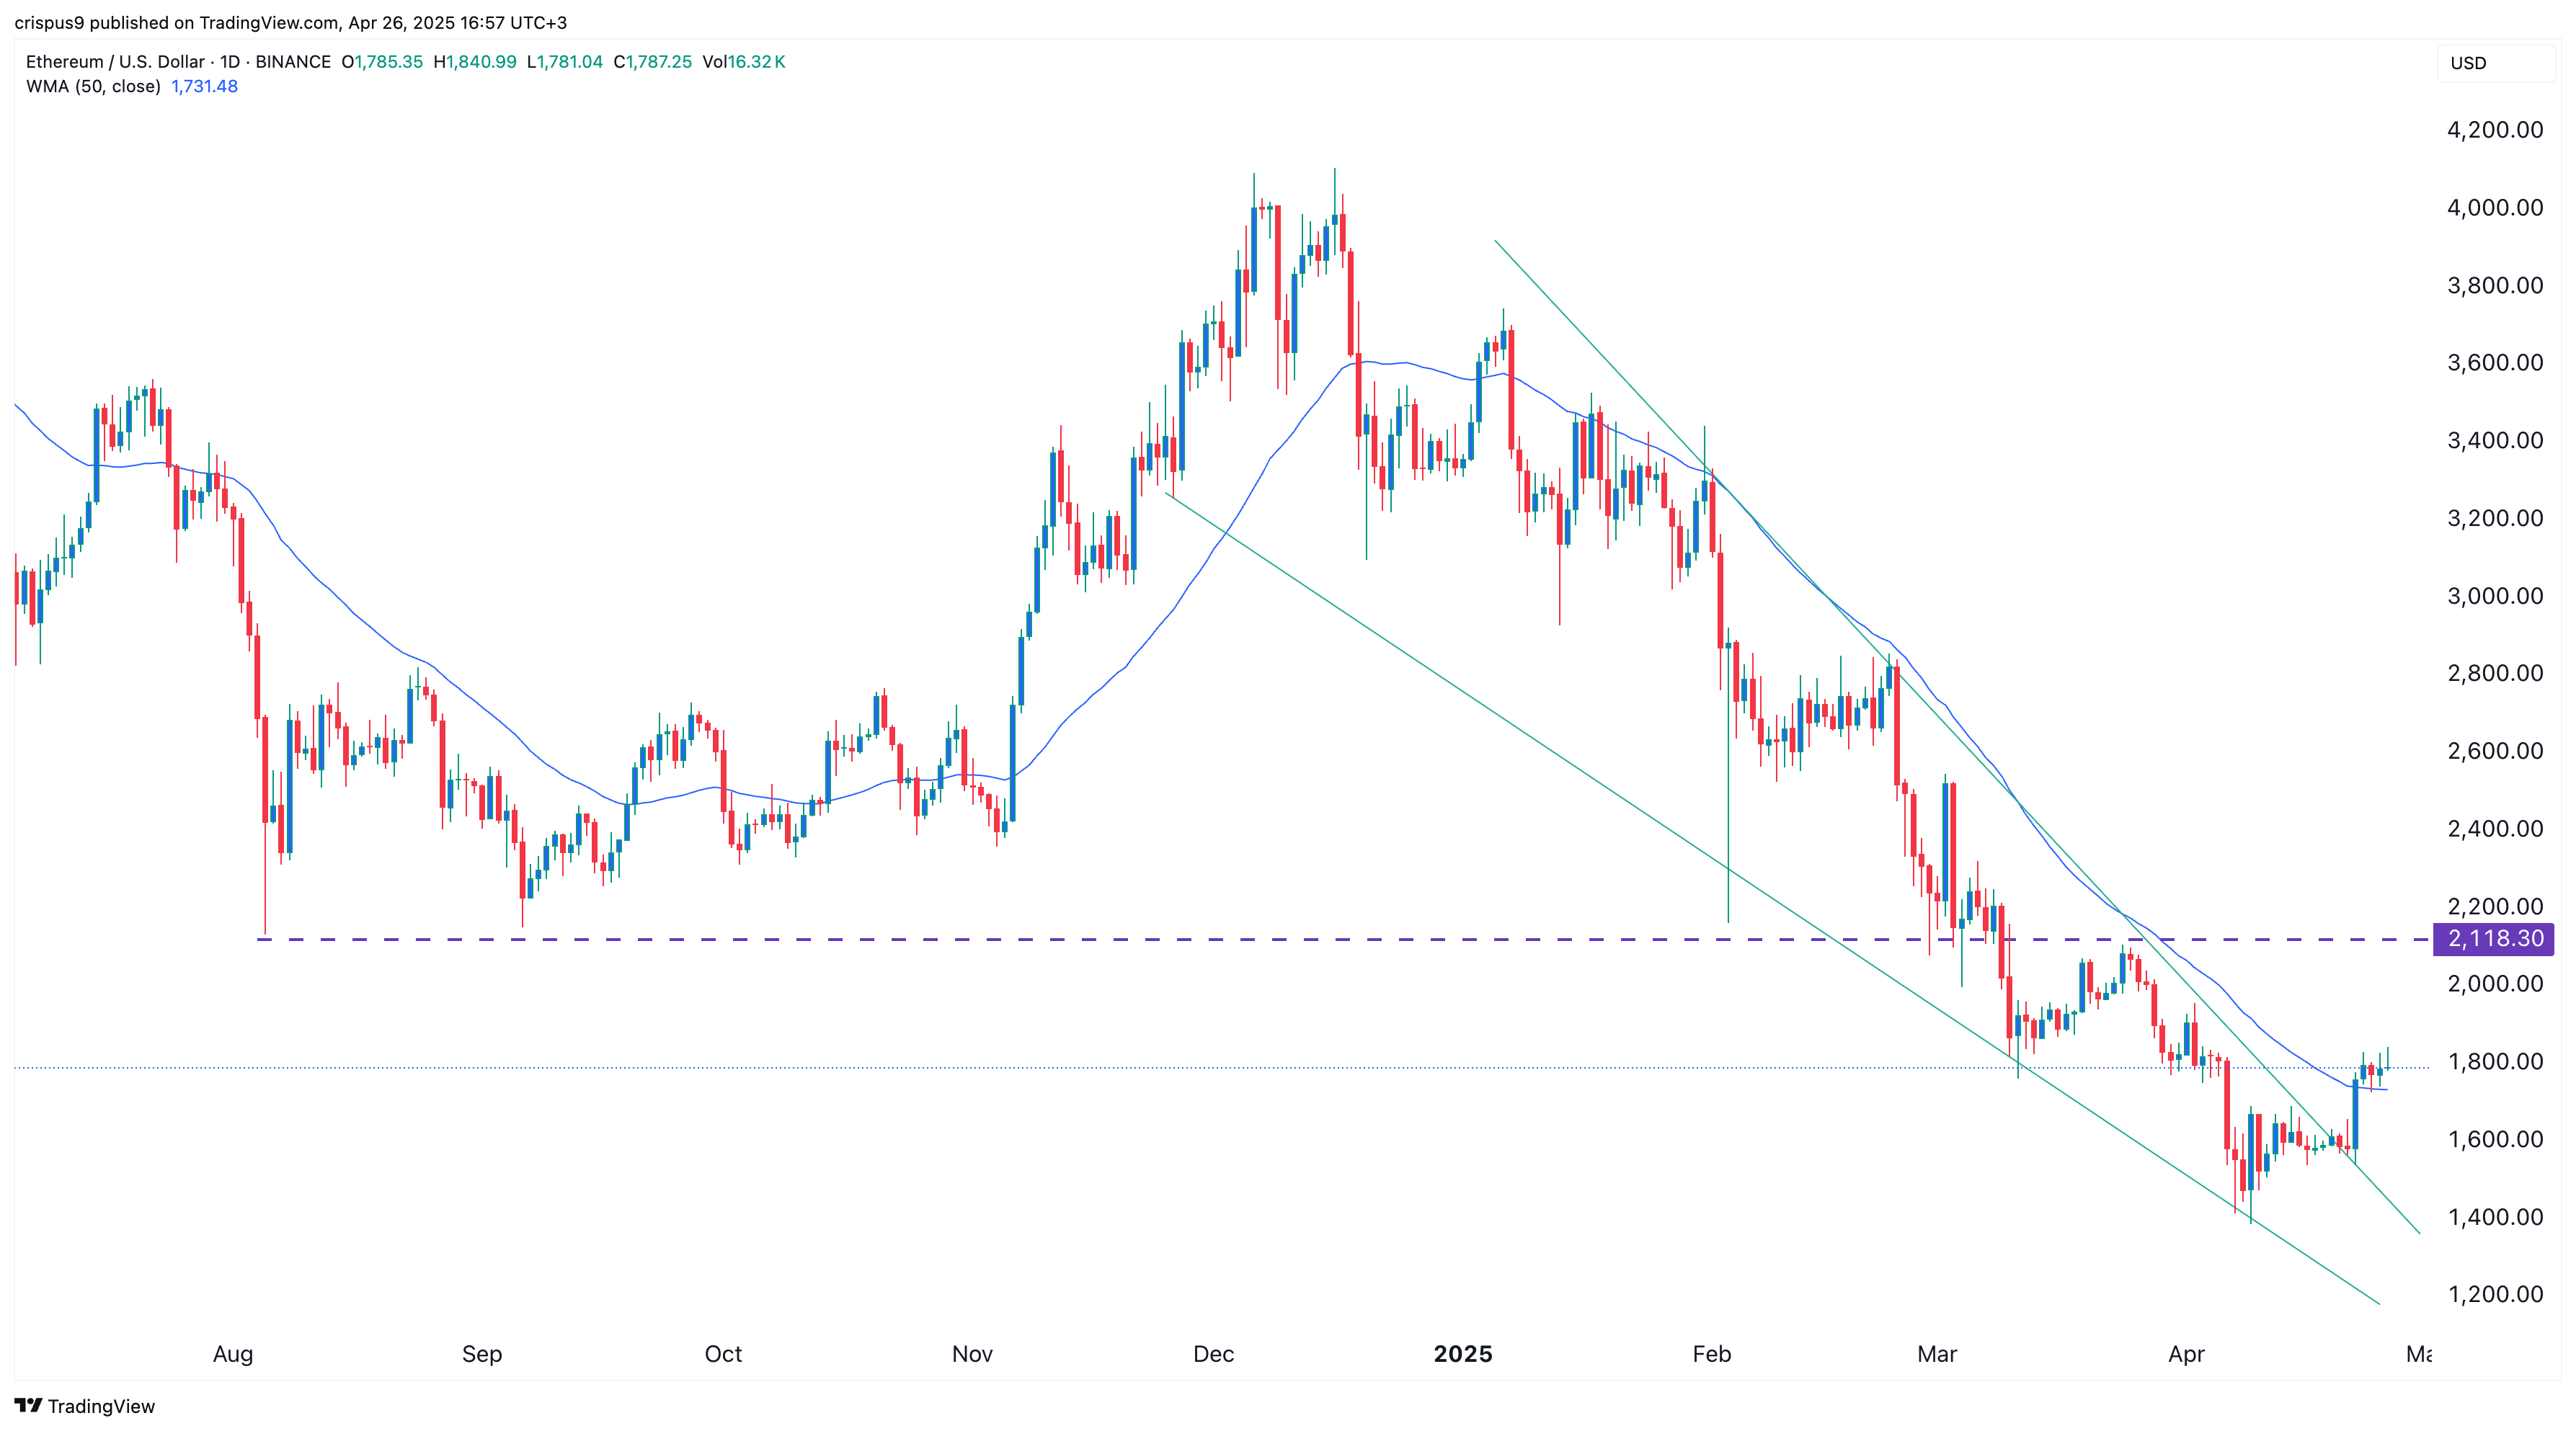
The daily chart shows that the ETH price has rebounded in the past few days. It has jumped and crossed the upper side of the falling wedge chart pattern, a popular bullish reversal sign.
The coin has moved slightly above the 50-day weighted moving average and formed a small bullish flag pattern, a popular bullish continuation sign in the market.
Therefore, the coin will likely continue rising as bulls target the psychological point at $2,000. A complete bullish breakout will be confirmed if the coin jumps above the key resistance at $2,120, the neckline of the triple-bottom pattern that formed on the weekly chart.
Source link
DeFi
Monad partners with Chainlink for oracle services ahead of mainnet launch
Published
4 days agoon
April 23, 2025By
admin

Monad has partnered with Chainlink to integrate its oracle services as its mainnet launch looms.
Monad, an EVM-compatible Layer 1 blockhain, has announced a partnership with a leading decentralized oracle provider Chainlink (LINK). When the mainnet launches, developers on Monad will have immediate access to Chainlink’s full suite of Web3 services, including Data Feeds, Data Streams, and the Cross-Chain Interoperability Protocol.
Thanks to Chainlink’s Data Feeds and Data Streams integrations, Monad developers will be able access accurate, tamper-proof market data—such as asset prices and exchange rates—enabling them to build DeFi apps like lending platforms and DEXs. Chainlink’s CCIP will enable secure, programmable cross-chain token transfers, laying the foundation for building interoperable dAapps.
The development comes on the heels of another big announcement from the project, which confirmed that USD Coin (USDC) will be available on the Monad chain starting from day one of its mainnet launch.
Backed by $244 million in funding led by Dragonfly and Paradigm, Monad is an EVM-compatible L1 chain that supports over 10,000 transactions per second, fast block times, low fees, and quick finality, made possible by its parallel execution model.
On Feb. 19, the project launched its testnet alongside an ecosystem directory of 50+ apps, infrastructure providers, and integrations, giving users and developers a robust environment to explore, build, and test on from day one. Phantom, OKX, Uniswap Wallet, and Backpack users can connect instantly, while others can onboard manually via testnet.monad.xyz. A built-in faucet offers testnet MON tokens to for interactions with Monad dApps.
The mainnet launch is slated for the first quarter of 2025, but the exact date is yet to be announced.
Source link
Cardano
Cardano price could surge to $2 as whale purchases rise
Published
1 month agoon
March 25, 2025By
admin
Cardano price has remained in a tight range over the past few weeks as market participants await the next catalyst.
Cardano (ADA) was trading at $0.760, down by 43% from its highest level in December last year. It has underperformed other popular coins like Mantra (OM) and Cronos (CRO) this month.
Cardano has three main catalysts that could propel it to $2 in the coming months. First, there are signs that whales are accumulating the coin in anticipation of more gains ahead. Data shows that whales have acquired over 240 million ADA coins in the past week, valued at over $182 million. The whale purchasing trend appears to be gaining momentum.
Second, Cardano could benefit from the likely approval of a spot ADA exchange-traded fund by the Securities and Exchange Commission. Grayscale Tuttle Capital Management have already submitted applications.
An ADA fund would be a positive development for the coin, as it could lead to more inflows from institutional investors.
Third, data shows that more investors are staking their Cardano coins, signaling that they intend to hold them long-term. The staking market cap has jumped by 8.1% to $16.1 billion, while the yield stands at 2.60%.
Cardano price technical analysis
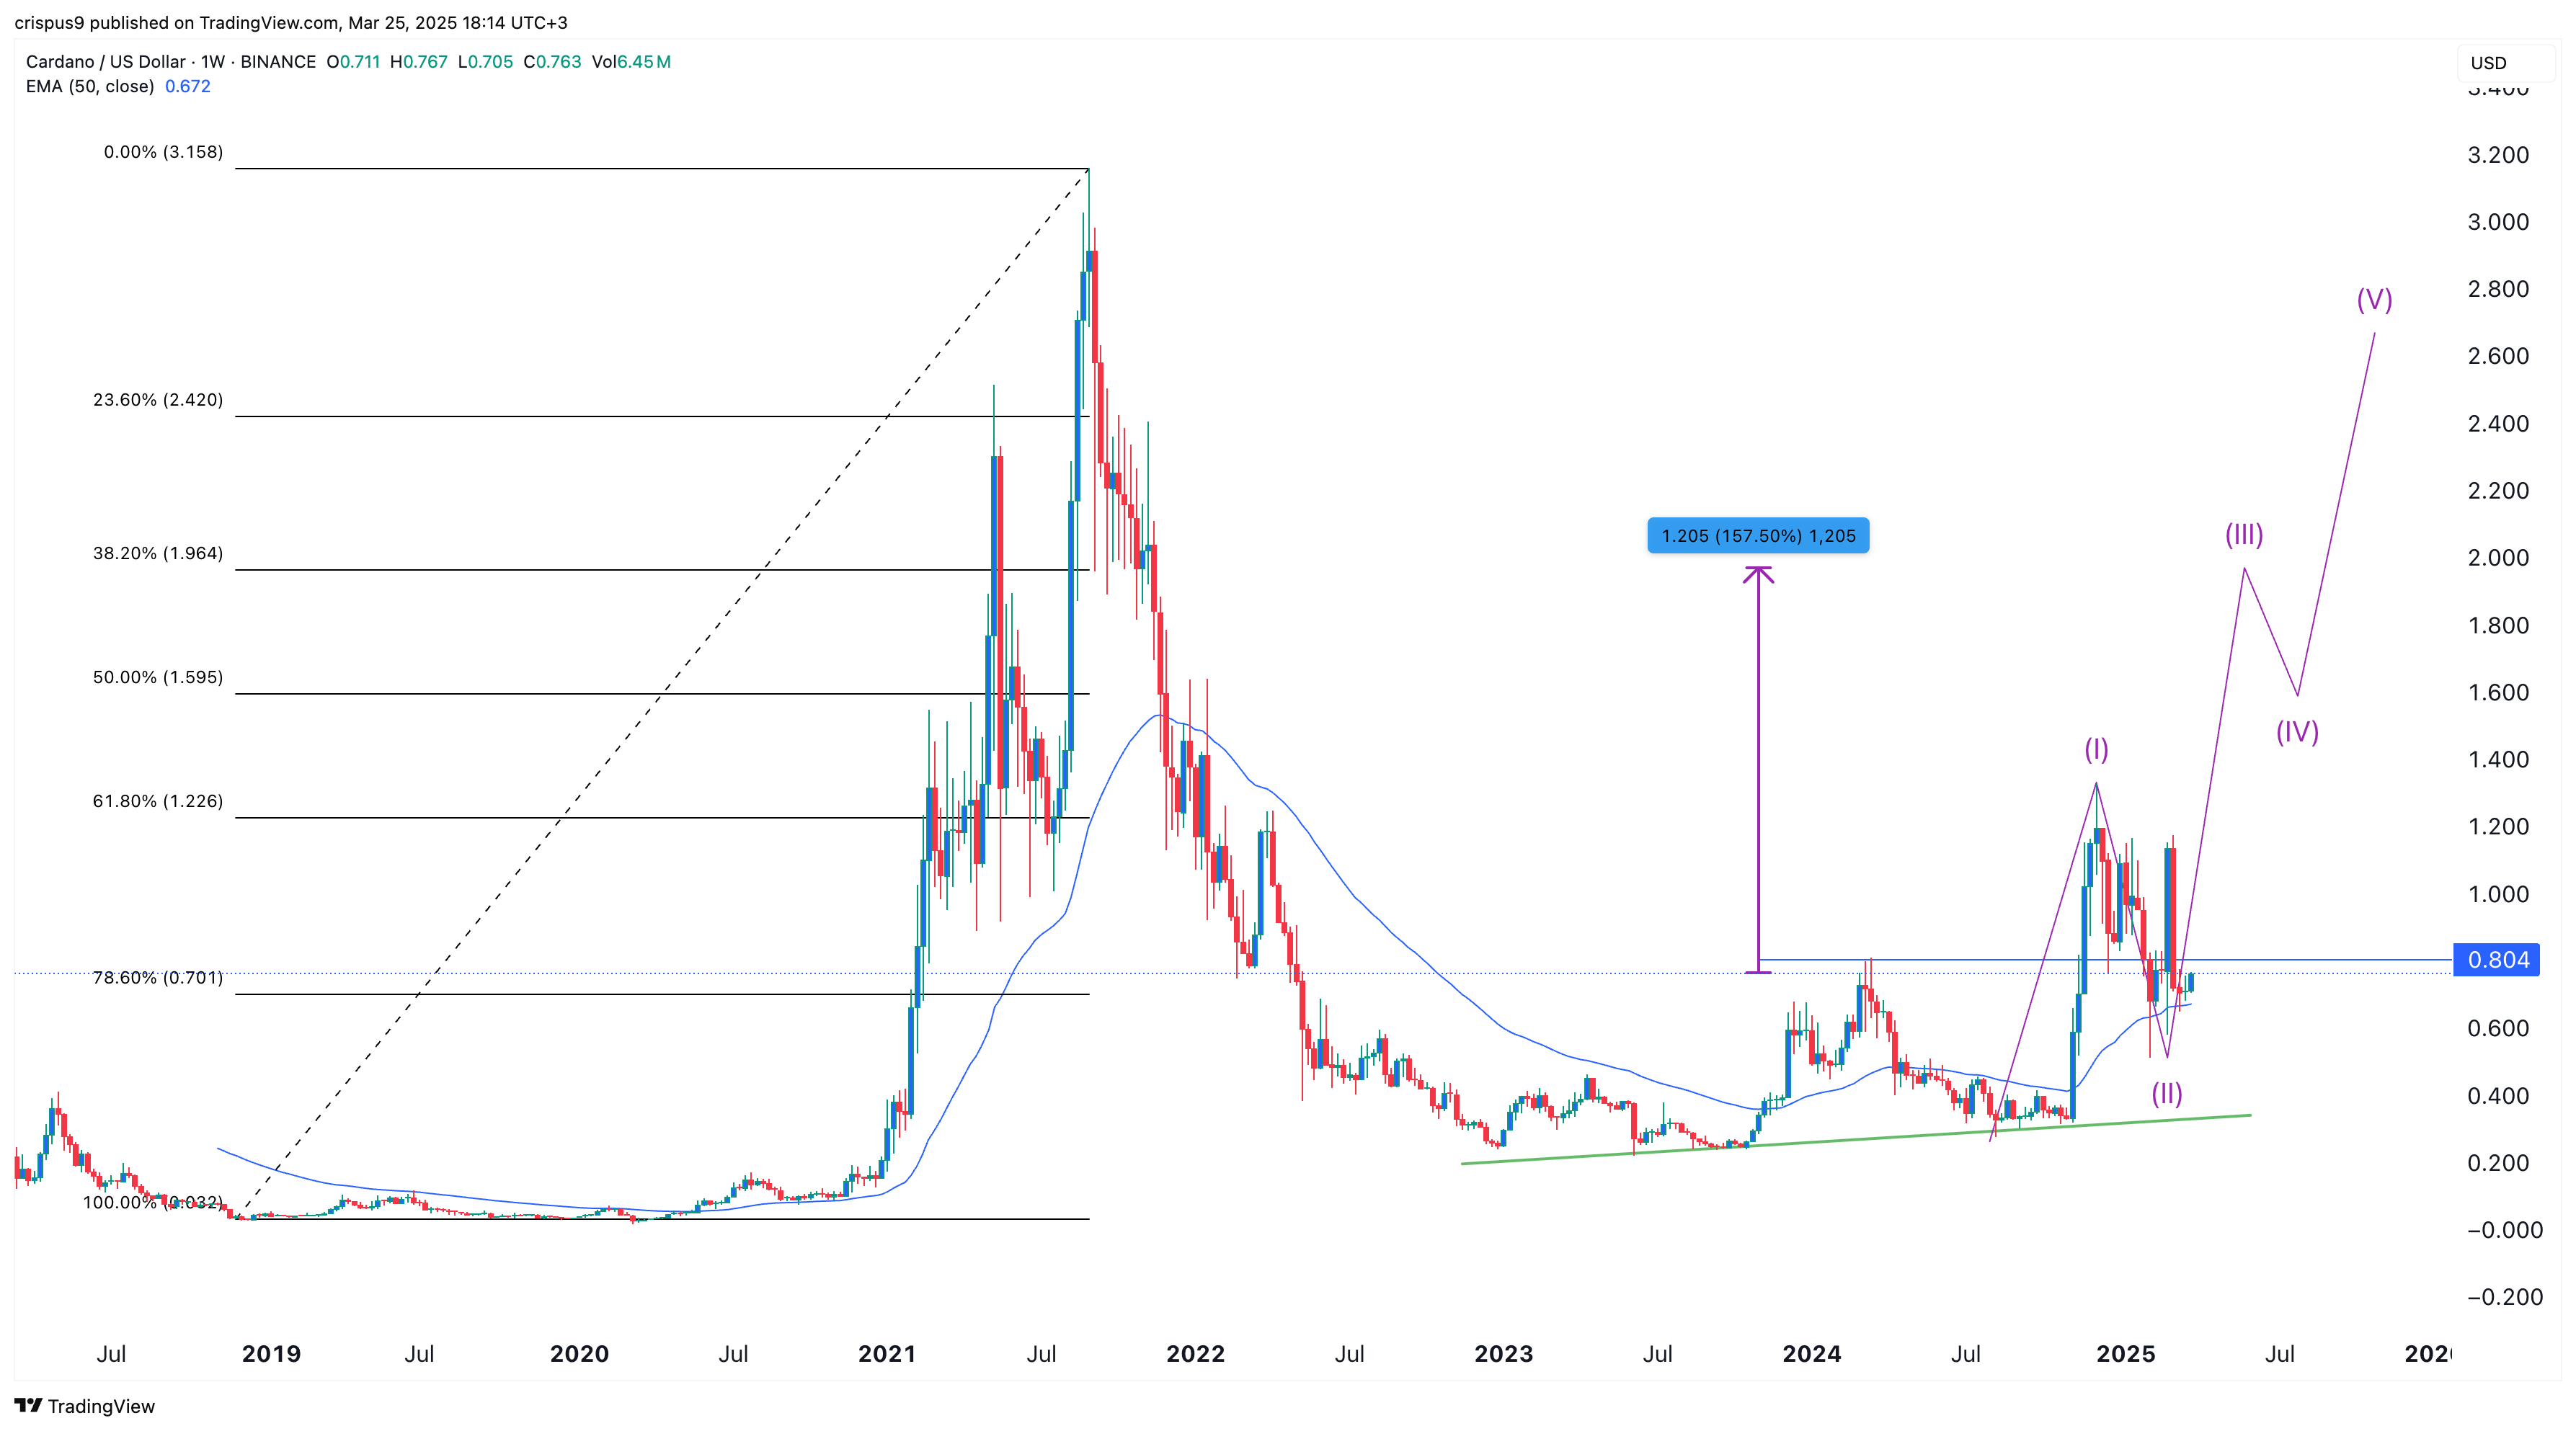
The other catalyst for ADA price is that it is in the second phase of the Elliott Wave pattern. This phase is characterized by a brief pullback, followed by the third bullish wave — typically the longest.
Cardano has likely completed the second phase and is poised to enter the third wave, which could push it to the psychological level of $2. This target aligns with the 38.2% retracement level and represents a 160% increase from the current price.
Cardano remains above the 50-week Exponential Moving Average and is forming a bullish flag pattern, a bullish continuation signal comprising a vertical line and a flag-like consolidation.
However, this prediction is based on the weekly chart, meaning the pattern could take time to fully develop. The flag section of the bullish flag has already taken more than three months to form.
Source link

Tariff Carnage Starting to Fulfill BTC’s ‘Store of Value’ Promise

The cost of innovation — Regulations are Web3’s greatest asset

Best Crypto to Buy as Derivatives Exchange CME Set to Launch XRP Futures

Metaplanet Buys Additional ¥1.92 Billion Worth Of Bitcoin

Here Are Four Signs the Stock Market Has Bottomed, According to Fundstrat’s Tom Lee

Bitcoin dips below $94,000 as ETFs record $3b weekly inflow

Bitcoin Post-Halving Price Performance Is the Worst on Record. Why?

Expert Predicts Start Date For Pi Network Price Pump

GameFi Tokens Show Signs of Life After Gala Games, White House Tie-Up

Bitcoin trades at ‘40% discount’ as spot BTC ETF buying soars to $3B in one week

Bitcoin Continues To Flow Out Of Major Exchanges — Supply Squeeze Soon?

BlackRock’s Bitcoin ETF Sees $643 Million Inflows

DePIN Altcoin Outpaces Crypto Market and Skyrockets by Nearly 44% Following High-Profile Exchange Listing

Solaxy, BTC bull token, and Pepeto gaining momentum as leading 2025 presale tokens

Australian Radio Station Used AI DJ For Months Before Being Discovered

Arthur Hayes, Murad’s Prediction For Meme Coins, AI & DeFi Coins For 2025

Expert Sees Bitcoin Dipping To $50K While Bullish Signs Persist

3 Voting Polls Show Why Ripple’s XRP Price Could Hit $10 Soon

Aptos Leverages Chainlink To Enhance Scalability and Data Access

Bitcoin Could Rally to $80,000 on the Eve of US Elections

Crypto’s Big Trump Gamble Is Risky

Sonic Now ‘Golden Standard’ of Layer-2s After Scaling Transactions to 16,000+ per Second, Says Andre Cronje

Institutional Investors Go All In on Crypto as 57% Plan to Boost Allocations as Bull Run Heats Up, Sygnum Survey Reveals

The Future of Bitcoin: Scaling, Institutional Adoption, and Strategic Reserves with Rich Rines

Ripple-SEC Case Ends, But These 3 Rivals Could Jump 500x

Has The Bitcoin Price Already Peaked?

A16z-backed Espresso announces mainnet launch of core product

Xmas Altcoin Rally Insights by BNM Agent I

Blockchain groups challenge new broker reporting rule

I’m Grateful for Trump’s Embrace of Bitcoin
Trending

 24/7 Cryptocurrency News6 months ago
Arthur Hayes, Murad’s Prediction For Meme Coins, AI & DeFi Coins For 2025

 Bitcoin3 months ago
Expert Sees Bitcoin Dipping To $50K While Bullish Signs Persist
 Ripple Price1 month ago
3 Voting Polls Show Why Ripple’s XRP Price Could Hit $10 Soon

 24/7 Cryptocurrency News4 months ago
Aptos Leverages Chainlink To Enhance Scalability and Data Access

 Bitcoin6 months ago
Bitcoin Could Rally to $80,000 on the Eve of US Elections

 Opinion6 months ago
Crypto’s Big Trump Gamble Is Risky

 Altcoins3 months ago
Sonic Now ‘Golden Standard’ of Layer-2s After Scaling Transactions to 16,000+ per Second, Says Andre Cronje

 Bitcoin5 months ago
Institutional Investors Go All In on Crypto as 57% Plan to Boost Allocations as Bull Run Heats Up, Sygnum Survey Reveals


