Markets
Shiba Inu price prepares a big move as burn rate surges 940%
Published
5 months agoon
By
admin
Shiba Inu price is preparing for a massive bullish breakout as its token burn accelerates, the crypto fear and greed index remains in the green zone, and a bullish pattern forms.
Shiba Inu (SHIB), second-biggest meme coin, was trading at $0.000026 on Tuesday, Nov. 19, slightly above last Friday’s low of $0.0000246. It has jumped by 142% from its lowest level in August.
SHIB’s rebound occurred as data from Shiburn showed that the number of Shiba Inu tokens burned on Tuesday surged by almost 940% to 3.69 million. This burn brought the total number of burnt SHIB tokens to over 410 trillion, while its circulating supply stood at 583.7 trillion tokens.
Shiba Inu’s token burn involves sending tokens to a wallet without a key, effectively removing them from circulation. These tokens come from its ecosystem networks like Shibarium and ShibaSwap, as well as voluntary contributions by community members.
Shiba Inu is also recovering as the crypto fear and greed index remains in the extreme greed zone at 83. Historically, altcoins tend to perform well when there is a heightened sense of greed in the crypto market.
This sentiment has also driven gains in other meme coins, bringing the total market cap of the meme coin sector to $128 billion. This valuation surpasses that of large companies such as Lockheed Martin, Palo Alto Networks, ADP, and Airbus.
Shiba Inu price has formed a bullish pattern
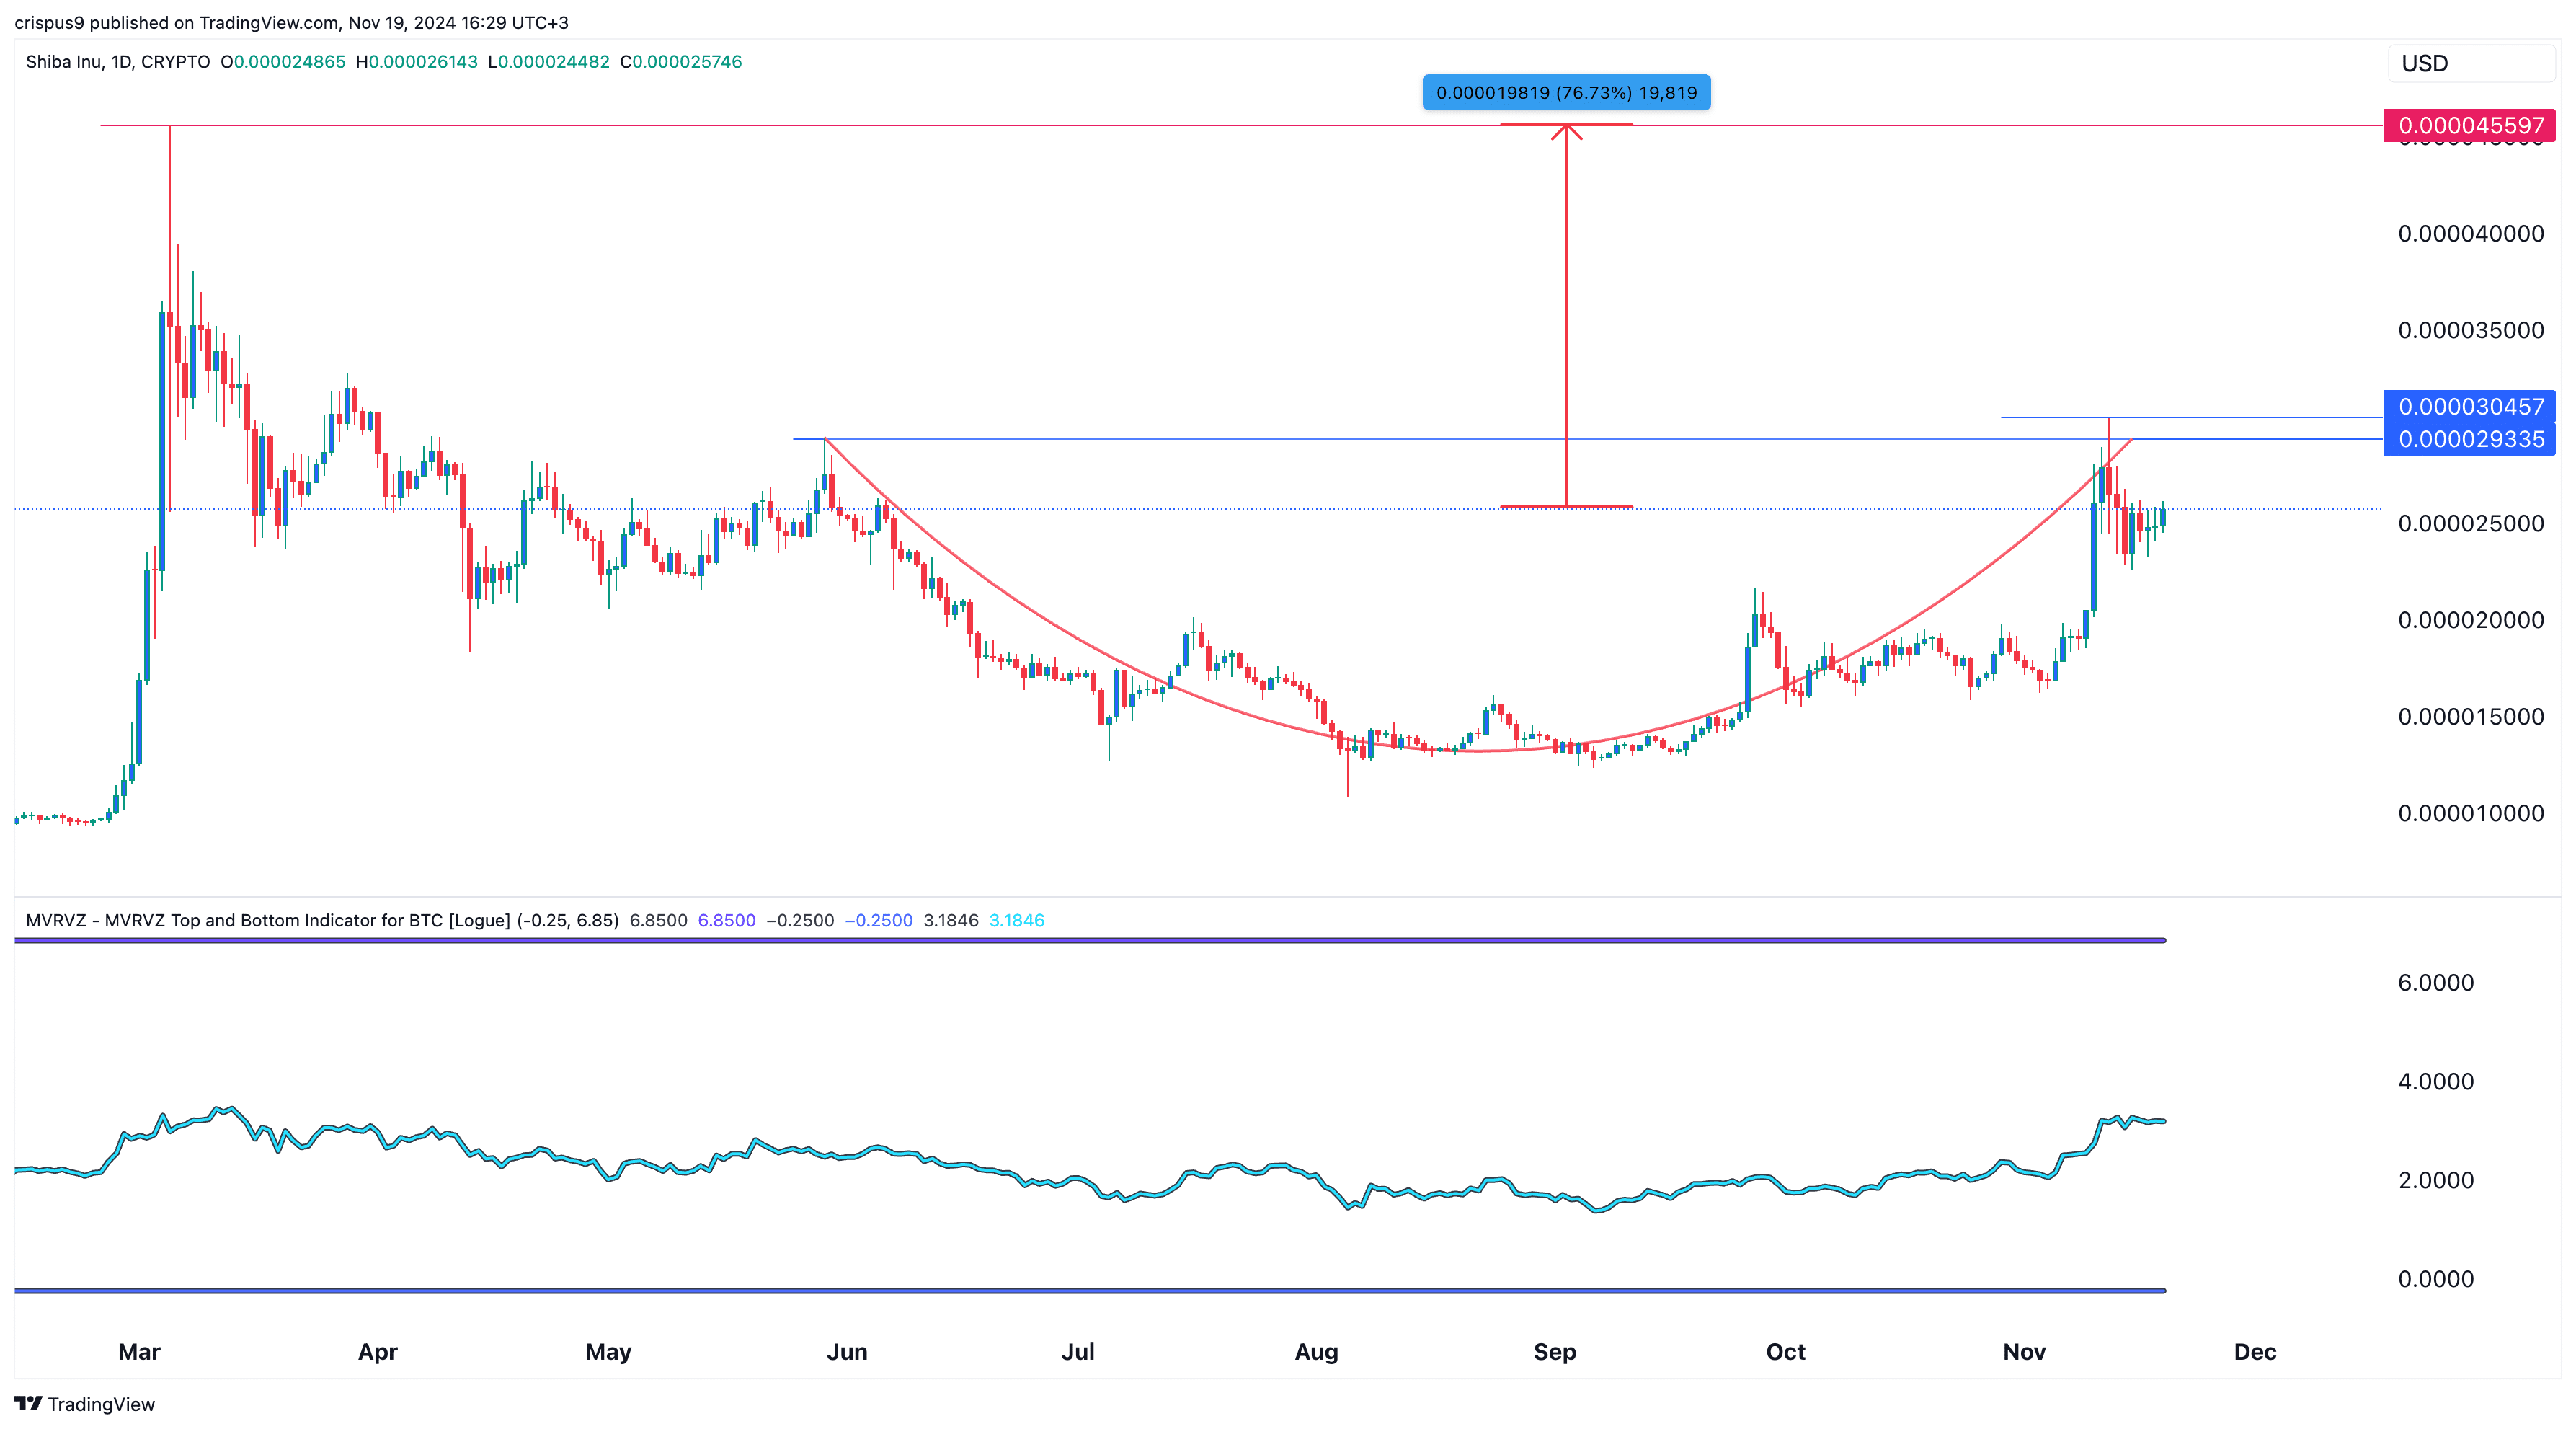
The outlook for Shiba Inu remains bullish, as the coin has formed a highly bullish pattern on the daily chart. It displays a cup and handle formation, characterized by a rounded bottom followed by a pullback or consolidation near the top.
The coin is in the process of forming the handle section. A break above the upper side of the cup at $0.00002933 could signal further gains, with the next target being the year-to-date high of $0.000045—76% higher than the current level.
Shiba Inu remains above the 50-day moving average, while the Market Value to Realized Value indicator has climbed above 3. However, a drop below the key support level at $0.000020 would invalidate the bullish outlook.
Source link
You may like


Crypto Investors Sue Nike, Accuse Apparel Giant of Rug Pull After Abrupt Closure of Metaverse Business: Report


Top cryptocurrencies to watch: Pi Network, XRP, Sui


This Week in Crypto Games: Ubisoft’s ‘Might & Magic’, ‘Peaky Blinders’ in Development


Why Arbitrum-Nvidia Partnership Collapsed – And What It Means for Web3


Tariff Carnage Starting to Fulfill BTC’s ‘Store of Value’ Promise


The cost of innovation — Regulations are Web3’s greatest asset
Markets
Top cryptocurrencies to watch: Pi Network, XRP, Sui
Published
1 hour agoon
April 27, 2025By
admin
Cryptocurrency prices rallied last week as U.S. President Donald Trump said, without citing examples, that trade talks with other countries were taking place.
Bitcoin (BTC) jumped above $95,000 for the first time in over a month, while the market cap of all Solana (SOL) meme coins jumped to over $10 billion. This article explains why Pi Network (PI), Ripple (XRP), and Sui (SUI) are the top cryptocurrencies to watch this week.
Sui token unlock could disrupt the rally
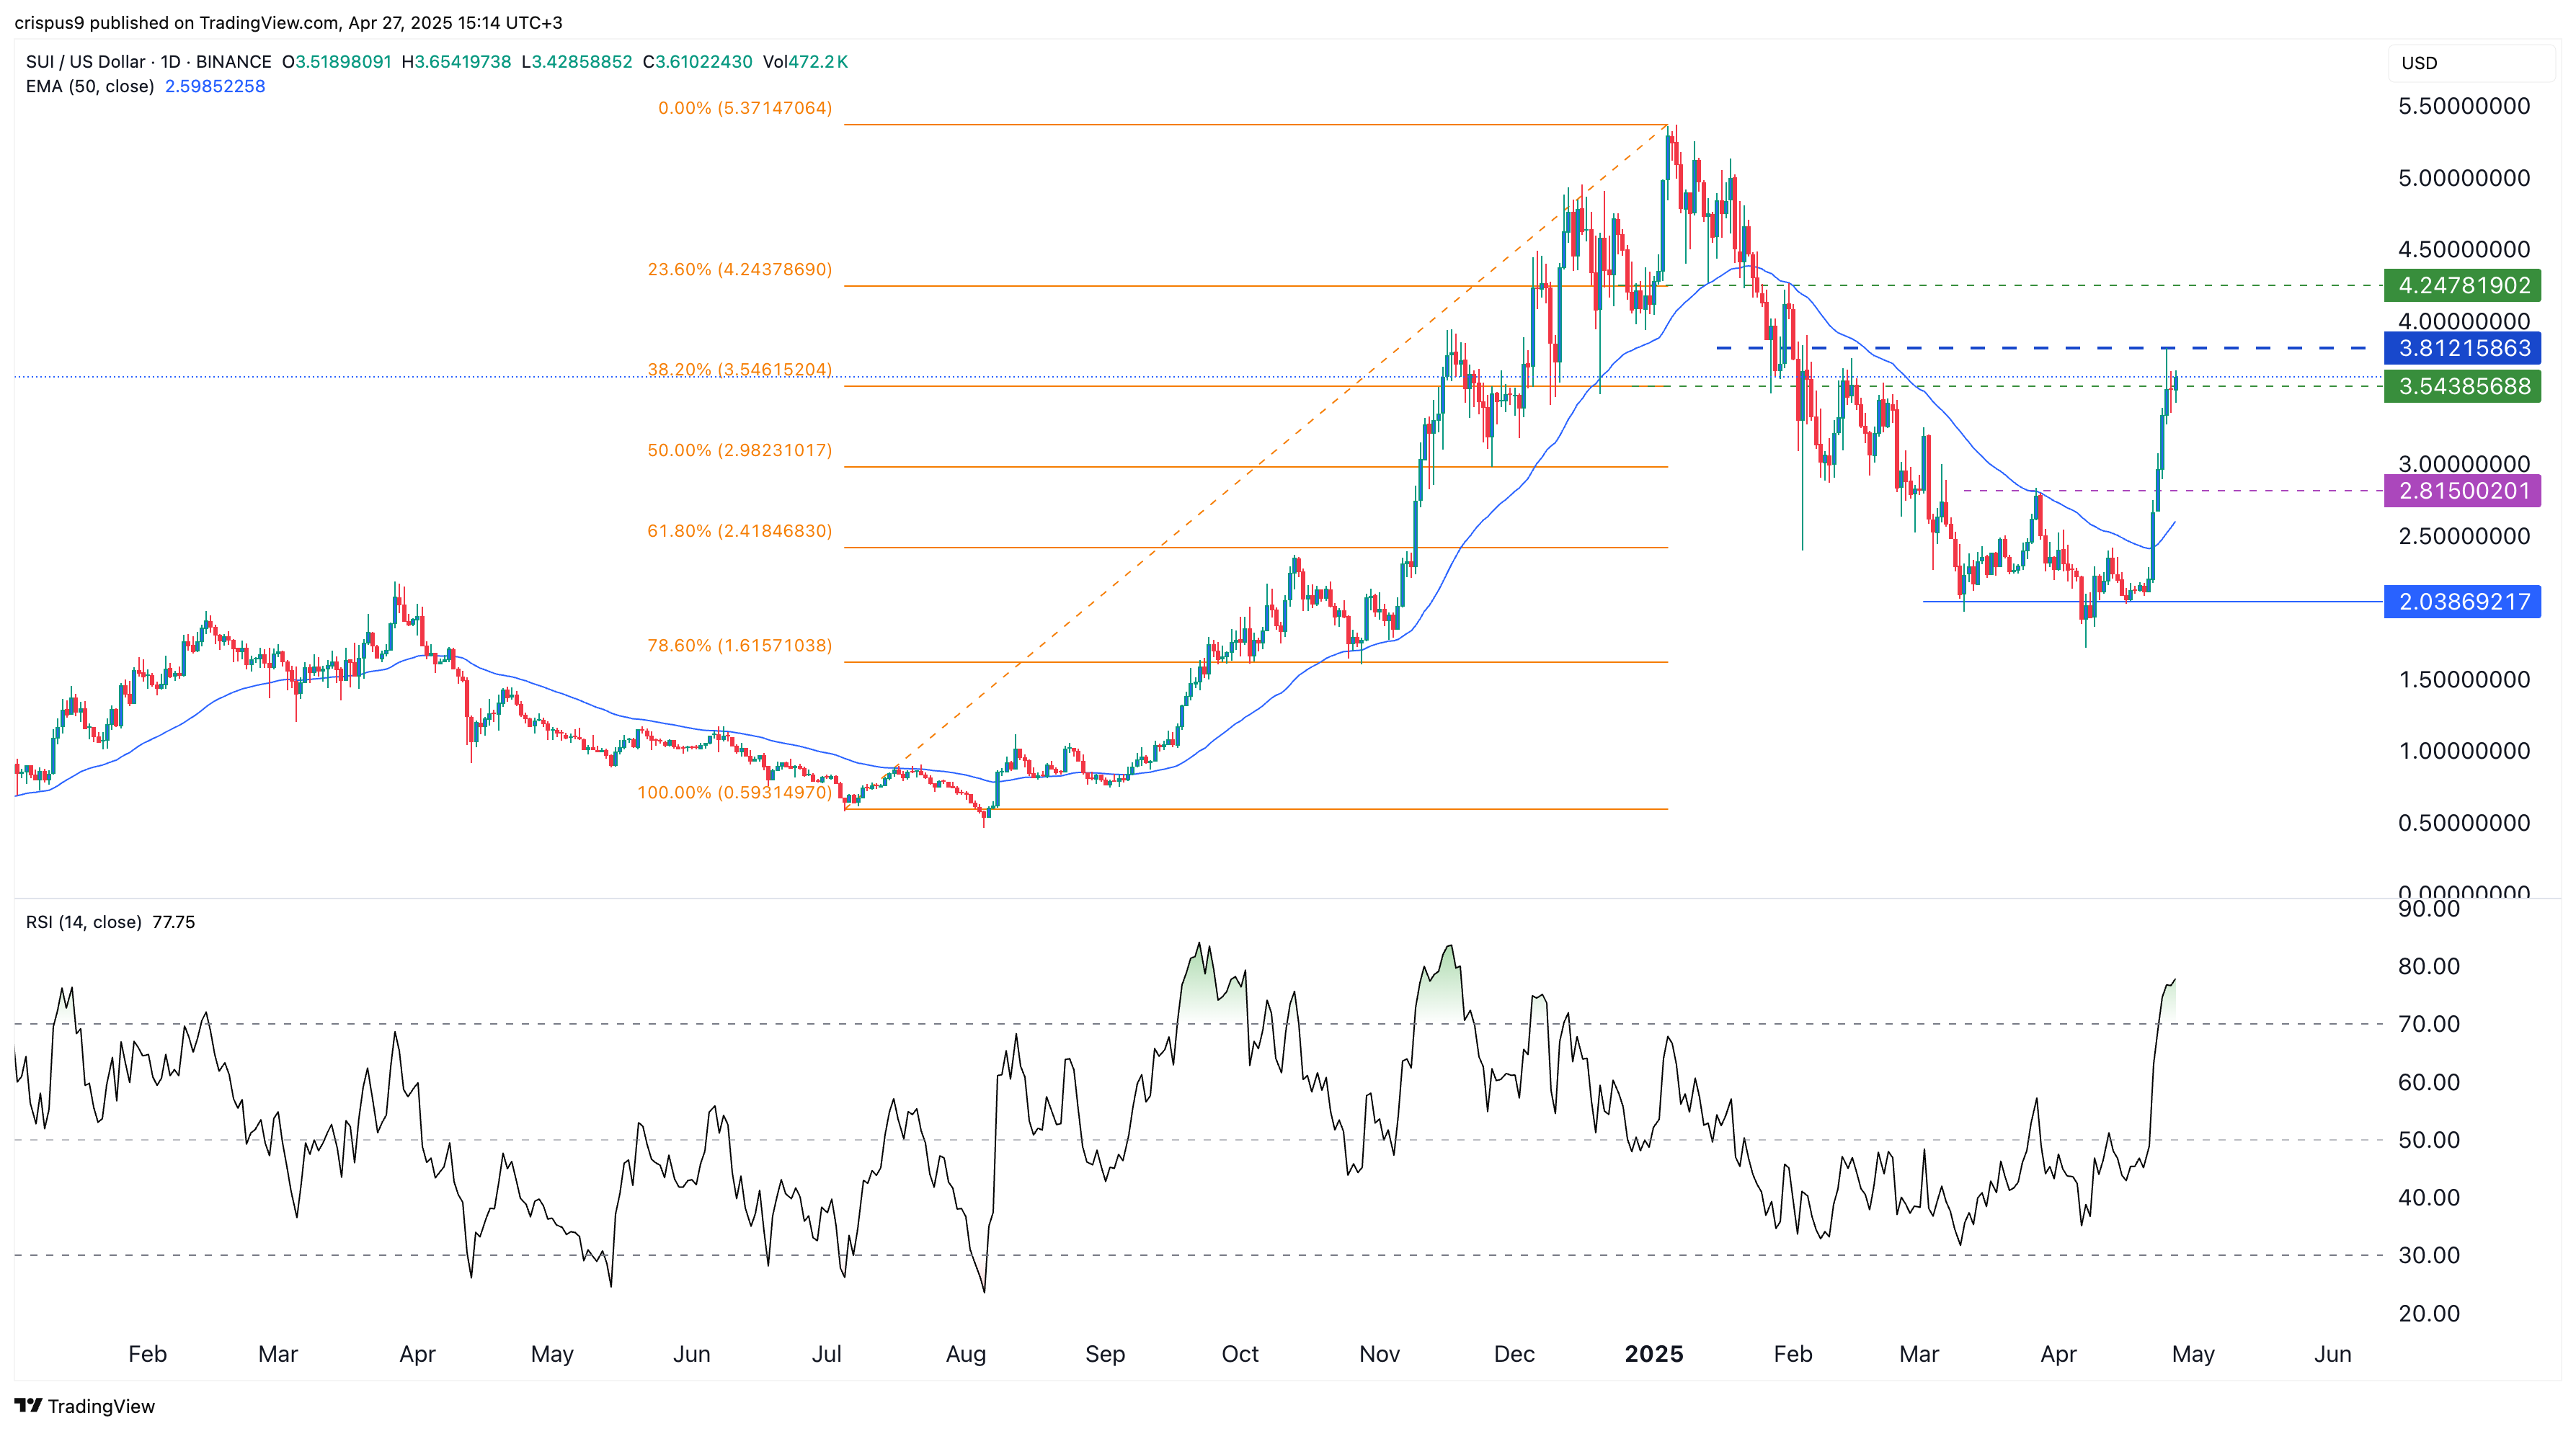
Sui, a top layer-1 network, was one of the top-performing coins in the crypto industry as it jumped to $3.8, its highest level since Feb. 1, and up by 110% from its lowest level this month.
It rallied as top meme coins in its ecosystem surged, resulting in a 60% increase in weekly DEX volume. Protocols in its platform handled over $3.43 billion in volume in the last 7 days, bringing the monthly transactions to over $11 billion.
Sui’s surge may be disrupted by a big token unlock scheduled for Thursday. The network will release tokens worth $120 million. Token unlocks lead to dilution, often affecting a coin’s performance.
The daily chart also shows that the SUI price has become overbought as the Relative Strength Index has moved to 77. Therefore, the coin is likely to retreat and retest the key support at $2.8150, the neckline of the double-bottom pattern at $2.
XRP price sits at a key level
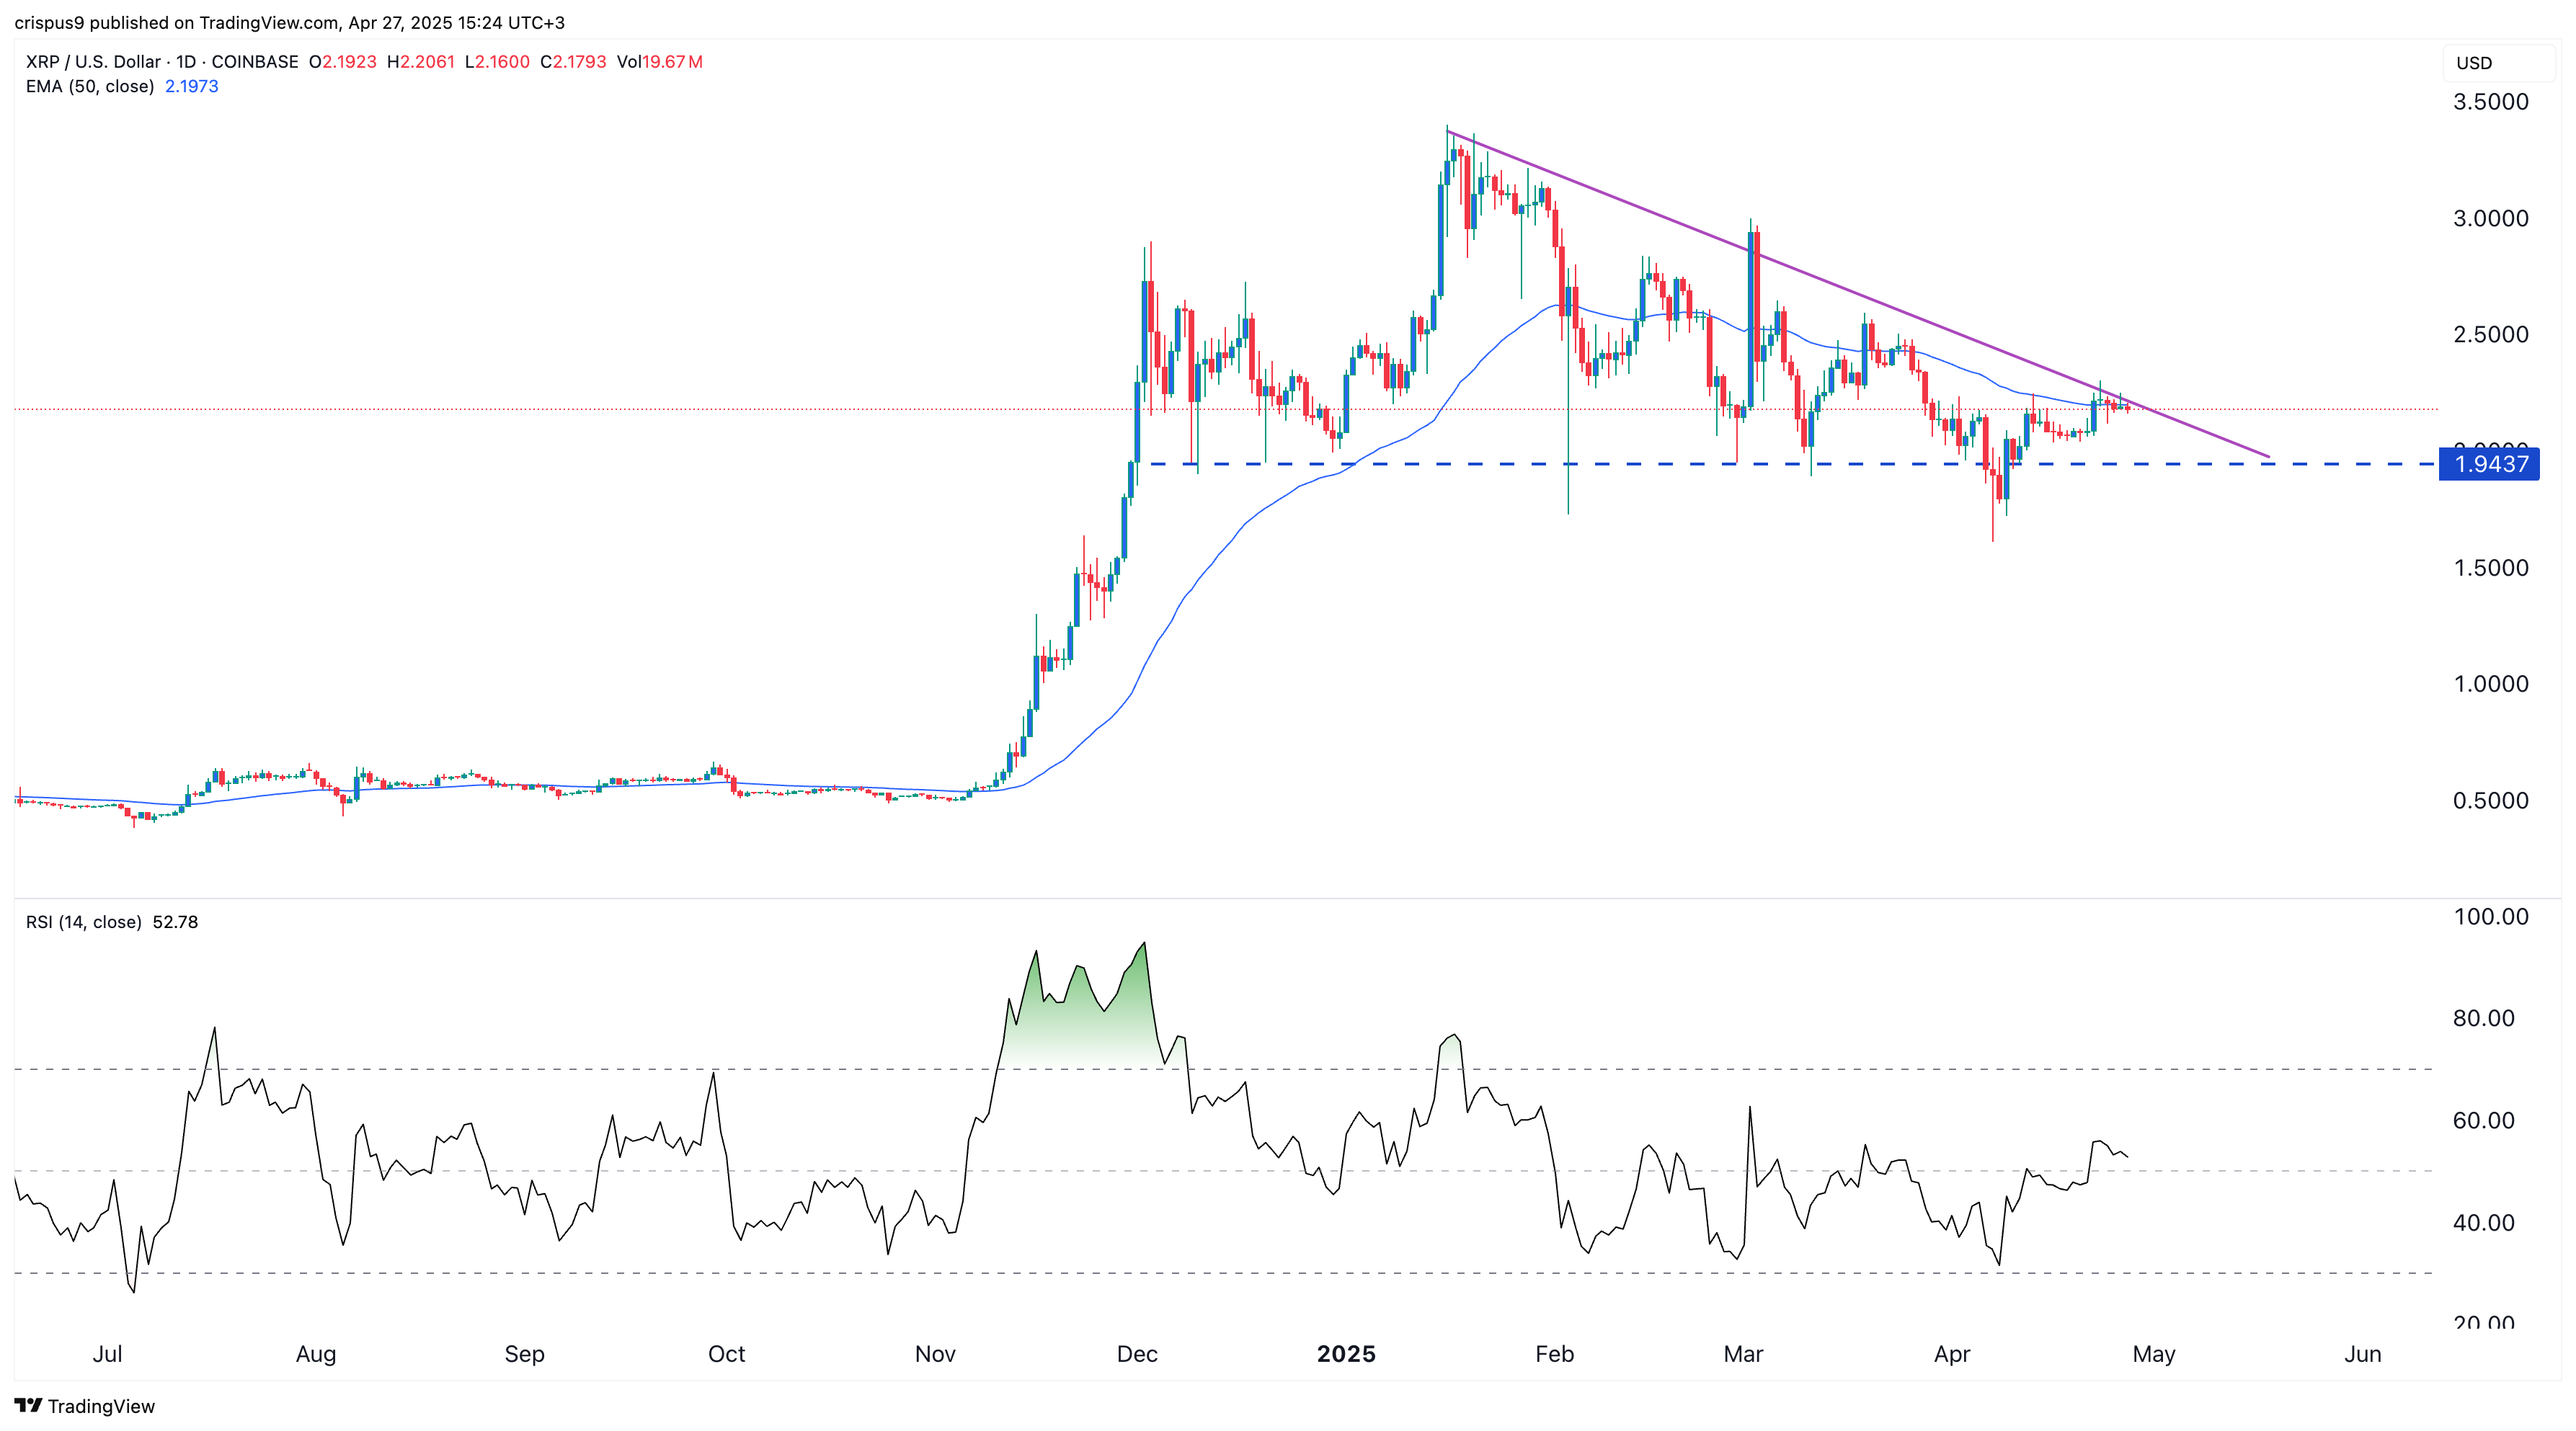
Because of its technicals, Ripple’s token will be in the spotlight this week. The chart below shows that the XRP price was trading at $2.17 on Sunday, a notable level for two reasons. First, it is along the 50-day Exponential Moving Average, which has provided substantial resistance in the past few months.
Second, the price is along the descending trendline connecting the highest levels since January 16. This trendline is the upper side of the descending triangle, whose lower side is at $1.9437.
A descending triangle is a popular bearish chart pattern. Therefore, the coin will need to rise above the slanted trendline and the 50-day moving average to invalidate the bearish outlook of the triangle.
Pi Network: Will the consolidation end?
Pi Network will be a top cryptocurrency to watch this week as its consolidation continues. It has remained at $0.6350 in the past few weeks, and it did not participate in last week’s crypto recovery.
Therefore, this consolidation may be calm before the storm since all Pi needs is a minor catalyst, and its price will go parabolic. A potential catalyst will be an exchange listing by one or more tier-one companies. HTX, a top exchange that is advised by Justin Sun, has been sending hints that it will list it soon. For example, Pi Network has appeared on several X posts, including the one shown below and this one.
Other top cryptocurrencies to watch this week include Cetus Protocol, Maverick Protocol, Optimism, Pendle, and Morpho, which will have token unlocks, and BSC will launch the Lorentz upgrade.
Source link
Bitcoin
Tariff Carnage Starting to Fulfill BTC’s ‘Store of Value’ Promise
Published
5 hours agoon
April 27, 2025By
admin
April has been a month of extreme volatility and tumultuous times for traders.
From conflicting headlines about President Donald Trump’s tariffs against other nations to total confusion about which assets to seek shelter in, it has been one for the record books.
Amid all the confusion, when traditional “haven assets” failed to act as safe places to park money, one bright spot emerged that might have surprised some market participants: bitcoin.
“Historically, cash (the US dollar), bonds (US Treasuries), the Swiss Franc, and gold have fulfilled that role [safe haven], with bitcoin edging in on some of that territory,” said NYDIG Research in a note.

NYDIG’s data showed that while gold and Swiss Franc had been consistent safe-haven winners, since ‘Liberation Day’—when President Trump announced sweeping tariff hikes on April 2, kicking off extreme volatility in the market—bitcoin has been added to the list.
“Bitcoin has acted less like a liquid levered version of levered US equity beta and more like the non-sovereign issued store of value that it is,” NYDIG wrote.
Zooming out, it seems that as the “sell America” trade gains momentum, investors are taking notice of bitcoin and the original promise of the biggest cryptocurrency.
“Though the connection is still tentative, bitcoin appears to be fulfilling its original promise as a non-sovereign store of value, designed to thrive in times like these,” NYDIG added.
Read more: Gold and Bonds’ Safe Haven Allure May be Fading With Bitcoin Emergence
Source link
Markets
Bitcoin Post-Halving Price Performance Is the Worst on Record. Why?
Published
11 hours agoon
April 27, 2025By
admin
In brief
- Bitcoin’s quadrennial halving happened one year ago, cutting block rewards for miners in half.
- Bitcoin usually soars one year after the event happens, due to slowing issuance of new coins.
- Yes, BTC has jumped to a new high—but the percentage growth pales in comparison to past cycles.
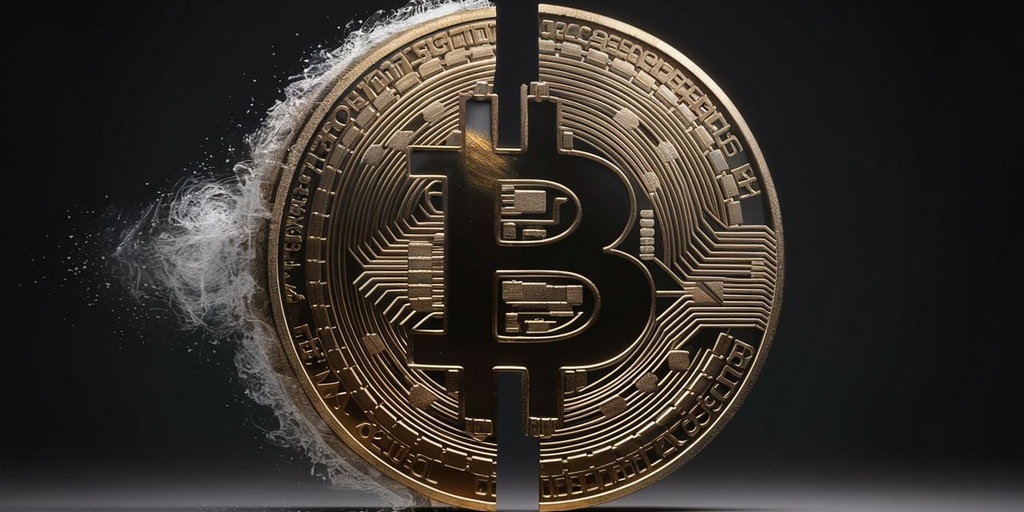
It’s been one year since Bitcoin had its quadrennial halving event, which usually sends the price soaring.
But while it’s true that Bitcoin rose to an all-time high in the months following the latest halving in April 2024, the percentage spike has not been nearly as sizable as in past cycles.
Data provider Kaiko told Decrypt that though the biggest coin’s price is indeed up, macroeconomic factors have hindered it from making the same kind of gains.
In the report, Kaiko said that at recent levels, the increases represented the “weakest post-halving performance on record in terms of percentage growth.”
Following a surge over the past week, Bitcoin was around $95,000 on Friday, up about 49% since the halving. Past percentage increases have reached well into the three or four figures during the same timespan.
“One of the main changes [with this Bitcoin cycle] is the current macro regime—interest rates have never been this high,” Kaiko Senior Analyst Dessislava Aubert told Decrypt, adding that “the current period of high uncertainty” has hurt the coin’s performance.
Bitcoin has typically performed well in a low-interest rate environment, along with other risk-on assets like stocks. But those have swooned amid investor fears that U.S. President Donald Trump’s trade war, dramatic cost-cutting, and other macroeconomic uncertainties would send prices higher and stunt growth.
Bitcoin soared to a peak price of just under $109,000 on January 20, the day of Trump’s inauguration, as crypto markets expected the new administration’s policies to help the industry.
The halving takes place every four years and slashes block rewards for miners—the power-hungry operations that process transactions on the network—in half. With fewer digital coins entering circulation, investors and industry observers generally expect the asset to surge.
Case in point: Before Bitcoin’s first halving in 2012, it was priced at $12.35. One year later, the price of the coin stood at $964, a nearly 8,000% gain.
At the next halving on July 9, 2016, Bitcoin was trading hands for $663. Fast-forward to 2017 and it had shot up in value and was priced at $2,500—a 277% increase.
And at the previous halving, which took place on May 11, 2020, BTC was valued at $8,500. A bull run followed the next year, and Bitcoin skyrocketed to an all-time high price above $69,000, a 762% rise.
The last halving cut miners’ rewards from 6.25 BTC to 3.125 BTC for each block they process. But Bitcoin’s price is barely 50% higher than it was last year.
That has confounded experts, who previously told Decrypt that the halving—along with the historic approval of spot Bitcoin ETFs last January—would lead to a phenomenal run for the leading cryptocurrency. While it has indeed surged and put up substantial dollar gains, the scale of the spike has underwhelmed industry observers.
Retail investors aren’t the only ones who are disappointed. The extraordinarily tough mining industry is also suffering, with a lower BTC price meaning that businesses are being forced to sell off coins more so than before to cover operational costs.
Curtis Harris, Compass Mining’s senior director of growth, noted that increased mining difficulty—fierce competition for smaller rewards—is making it harder for businesses to survive in the industry.
“Unlike previous cycles, the April 2024 halving hasn’t delivered the explosive price growth many miners expected,” he told Decrypt, adding also that “the bigger economic picture” was also making it tough for the space.
Trump’s election win in November and his subsequent inauguration led to a new all-time high price for Bitcoin. But the asset has since plunged and only partially recovered amid investor angst about his erratic policies on trade tariffs and the economy.
“These raise the cost of borrowing, make miners more cautious, and slow down investment in new mining operations,” he added.
But Compass Mining Chief Mining Officer Shanon Squires told Decrypt that miners could have foreseen that the rally would be less lively than past post-halving ones.
“Most have a stable profit if they are optimizing operating expenses and running a good business,” Squires said. “Anyone who built their mining farm expecting $1 million Bitcoin today wasn’t paying attention.”
Edited by Andrew Hayward
Daily Debrief Newsletter
Start every day with the top news stories right now, plus original features, a podcast, videos and more.
Source link

Crypto Investors Sue Nike, Accuse Apparel Giant of Rug Pull After Abrupt Closure of Metaverse Business: Report

Top cryptocurrencies to watch: Pi Network, XRP, Sui

This Week in Crypto Games: Ubisoft’s ‘Might & Magic’, ‘Peaky Blinders’ in Development

Why Arbitrum-Nvidia Partnership Collapsed – And What It Means for Web3

Tariff Carnage Starting to Fulfill BTC’s ‘Store of Value’ Promise

The cost of innovation — Regulations are Web3’s greatest asset

Best Crypto to Buy as Derivatives Exchange CME Set to Launch XRP Futures

Metaplanet Buys Additional ¥1.92 Billion Worth Of Bitcoin

Here Are Four Signs the Stock Market Has Bottomed, According to Fundstrat’s Tom Lee

Bitcoin dips below $94,000 as ETFs record $3b weekly inflow

Bitcoin Post-Halving Price Performance Is the Worst on Record. Why?

Expert Predicts Start Date For Pi Network Price Pump

GameFi Tokens Show Signs of Life After Gala Games, White House Tie-Up

Bitcoin trades at ‘40% discount’ as spot BTC ETF buying soars to $3B in one week

Bitcoin Continues To Flow Out Of Major Exchanges — Supply Squeeze Soon?

Arthur Hayes, Murad’s Prediction For Meme Coins, AI & DeFi Coins For 2025

Expert Sees Bitcoin Dipping To $50K While Bullish Signs Persist

3 Voting Polls Show Why Ripple’s XRP Price Could Hit $10 Soon

Aptos Leverages Chainlink To Enhance Scalability and Data Access

Bitcoin Could Rally to $80,000 on the Eve of US Elections

Crypto’s Big Trump Gamble Is Risky

Institutional Investors Go All In on Crypto as 57% Plan to Boost Allocations as Bull Run Heats Up, Sygnum Survey Reveals

Sonic Now ‘Golden Standard’ of Layer-2s After Scaling Transactions to 16,000+ per Second, Says Andre Cronje

The Future of Bitcoin: Scaling, Institutional Adoption, and Strategic Reserves with Rich Rines

Ripple-SEC Case Ends, But These 3 Rivals Could Jump 500x

Has The Bitcoin Price Already Peaked?

A16z-backed Espresso announces mainnet launch of core product

Xmas Altcoin Rally Insights by BNM Agent I

Blockchain groups challenge new broker reporting rule

I’m Grateful for Trump’s Embrace of Bitcoin
Trending

 24/7 Cryptocurrency News6 months ago
Arthur Hayes, Murad’s Prediction For Meme Coins, AI & DeFi Coins For 2025

 Bitcoin3 months ago
Expert Sees Bitcoin Dipping To $50K While Bullish Signs Persist
 Ripple Price1 month ago
3 Voting Polls Show Why Ripple’s XRP Price Could Hit $10 Soon

 24/7 Cryptocurrency News4 months ago
Aptos Leverages Chainlink To Enhance Scalability and Data Access

 Bitcoin6 months ago
Bitcoin Could Rally to $80,000 on the Eve of US Elections

 Opinion6 months ago
Crypto’s Big Trump Gamble Is Risky

 Bitcoin5 months ago
Institutional Investors Go All In on Crypto as 57% Plan to Boost Allocations as Bull Run Heats Up, Sygnum Survey Reveals

 Altcoins3 months ago
Sonic Now ‘Golden Standard’ of Layer-2s After Scaling Transactions to 16,000+ per Second, Says Andre Cronje


