
SOL
Solana Breakout From Bullish Pattern Could ‘Send SOL To The Moon’ – Crypto Analyst
Solana (SOL) has shown remarkable strength in recent weeks, surging by 32% over the past fifteen days. This impressive price action has positioned SOL as one of the top-performing assets, outpacing Bitcoin and many other altcoins.
Analysts and investors are increasingly optimistic about Solana’s potential, with many forecasting continued upward momentum in the weeks ahead. Notably, prominent investor Carl Runefelt recently shared a technical analysis on SOL, highlighting a breakout from a bullish pattern that could signal massive gains for the cryptocurrency.
Related Reading
With this breakout, price action remains firmly bullish, indicating that the next major target for SOL is around the $185 level, where it will encounter local supply. If momentum holds, Solana could soon challenge this key resistance, further solidifying its place as a leader in the current market cycle.
Solana Breaking Out Of Cup&Handle Pattern
Solana is breaking out from a classic “Cup & Handle” pattern, often associated with strong bullish moves. This pattern has caught the attention of top analyst Carl Runefelt, who recently shared his technical analysis on X, indicating that Solana’s recent price action aligns with a breakout from a descending channel.
According to Runefelt, this setup signals that Solana could be ready for a significant upward move. He shared a chart with a potential price target of $370, suggesting a substantial 115% surge from current levels.
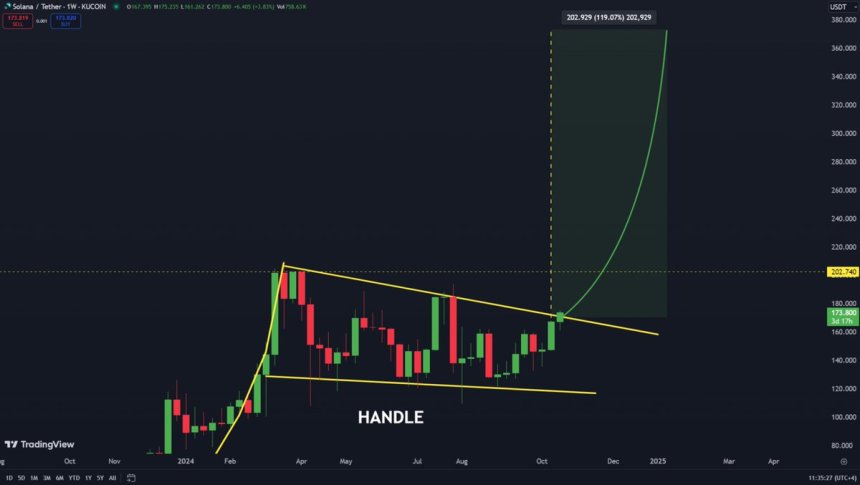
Runefelt’s optimism stems from the Cup & Handle pattern, where the price consolidates after an uptrend and then forms a small dip (the handle) before breaking out. This pattern is known to attract strong buyer interest, representing a period of consolidation and momentum building.
However, while the breakout is promising, it may take some time to fully play out, as the entire crypto market appears to settle before its next significant move. Solana has consistently outperformed in this cycle, with price action and volume reflecting sustained investor interest.
Related Reading
With Solana pushing through key resistance levels and establishing a solid foundation, the potential for a bullish continuation is high. If the breakout confirms and Solana’s momentum holds, the next weeks could see SOL pushing into new heights, solidifying its position as a top-performing altcoin and meeting investors’ bullish expectations for substantial gains ahead.
SOL Testing Crucial Supply
Solana is trading at $171, maintaining a strong uptrend with a well-defined bullish structure over the past two weeks. This level represents a key demand zone that previously acted as resistance, signaling a potential for higher gains if the price holds steady. A continued hold above $171 would support further bullish momentum, potentially pushing SOL toward the next significant supply area at $185.
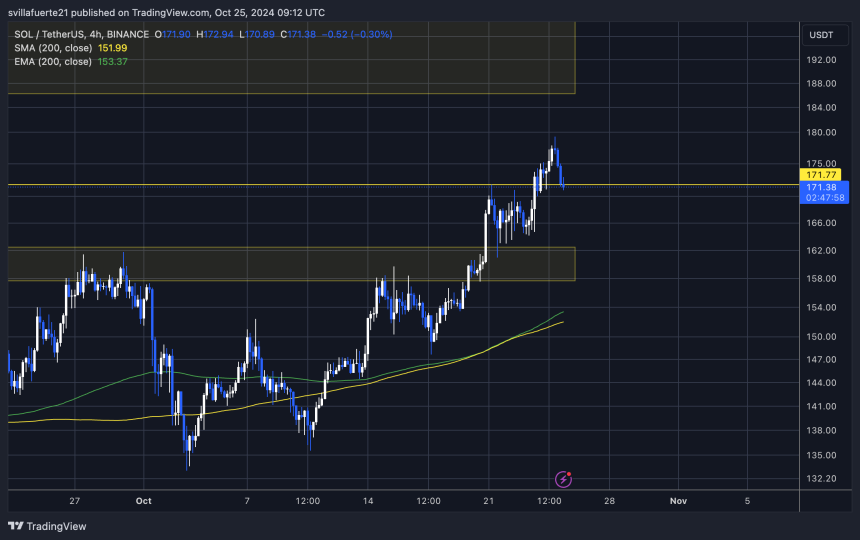
However, should SOL lose the $171 support, a retrace to around $160 is likely. This level has been pivotal in the past weeks, serving as a strong resistance point that capped previous price attempts to rise, creating a solid foundation for renewed bullish interest. A move down to $160 wouldn’t necessarily break the overall uptrend but would offer an opportunity to consolidate before the next push higher.
Related Reading
As investors and traders watch these levels closely, the $171 mark will be an immediate gauge of strength. Holding above it keeps the uptrend intact, while a dip to $160 would still offer support for Solana’s longer-term bullish outlook. SOL’s resilience in these levels reflects the optimism surrounding the asset’s potential in the weeks ahead.
Featured image from Dall-E, chart from TradingView
Source link


The crypto market is surging, drawing investors seeking lucrative opportunities. Among the best altcoins to buy, three standout assets show significant potential for explosive growth. Backed by bullish trends and strong fundamentals, these cryptocurrencies are positioned as promising investment options, making them must-watch contenders for major returns in early 2025.
Altcoins to Buy: Cardano (ADA)
Cardano (ADA), a leading third-generation blockchain, is gaining traction for its eco-friendly proof-of-stake (PoS) consensus mechanism. Unlike energy-intensive proof-of-work networks, Cardano offers sustainable solutions. Over the past year, the ADA price has doubled, reaching $1.10. This growth stands out among the top altcoins to buy in 2025, presenting the potential for significant gains within the next 60 days.
Crypto analyst Ali has predicted a bullish breakout for Cardano (ADA), identifying a potential target price of $3. According to his recent analysis, ADA is forming a classic bull pennant pattern on the charts, a formation often associated with upward price momentum.

DexBoss (DEBO)
DexBoss (DEBO) has initiated its token presale, pricing each token at $0.011. The listing price is set at $0.0505. The project introduces a deflationary buyback-and-burn mechanism designed to reduce supply and increase token value. DexBoss seeks to replicate centralized exchange features within a decentralized platform, offering a seamless DeFi experience.
With a fixed supply and growing demand, the project aims to attract investors looking for long-term returns. DexBoss presents a compelling opportunity for individuals exploring decentralized finance advancements and the rapidly growing DeFi ecosystem.
Solana (SOL)
Solana (SOL), an open-source blockchain, is making waves in decentralized finance (DeFi). Supporting various decentralized applications (DApps), the SOL price increased by 4% in the past 24 hours, reaching $217. Over the last year, Solana’s market capitalization has grown by 125%, underscoring its rapid expansion within the layer-one blockchain ecosystem, making it the best altcoin to buy.
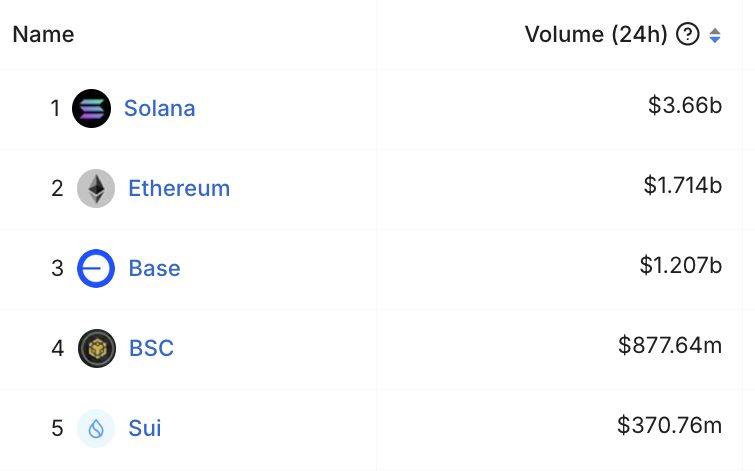
Solana led blockchain activity with $3.66 billion in daily trading volume, surpassing Ethereum’s $1.714 billion. Base followed with $1.207 billion, while Binance Smart Chain (BSC) and Sui recorded $877.64 million and $370.76 million, respectively.
Investors seeking altcoins to buy in 2025 should consider these three assets for their potential to outperform in the near term. With solid fundamentals and growth-driven roadmaps, they remain strong contenders for notable gains within a bullish crypto market cycle.
Frequently Asked Questions (FAQs)
Cardano offers eco-friendly PoS, bullish momentum, and a $3 price target.
DexBoss is a DeFi platform with deflationary tokenomics and strong growth potential.
Solana dominates DeFi with high activity and rapid market expansion.
Coingape Staff
CoinGape comprises an experienced team of native content writers and editors working round the clock to cover news globally and present news as a fact rather than an opinion. CoinGape writers and reporters contributed to this article.
Disclaimer: The presented content may include the personal opinion of the author and is subject to market condition. Do your market research before investing in cryptocurrencies. The author or the publication does not hold any responsibility for your personal financial loss.
Source link
Ali Martinez
$4,000 Solana? Trader Ali Martinez Says SOL Forming Potentially Massive Cup and Handle Set Up

A closely followed crypto analyst says that smart contract platform Solana (SOL) is potentially forming a bullish technical pattern that could see it surge by over 1,700%.
In a new strategy session, crypto trader Ali Martinez tells his 108,000 followers on the social media platform X that it’s possible the Ethereum (ETH) rival is forming a cup-and-handle pattern that could push it to astronomical levels.
“There’s a chance SOL is forming a cup-and-handle pattern, and it will reach $4,000!”
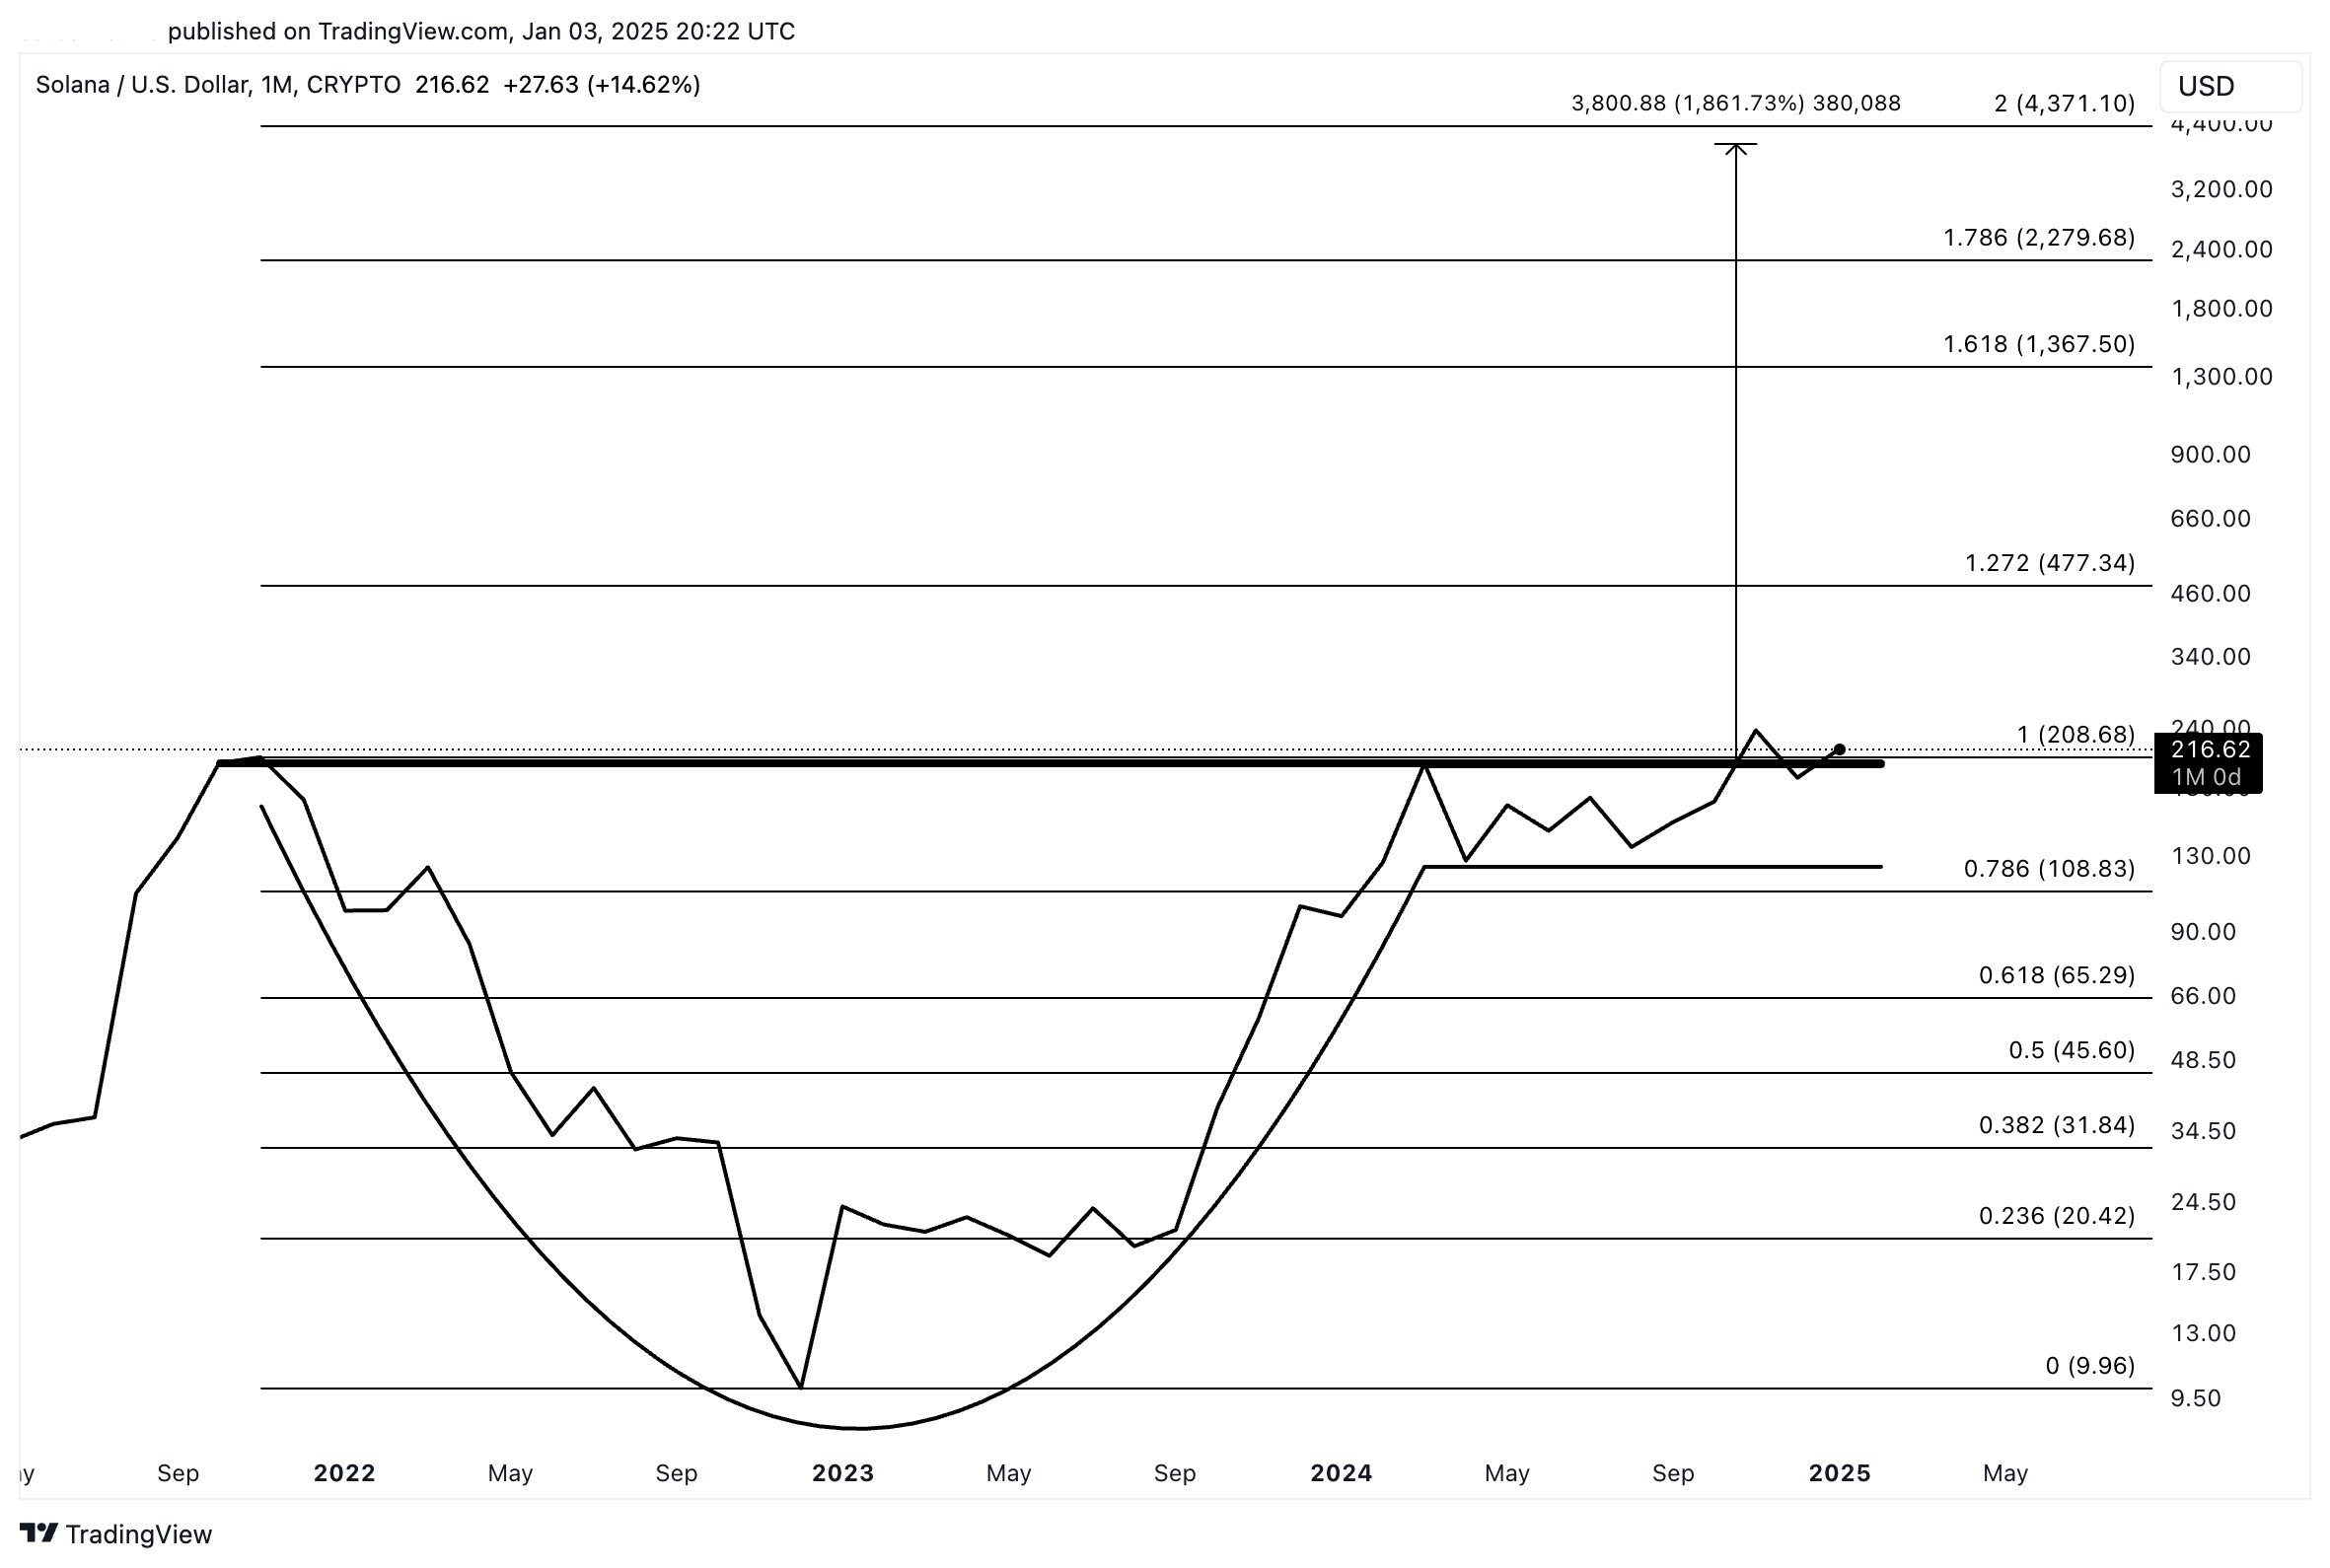
A cup and handle is typically observed when the price movement of an asset forms a “cup” pattern before printing a smaller “handle” structure which suggests consolidation prior to a potential breakout.
Solana is trading for $215 at time of writing, a 1.3% decrease during the last 24 hours. If Solana were to reach Martinez’s target price, it would represent a staggering 1,760% increase.
Moving on to the flagship digital asset Bitcoin (BTC), Martinez notes that Coinbase’s Premium Index – which tracks the price premium for BTC on Coinbase and therefore its demand in the US by proxy – suggests that institutional demand for the top crypto asset by market cap is ramping up in America.
“The Coinbase Premium Index recently hit -0.23%, a two-year low, but it’s now rebounding quickly. This signals growing institutional demand for BTC from US-based investors!”
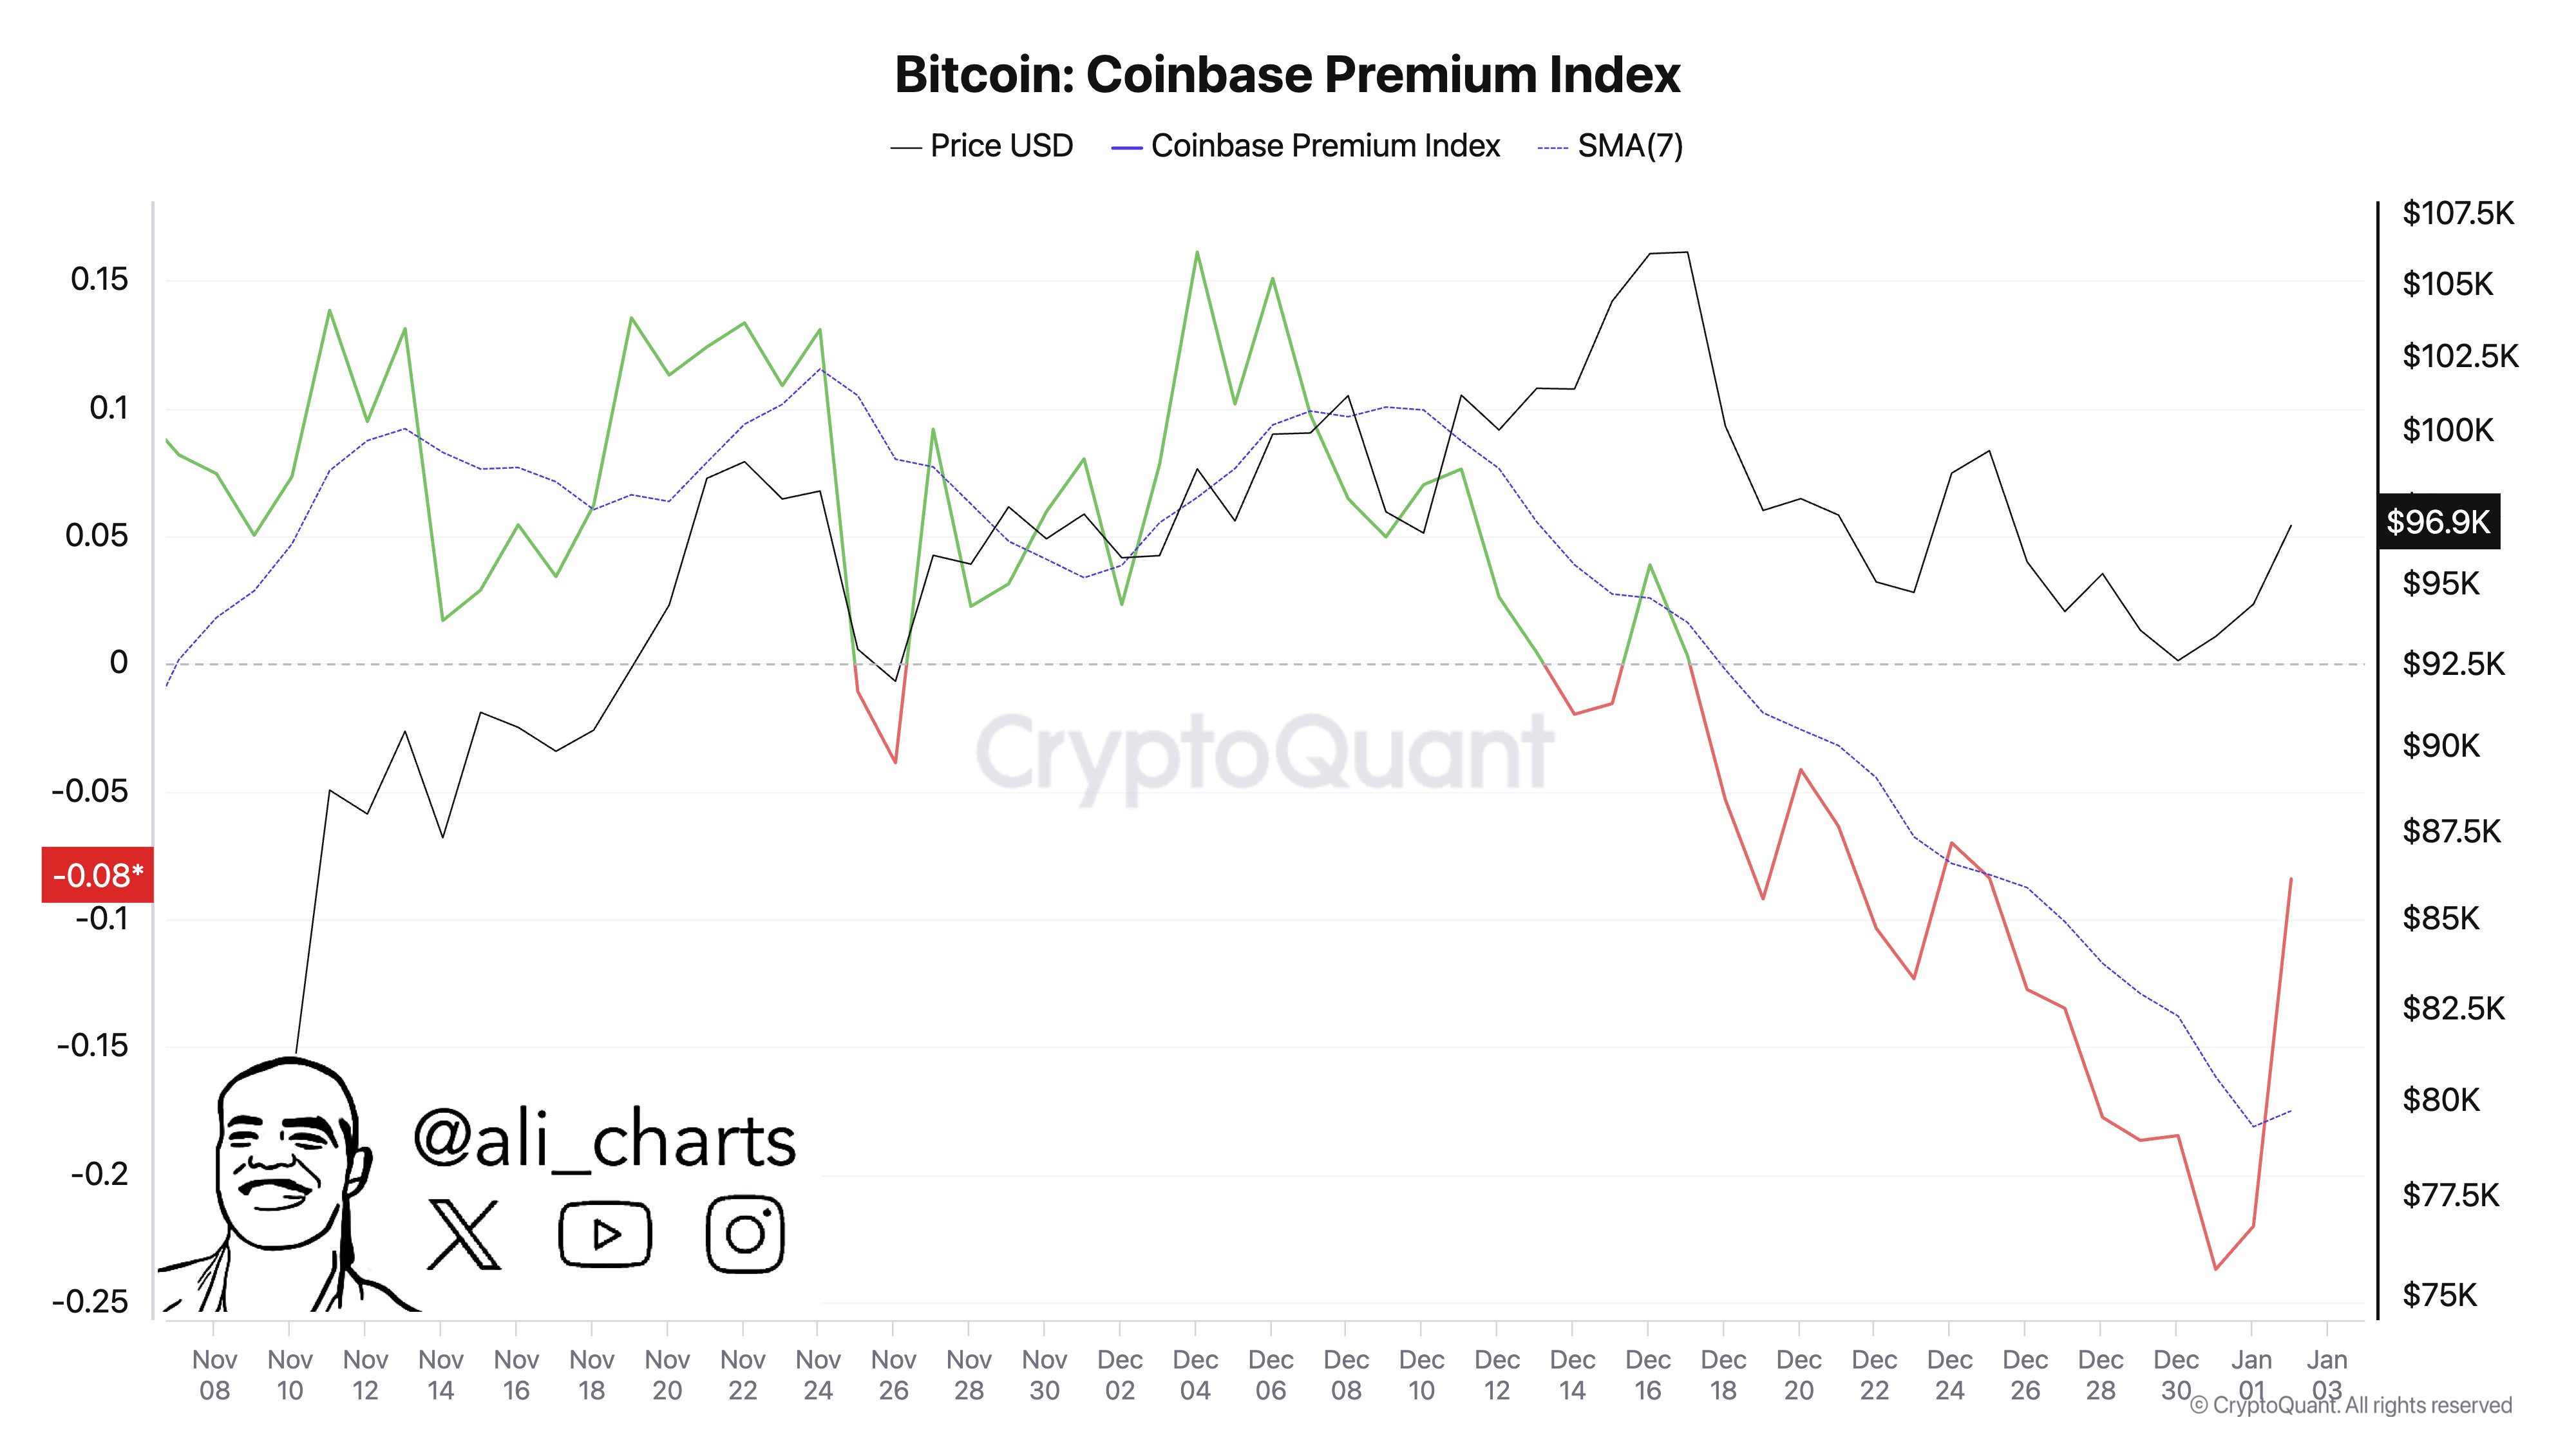
Bitcoin is trading for $98,137 at time of writing, a marginal decrease on the day.
Don’t Miss a Beat – Subscribe to get email alerts delivered directly to your inbox
Check Price Action
Follow us on X, Facebook and Telegram
Surf The Daily Hodl Mix
 

Disclaimer: Opinions expressed at The Daily Hodl are not investment advice. Investors should do their due diligence before making any high-risk investments in Bitcoin, cryptocurrency or digital assets. Please be advised that your transfers and trades are at your own risk, and any losses you may incur are your responsibility. The Daily Hodl does not recommend the buying or selling of any cryptocurrencies or digital assets, nor is The Daily Hodl an investment advisor. Please note that The Daily Hodl participates in affiliate marketing.
Generated Image: DALLE3
Source link
Bitcoin
Bitwise Unveils Crypto Predictions for 2025, Says One Top-10 Altcoin Set To Explode 250% This Year

Digital asset investment manager Bitwise is unveiling its predictions for cryptocurrencies and the industry in 2025.
Starting with Solana (SOL), Bitwise’s head of research Ryan Rasmussen says the asset manager is predicting that the Ethereum (ETH) rival will skyrocket by 250% and hit a price of $750 this year.
Solana is trading at $214 at time of writing, around 18% below the all-time high price of $263 reached in November of 2024.
On Bitcoin (BTC), Bitwise predicts that the crypto king will surge by 106% from the current level to reach a price of $200,000 in 2025. Ethereum, according to Bitwise, will rally by around 99% from the current level to hit a price of $7,000 this year.
Bitcoin is trading at $96,940 at time of writing while Ethereum is worth $3,521.
Turning to US spot Bitcoin exchange-traded funds (ETFs), Rasmussen says Bitwise expects the inflows in 2025 to surpass last year’s figures. The cumulative total net inflows into the US spot Bitcoin ETFs as of January 3rd amounted to approximately $35.66 billion.
Rasmussen also says that Bitwise is predicting that the number of countries holding Bitcoin in their reserves will double in 2025. Some of the countries that currently hold Bitcoin reserves include El Salvador. The Central American country holds over $588.95 million in Bitcoin as of January 3rd.
The Bitwise head of research also cites the crypto asset manager’s bonus prediction that is projected to materialize further into the future.
“In 2029, Bitcoin will overtake the $18 trillion gold market and trade above $1 million.”
Bitcoin has a market cap of approximately $1.917 trillion at time of writing.
Don’t Miss a Beat – Subscribe to get email alerts delivered directly to your inbox
Check Price Action
Follow us on X, Facebook and Telegram
Surf The Daily Hodl Mix
 
Disclaimer: Opinions expressed at The Daily Hodl are not investment advice. Investors should do their due diligence before making any high-risk investments in Bitcoin, cryptocurrency or digital assets. Please be advised that your transfers and trades are at your own risk, and any losses you may incur are your responsibility. The Daily Hodl does not recommend the buying or selling of any cryptocurrencies or digital assets, nor is The Daily Hodl an investment advisor. Please note that The Daily Hodl participates in affiliate marketing.
Generated Image: Midjourney
Source link
Genius Group buys $5m more in Bitcoin, totaling treasury to $35m
Why This AI Agent Crypto AIXBT is Up 55% Today?
Have Bitcoin ETFs Lived Up to the Hype?
Apostas basquete Brasil
SAFE rallies 20% on Bithumb listing
Solana, XRP, Litecoin, HBAR in 2025 With New SEC Chair?
Bitcoin Supercycle Incoming Amid Changing Market Conditions, According to Alex Krüger – But There’s a Catch
K-pop giant Cube Entertainment’s CEO under fire for misleading crypto investment guarantees
How a Crypto Trader Turned a 90% Loss Into a $2.5M Win?
Solana whales rapidly accumulate this viral altcoin dubbed the ‘next XRP’
Polymarket’s Customer Data Sought by U.S. CFTC Subpoena of Coinbase, Source Says
BTC, ETH, XRP & Top Altcoins Bleed Ahead Of Key Jobs Data
Vitalik Buterin warns of AI risks while highlighting new opportunities
Senate Banking Committee Advances Plans for Crypto Subcommittee Vote
Bitcoin Not Reached ‘Extreme Euphoria’ Phase Yet, Glassnode Reveals

Ethereum’s lowered yield might signal a paradigmatic shift in the ecosystem

Telegram users can send gifts to friends, TON fails to pump

Bitcoin Could Rally to $80,000 on the Eve of US Elections

Institutional Investors Go All In on Crypto as 57% Plan to Boost Allocations as Bull Run Heats Up, Sygnum Survey Reveals

Arthur Hayes, Murad’s Prediction For Meme Coins, AI & DeFi Coins For 2025

Crypto’s Big Trump Gamble Is Risky

A Kamala Presidency Could Be Just as Bullish for Bitcoin

Ripple-SEC Case Ends, But These 3 Rivals Could Jump 500x

SEC filing underway, Bitcoin rewards app Fold adopts FLD ticker

Cardano and the XRP price action lock in bulls vs bears battle as RCO Finance prepares for 3,000% surge

A16z-backed Espresso announces mainnet launch of core product

Tether CEO Paolo Ardoino Denies Rumors That Stablecoin Issuer Is Under Federal Investigation

Crypto Exchange OKX Moves To Support USDC Ecosystem by Adding Six New Trading Pairs

Trump’s Coin Is About As Revolutionary As OneCoin

Ripple Vs. SEC, Shiba Inu, US Elections Steal Spotlight
 DeFi3 months ago
Ethereum’s lowered yield might signal a paradigmatic shift in the ecosystem
 News3 months ago
Telegram users can send gifts to friends, TON fails to pump
 Bitcoin2 months ago
Bitcoin Could Rally to $80,000 on the Eve of US Elections
 Bitcoin2 months ago
Institutional Investors Go All In on Crypto as 57% Plan to Boost Allocations as Bull Run Heats Up, Sygnum Survey Reveals
 24/7 Cryptocurrency News2 months ago
Arthur Hayes, Murad’s Prediction For Meme Coins, AI & DeFi Coins For 2025
 Opinion2 months ago
Crypto’s Big Trump Gamble Is Risky
 Opinion3 months ago
A Kamala Presidency Could Be Just as Bullish for Bitcoin
 Price analysis2 months ago
Ripple-SEC Case Ends, But These 3 Rivals Could Jump 500x

✓ Share: