
Ethereum price
Solana Price Likely to Crash 20% as Ethereum Stabilizes Above Key Support

Solana price has retraced 14% from the recent peak of $295, to hit $255 on Saturday. Key market indicators suggest SOL could witness further downsizing as Ethereum’s makes a gradual resurgence after Vitalik Buterin announced the team’s intent to stop selling ETH.
With SOL recently struggling to hold momentum as selling pressure builds, Ethereum (ETH) stabilizes above the $3,100-$3,300 support zone. This contrasting price action highlights the growing divergence between the two major Layer-1 competitors, as Ethereum’s looks poised to regain market dominance.
Solana Price Weakens as Ethereum Stabilizes
Solana (SOL) continues to show bearish price action as Ethereum’s (ETH) stability amid volatile market trends suggests traders are selectively navigating the markets.
Analyzing the Ethereum price forecast chart , ETH price is consolidating above a key support zone between $3,050 and $3,208.
This support is reinforced by the 200-day Moving Average (MA), a critical technical indicator for gauging long-term trends.

According to the TradingView chart above, ETH’s Relative Strength Index (RSI) hovers near 47.57, signaling neutral momentum and potential for accumulation. Meanwhile, the MACD histogram shows mild bearish divergence but suggests weakening downside pressure, as recent bars narrow toward the zero line.
These factors point to ETH price stabilizing, creating a subdued environment for correlated altcoins like Solana.
SOL, by contrast, lacks strong institutional interest evident in Ethereum’s support zones.
With ETH finding buyers near its 200-day MA and key horizontal levels, SOL’s price weakness could signal a flight to safety toward larger-cap assets. If Ethereum continues to consolidate above $3,200, it could exert indirect resistance on SOL, limiting its ability to recover in the short term. Solana bulls must reclaim lost support zones to shift sentiment to the next bullish phase.
Solana Price Forecast: SOL To Crash 20% As Selling Pressure Builds
Looking at the near-term Solana price forecast, current market dynamics indicate a bearish outlook, with a potential 20% decline as selling pressure intensifies.
As seen in the chart below, SOL price has recently breached key support levels, including the 50-day Simple Moving Average (SMA) at $232.51 and the 200-day SMA at $168.88, signaling weakening demand.
The Swing Failure Pattern (SFP) due to excessive selling further confirms the bearish sentiment, as buyers failed to sustain upward momentum, leading to a breakdown.

The price is currently testing the range midpoint at $232.51, which now acts as resistance.
The Relative Strength Index (RSI) and other momentum indicators are likely in oversold territory, but without significant buying interest, a rebound seems unlikely. The demand zone around $168.88, aligned with the 200-day SMA, is the next critical support level. If this level fails to hold, SOL price could rapidly plunge toward $169.00, aligning with the 20% crash forecast.
Frequently Asked Questions (FAQs)
Solana’s price is declining due to excessive selling pressure, breaching key support levels like the 50-day and 200-day SMAs, and a Swing Failure Pattern indicating weakened buyer momentum.
Ethereum’s stability above key support zones contrasts with Solana’s weakness, suggesting a potential shift in trader preference towards larger-cap assets like ETH, which could further pressure SOL
Key support levels for Solana include the 50-day SMA at $232 and the 200-day SMA at $168. A break below these levels could lead to further downside.
ibrahim
Disclaimer: The presented content may include the personal opinion of the author and is subject to market condition. Do your market research before investing in cryptocurrencies. The author or the publication does not hold any responsibility for your personal financial loss.
Source link


Reason to trust
![]()
Strict editorial policy that focuses on accuracy, relevance, and impartiality
Created by industry experts and meticulously reviewed
The highest standards in reporting and publishing
Strict editorial policy that focuses on accuracy, relevance, and impartiality
Morbi pretium leo et nisl aliquam mollis. Quisque arcu lorem, ultricies quis pellentesque nec, ullamcorper eu odio.
The Ethereum price action is raising red flags among analysts, with technical indicators pointing toward a potential crash to the $2,000 level. Despite experiencing a significant uptick recently following Bitcoin’s price surge, concerns continue to grow that a deeper correction may be unfolding.
Ethereum Price Crash To $2,000 Imminent
Based on a new report by Master Ananda, a TradingView crypto analyst, the Ethereum market is flashing warning signs as its price struggles below the critical resistance zone. At press time, Ethereum is trading at approximately $2,605 after being rejected from a local high of around $2,788.
Related Reading
Ethereum’s 4-hour chart presented by Master Ananda shows that the top altcoin has likely completed a short-term top, and now a corrective move is in play. The analysis hints at a looming price crash, with technical forecasts suggesting a retracement toward the $2,000 level or lower before the next bullish impulse.
The analyst’s bearish continuation thesis appears to be a high-probability setup, with Ethereum expected to revisit lower Fibonacci retracement levels. Notably, the chart reveals a subtle bearish divergence forming as the price pushed slightly higher in May but with diminishing momentum. This, in turn, created a rising resistance line while volume and price action failed to confirm new highs.
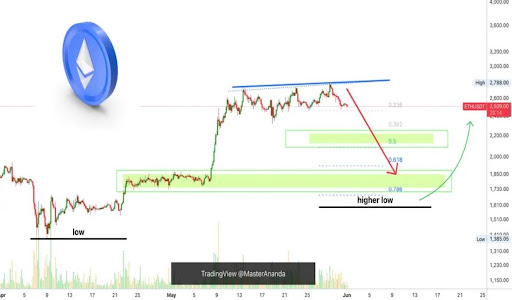
Noticeably, Ethereum’s price has since broken below the 0.230 Fibonacci level, signaling the possible start of a broader correction phase. The next probable support areas lie at $2,280 (0.382 Fib), $2,085 (0.5 Fib), and most significantly, the $1,900 price point at the 0.618 Fib Retracement level.
The highlighted green zones in Master Ananda’s chart represent potential support and buying areas, which point to the $1,900 to $1,735 (0.618-0.786 Fib) range as the most likely zone for a higher low to form. The previous major low occurred on April 7, and the expectation is that this correction will end above that level. Until then, a short-term correction remains the most likely scenario, and traders are warned to take caution as the chart further highlights a possibly more resounding crash to $1,385.
ETH Trade Strategy: Buy The Dip And Go Long
While sharing his bearish thesis for Ethereum, Master Ananda also provided a clear strategy for investors and traders. He advised long-term holders to wait patiently for the projected drop and assess the support reaction before looking for clear reversal signals.
Related Reading
Buying into support zones like $1,900 or even as low as $1,736 could provide optimal entry points for long-term positions. While bears may still attempt to short the market, Master Ananda assures that the downside remains limited.
The analyst emphasizes the importance of planning and avoiding impulsive trading by creating ideal entry and exit points while respecting the prevailing market trend. With Ethereum’s bullish outlook still intact, this projected price crash could become an opportunity for many traders instead of a threat.
Featured image from Getty Images, chart from Tradingview.com
Source link

Reason to trust
![]()
Strict editorial policy that focuses on accuracy, relevance, and impartiality
Created by industry experts and meticulously reviewed
The highest standards in reporting and publishing
Strict editorial policy that focuses on accuracy, relevance, and impartiality
Morbi pretium leo et nisl aliquam mollis. Quisque arcu lorem, ultricies quis pellentesque nec, ullamcorper eu odio.
Ethereum is experiencing increased volatility as it consolidates just below the key $2,700 resistance level. Despite several attempts to break above it in recent weeks, ETH has yet to secure a daily close above this threshold, making it a crucial battleground for bulls and bears alike. The broader market remains uncertain, but Ethereum’s fundamentals continue to show strength beneath the surface.
Related Reading
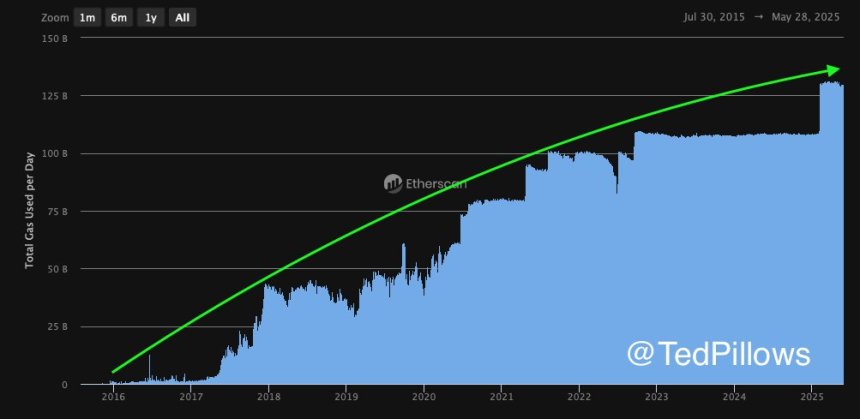
Top analyst Ted Pillows shared compelling insights on X, highlighting that Ethereum’s daily gas usage has been climbing steadily since 2016. This long-term rise suggests that Ethereum’s network activity is not just driven by short-term speculation or hype, but by real and growing demand. It’s a sign that users, developers, and applications are increasingly relying on ETH as the backbone of Web3 infrastructure.
Ethereum’s ability to maintain this level of on-chain usage through bear and bull markets reinforces its role as the foundation of decentralized finance, NFTs, and smart contracts. While short-term price action remains capped below $2,700, the underlying demand tells a bullish story. If ETH can break above this level with conviction, it may signal the beginning of a broader move to retest higher resistance levels.
Ethereum Fundamentals Are Strong As It Prepares For A Move
Ethereum is facing a critical test as it consolidates below major resistance, struggling to reclaim key levels above the $2,700 mark. Bulls have maintained strong support over the past few sessions, but momentum has yet to trigger a breakout. As global tensions remain high and US Treasury yields continue to rise, risk assets—including cryptocurrencies—are under pressure. However, Ethereum appears poised for an expansive move, with technical and on-chain data supporting a potential breakout.
Pillows highlighted that Ethereum’s daily gas usage has continued to climb steadily since 2016, reinforcing the view that ETH demand is structural and not just a product of market hype. This metric serves as a proxy for real activity on the Ethereum network, suggesting that despite short-term price hurdles, usage and value creation persist. Pillows believes this persistent demand positions ETH for a strong recovery once key technical levels are breached.
Sentiment across the broader crypto space is gradually shifting bullish, especially with Bitcoin hovering near its all-time high. If Ethereum can reclaim and close above the $2,700–$2,800 resistance zone, it could open the door for a sharp rally toward $3,000 and beyond.
Related Reading
ETH Consolidates Below Key Resistance
Ethereum is currently trading at $2,617, consolidating just below the critical $2,700–$2,800 resistance zone. This area has acted as a major barrier since early February, and despite several breakout attempts, ETH has failed to close above it with strong conviction. The chart shows a clear bullish structure, with the price holding above key moving averages: the 34 EMA at $2,366, and the 50, 100, and 200 SMAs all trending upward and providing layered support between $2,070 and $2,690.

The recent consolidation comes after a strong rally in May that pushed ETH above its 200-day SMA for the first time in months, signaling a major shift in momentum. However, volume has started to taper off slightly, which could indicate hesitation from bulls at current levels. A decisive daily close above $2,800 would likely confirm the breakout and open the door for a move toward the $3,000–$3,200 range.
Related Reading
Until then, the price remains range-bound, with $2,550 acting as near-term support. If ETH can maintain this level and continue forming higher lows, the bullish thesis remains intact. All eyes are now on whether Ethereum can break through the ceiling that has capped it for weeks, and potentially kickstart a broader altcoin rally.
Featured image from Dall-E, chart from TradingView
Source link
Cryptocurrency Market News
Ethereum Price Struggles To Hold Above $2,500 — Watch Out For This Support Level

Reason to trust
![]()
Strict editorial policy that focuses on accuracy, relevance, and impartiality
Created by industry experts and meticulously reviewed
The highest standards in reporting and publishing
Strict editorial policy that focuses on accuracy, relevance, and impartiality
Morbi pretium leo et nisl aliquam mollis. Quisque arcu lorem, ultricies quis pellentesque nec, ullamcorper eu odio.
The Ethereum price performance in the month of May has been nothing short of outstanding, surging by more than 35% in the past two weeks. After making a strong run toward the $2,700 mark on Tuesday, May 13, the altcoin’s price has struggled to build on its momentum over the past few days.
The price of ETH did manage to stay above the $2,500 mark over the past week, bouncing back from the psychological level on Thursday, May 15. However, the recent struggles seem to have compounded over the weekend, with the Ethereum price losing the $2,500 level to end the week.
The Next Support Cushion For ETH Price
Prominent crypto analyst Ali Martinez took to the social media platform X to share an interesting on-chain outlook on the price of Ethereum and its latest lack of bullish momentum. Following the dip of ETH beneath the $2,500 mark, the online pundit has identified the altcoin’s next significant support level.
Related Reading
This evaluation revolves around the average cost basis of several Ethereum investors. Cost-basis analysis basically measures the ability of a price level to act as support or resistance — based on the total amount of coins last purchased by investors at this level.

As shown in the chart above, the size of the circles directly corresponds with the quantity of ETH tokens bought within each price zone and the region’s significance as support or resistance.
In essence, the bigger the dot, the higher the number of tokens, and the stronger the support or resistance; the green dots are support (as they are usually below the current price), while the red dots represent resistance (as they are above the asset price).
Data provided by Sentora (formerly IntoTheBlock) shows that the Ethereum price has key support around the $2,354 – $2,430 zone, where 2.64 million addresses purchased 63.9 million tokens (worth $153.04 billion at an average price of $2,395).
As Martinez highlighted, this price bracket would serve as an on-chain cushion for the ETH price, as investors with their cost bases around the level would likely defend their positions by buying more tokens if the price falls toward $2,400. The fresh buying pressure around this price region would help counter the downward pressure, thereby keeping the Ethereum price afloat.
The highlighted chart shows that it is all clear blue skies for the price of Ethereum, with no significant resistance lying ahead. However, the altcoin will need to hold above the $2,400 level, or it risks falling to as low as $2,200.
Ethereum Price At A Glance
As of this writing, the price of ETH stands at around $2,480, reflecting a 0.7% increase in the past 24 hours. According to data from CoinGecko, the altcoin is down by nearly 4% on the weekly timeframe.
Related Reading
Featured image from iStock, chart from TradingView
Source link
Ethereum Price Headed For Crash To $2,000 With Current Price Action
Tokenized funds hit $5.7B, scaling fast — Moody’s
Authorities Warn of Phony Text Messages Phishing for Sensitive Information, Telling Victims Their Bank Account Is at Risk
Tether invests in Chilean crypto exchange Orionx

MARA Hits Record-High Bitcoin Production in May
Retail investors no longer FOMO into BTC, altcoins
AVAX Rises 3.8% on Strong Volume, Breaking Key Resistance Levels

K33 begins Bitcoin buying with 10 BTC purchase for treasury strategy
Why $107,500 And $103,500 Are The Levels To Watch
Pakistan Proposes New Crypto Regulations
Japanese Bitcoin Hoarder Metplanet Adds $115,600,000 Worth of BTC As Stock Surpasses 263% Gains on the Year
Bitcoin traders anticipate decline, watch $100K
Ethereum Foundation Restructures R&D Division, Plans ‘Rethink’ on Design and Development
Here’s why Sophon crypto rallied over 40% today
BCB Strikes Deal with SocGen–FORGE to Distribute Euro-Pegged Stablecoin EURCV


 24/7 Cryptocurrency News7 months ago
Arthur Hayes, Murad’s Prediction For Meme Coins, AI & DeFi Coins For 2025

 Markets3 months ago
Pi Network coin to $10? 4 catalysts that may make it possible

 Ripple Price3 months ago
3 Voting Polls Show Why Ripple’s XRP Price Could Hit $10 Soon

 Bitcoin5 months ago
Expert Sees Bitcoin Dipping To $50K While Bullish Signs Persist

 24/7 Cryptocurrency News5 months ago
Aptos Leverages Chainlink To Enhance Scalability and Data Access

 Bitcoin7 months ago
Bitcoin Could Rally to $80,000 on the Eve of US Elections

 Opinion7 months ago
Crypto’s Big Trump Gamble Is Risky

 Bitcoin4 months ago
The Future of Bitcoin: Scaling, Institutional Adoption, and Strategic Reserves with Rich Rines

✓ Share: