
SOL
‘Solana Season Is About To Return’ As Price Turns Key Resistance Into Support – Analyst

Solana has captured the spotlight this week with its volatile price action, demonstrating resilience amidst market uncertainty. After dropping to a low of $168, SOL surged over 22% to reach $207, signaling renewed strength and bullish momentum. This impressive recovery has reignited optimism among investors and analysts alike, many of whom now anticipate a swift recovery and a potential bullish rally.
Related Reading
Top analyst Jelle has shared a compelling technical analysis, highlighting that the “Solana season” may be on the verge of a major comeback. According to Jelle, Solana’s recent price movements indicate a significant shift in market structure. The downtrend appears to have flipped, with key resistance levels now acting as support. This critical development could pave the way for further upside in the coming days.
As Solana continues to lead the charge among altcoins, its ability to maintain and build upon this momentum will be closely watched. With analysts predicting a strong recovery and investors eyeing new opportunities, all eyes are on SOL to see if it can sustain this bullish trajectory and reclaim its status as a top-performing asset in the market.
Bullish Breakout And Sentiment Shifts
Solana has shown remarkable strength in recent days, pushing above critical supply levels after enduring weeks of selling pressure. While the broader market remains volatile, Solana has managed to inspire confidence among investors and analysts, thanks to its steady climb. However, the asset still faces a significant challenge: reclaiming the local high around $220. Achieving this milestone could set the stage for a bullish rally into uncharted price territory.
Top analyst Jelle recently shared an optimistic technical analysis on X, emphasizing the dramatic shift in Solana’s market structure. According to Jelle, the downtrend that defined Solana’s recent performance has officially flipped, with key resistance levels now acting as solid support. This critical development is a bullish signal for Solana’s prospects, reinforcing the idea that the asset is nearing the end of its consolidation phase.

Jelle highlighted that one final hurdle remains before Solana can enter price discovery: breaking decisively above the $220 mark. If bulls can overcome this obstacle, the potential for a massive rally becomes highly likely. The sentiment surrounding Solana is increasingly positive, with many investors echoing Jelle’s sentiment that “Solana season” is on the horizon.
Related Reading
As Solana positions itself for a breakout, market participants are closely watching its ability to sustain momentum. If Solana successfully reclaims $220 and establishes it as support, a surge into new all-time highs could follow. With sentiment turning bullish and technical indicators aligning, Solana is gearing up to regain its status as one of the most exciting assets in the cryptocurrency space.
Bulls Eye $222 As Momentum Builds
Solana is trading at $209 following a bullish performance on Wednesday, signaling renewed confidence in the market. The cryptocurrency has demonstrated impressive resilience, steadily climbing after recent lows and holding key levels of support. With bullish momentum picking up, Solana is positioned to challenge higher resistance levels in the coming days.
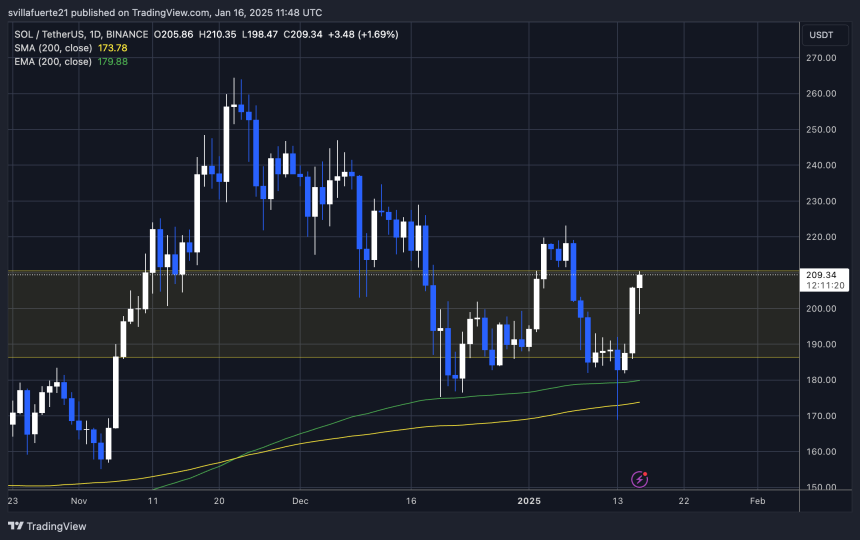
The immediate target for bulls is reclaiming the $222 mark, a significant level that could determine the trajectory of Solana’s next move. Successfully breaking above this price and converting it into support would confirm the continuation of the bullish trend. This would also set the stage for Solana to target its all-time high (ATH), a psychological milestone for both traders and long-term investors.
Related Reading
Analysts suggest that once Solana crosses the $222 level, the surge to ATH could happen rapidly. Market sentiment remains optimistic, with many participants expecting Solana to lead a new wave of upward momentum in the altcoin space. If the price continues to hold key support levels and bulls maintain control, Solana is poised to regain its status as one of the market’s top-performing assets. For now, all eyes are on $222 as the next critical step in Solana’s bullish journey.
Featured image from Dall-E, chart from TradingView
Source link


Reason to trust
![]()
Strict editorial policy that focuses on accuracy, relevance, and impartiality
Created by industry experts and meticulously reviewed
The highest standards in reporting and publishing
Strict editorial policy that focuses on accuracy, relevance, and impartiality
Morbi pretium leo et nisl aliquam mollis. Quisque arcu lorem, ultricies quis pellentesque nec, ullamcorper eu odio.
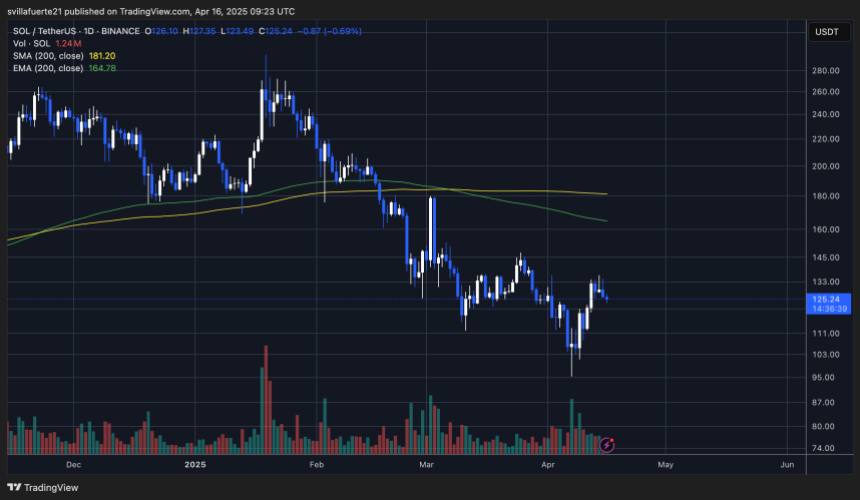
Solana is trading above the $125 level after bulls stepped in and reclaimed key levels, sparking optimism across the market. After enduring weeks of massive selling pressure, this recovery marks the first sign of strength from buyers since early March. Still, not all analysts are convinced this marks the beginning of a sustainable rally. While momentum appears to be shifting in Solana’s favor, some see this move as a possible bearish setup rather than a reversal.
Related Reading
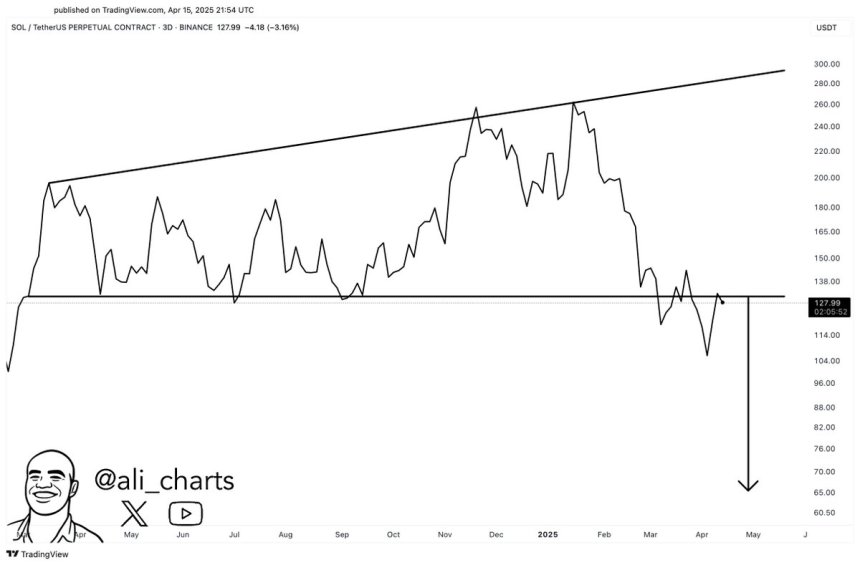
Top crypto analyst Ali Martinez shared a cautionary view on X, suggesting that Solana might be retesting the breakout zone from a right-angled ascending broadening pattern — a structure that often precedes sharp declines. According to his analysis, if Solana fails to hold current support levels, prices below $80 could come back into play. This aligns with broader macro concerns, as global trade tensions and volatile risk markets continue to pressure crypto valuations.
With both bullish enthusiasm and bearish warnings in the air, Solana’s price action in the coming days could determine whether this is a genuine recovery — or a setup for a deeper correction. Eyes are now on how SOL behaves around $125 in the short term.
Solana Faces a Pivotal Test as Global Risks Rise
Solana is at a crucial juncture as bulls attempt to hold the $125 level and regain momentum after weeks of aggressive selling pressure. While the recent bounce has offered short-term relief, the broader market environment remains highly unstable, making this recovery fragile.
Macroeconomic uncertainty, paired with growing trade war fears, continues to weigh heavily on risk assets like Solana. The erratic tone set by US President Donald Trump, including unpredictable tariff policies targeting China and other global partners, has introduced renewed volatility across financial markets.
These macro headwinds are colliding with technical pressure in Solana’s chart. Martinez shared a bearish scenario, noting that Solana could be retesting the breakout zone from a right-angled ascending broadening pattern. Historically, this pattern often signals the potential for sharp reversals. According to Martinez, if Solana fails to hold above key support, the price could plunge toward $65 — a level not seen since late 2023.
The $125 zone now acts as a make-or-break level for bulls. Reclaiming higher resistance at $135–$145 would be necessary to shift sentiment and spark a full recovery rally. However, failure to hold current levels could result in a steep decline as panic returns to the market.
Related Reading
SOL Price Faces Key Resistance After $136 Rejection
Solana (SOL) is currently trading at $125 after facing a clean rejection at the $136 resistance level earlier this week. The failure to break through this short-term ceiling has paused the bullish momentum, placing bulls in a vulnerable position as they try to defend recent gains. To regain control and signal a clear reversal, SOL must reclaim the $136 level with conviction and continue climbing toward the $150 mark — a zone that aligns with key daily resistance and short-term liquidity.
Reclaiming both levels would signal strong market confidence and could set the stage for a sustained rally, possibly retesting April highs. However, without that upside push, the risk of deeper downside grows. Market volatility remains high, fueled by global macroeconomic tensions and uncertainty around US-China trade developments. These factors are still weighing heavily on sentiment, particularly among altcoins like Solana.
Related Reading
If SOL continues to struggle below $136 and fails to attract enough buying pressure, a breakdown toward the $100 mark becomes increasingly likely. That level has previously served as a psychological support zone and could attract renewed interest — but only if broader market conditions stabilize. For now, SOL remains in a delicate, high-stakes trading zone.
Featured image from Dall-E, chart from TradingView
Source link
Altcoins
Analyst Says Solana Flashing Biggest Bear Trap, Predicts New All-Time High for SOL by End of 2025

A closely followed trader believes that the layer-1 protocol Solana (SOL) may have just flashed a strong bullish reversal signal.
Pseudonymous trader Inmortal tells his 231,500 followers on the social media platform X that Solana appears to have set a massive bear trap earlier this month when the price of SOL briefly dropped below $100.
A bear trap is a false signal that makes it appear that the price of an asset is heading to much lower levels, but instead, the price abruptly reverses and rallies, leaving short-sellers trapped.
Says Inmortal,
“That weekly candle is maybe the biggest bear trap I’ve ever seen, SOL.”
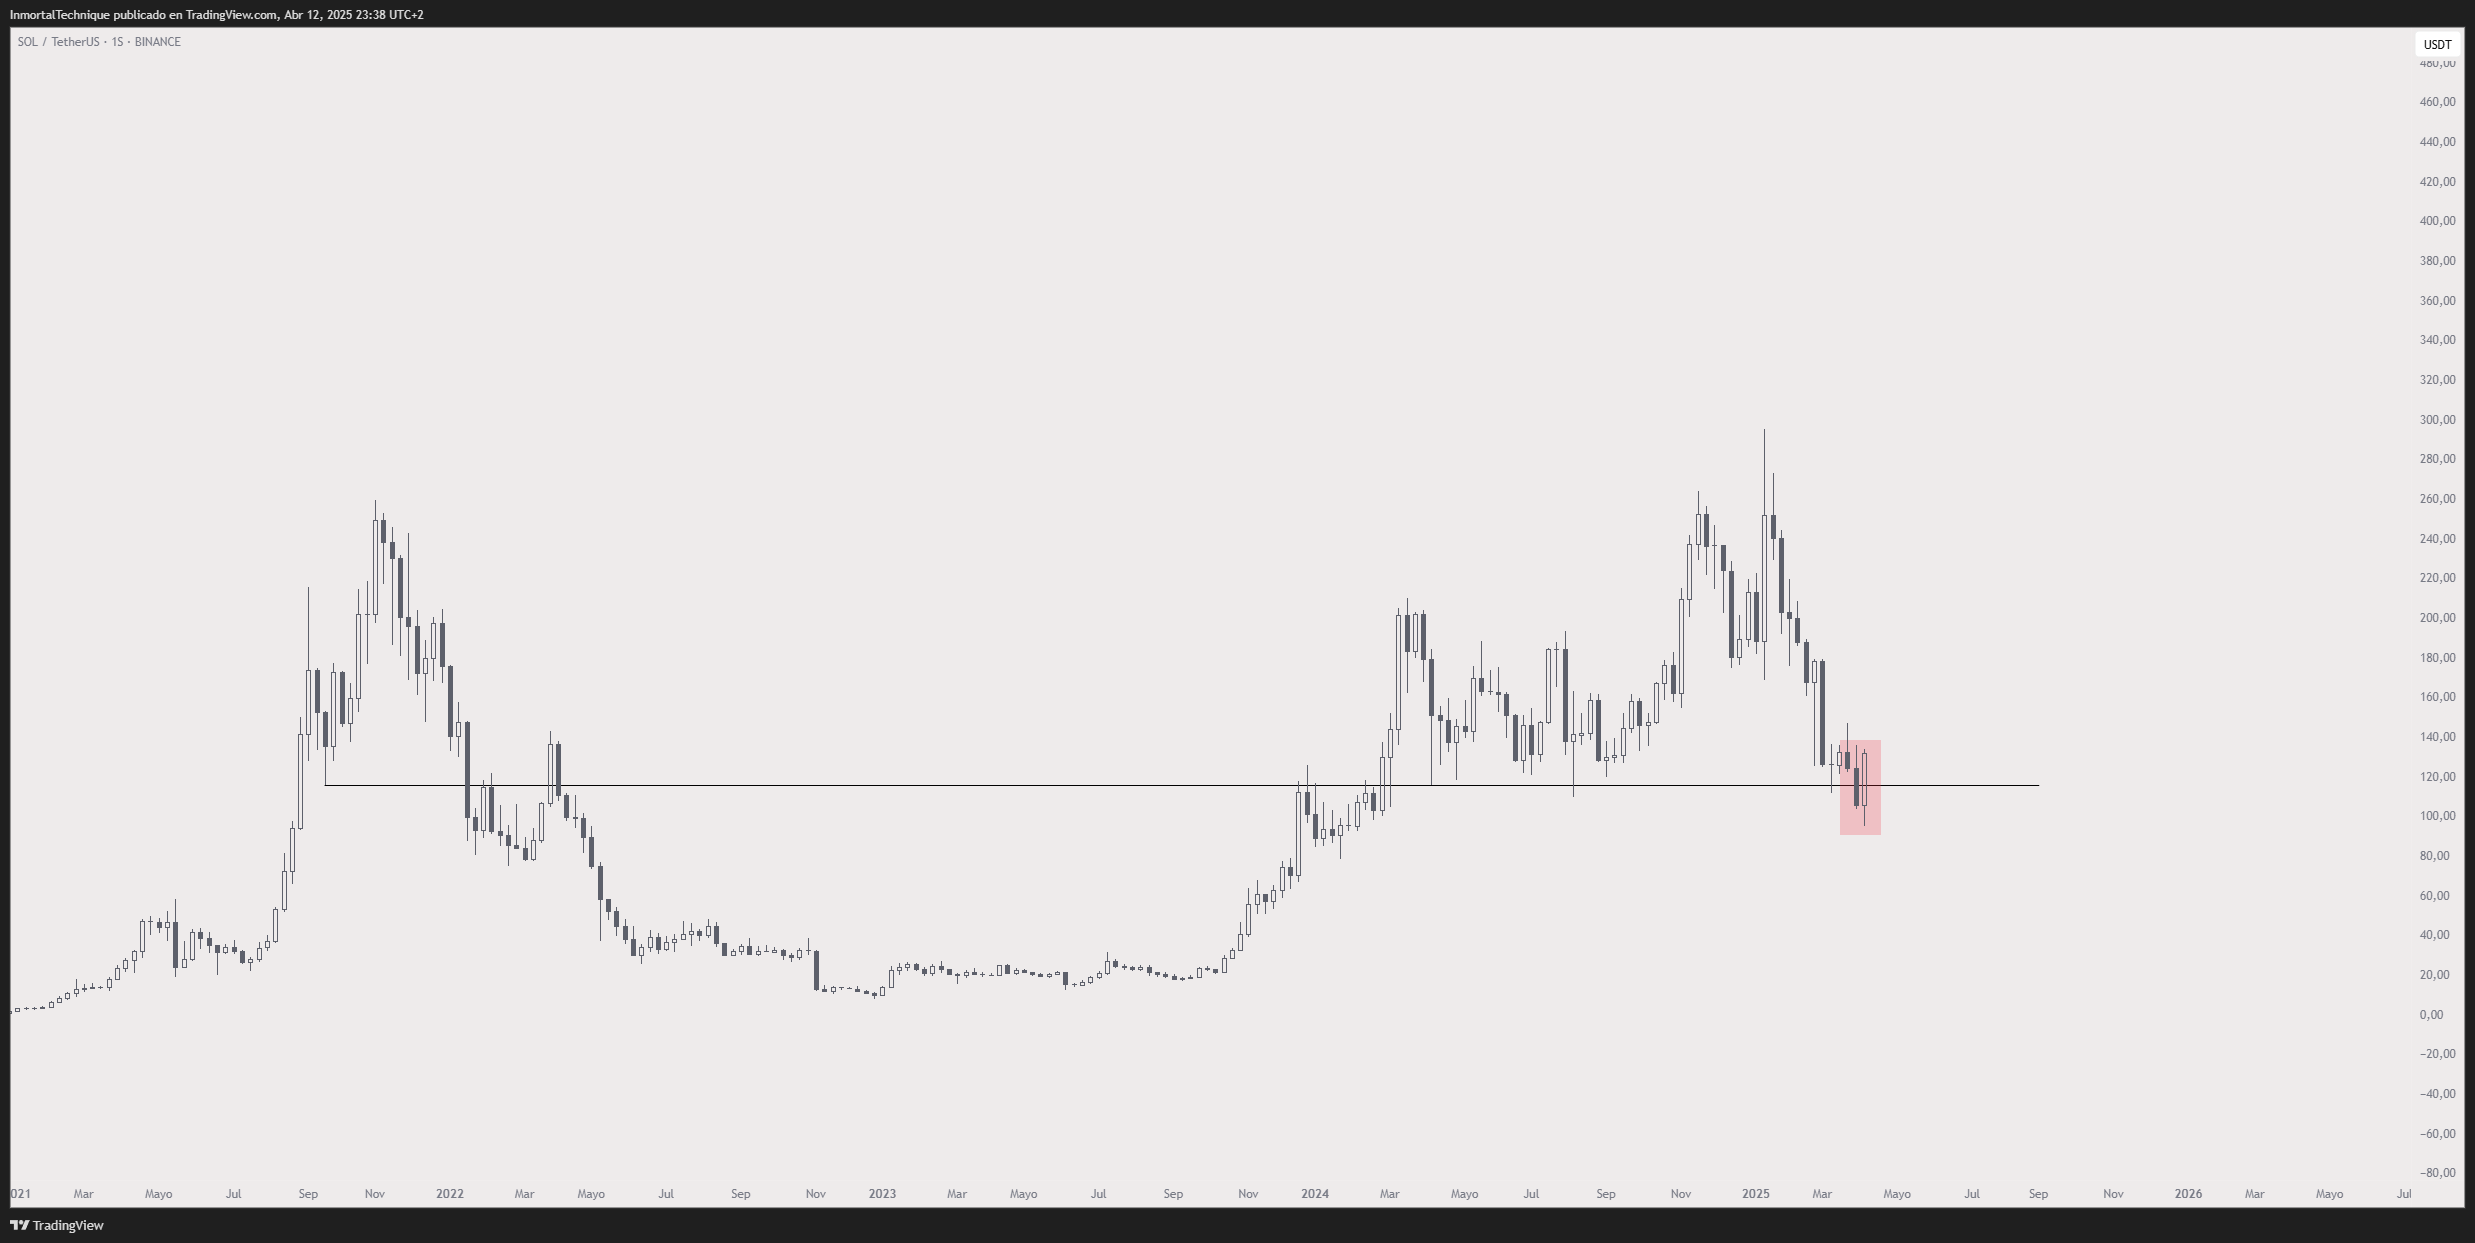
The analyst now believes that SOL is setting the stage for strong rallies en route to a new all-time high of $340 by December 2025.
“In retrospect, it will be so obvious, SOL.”
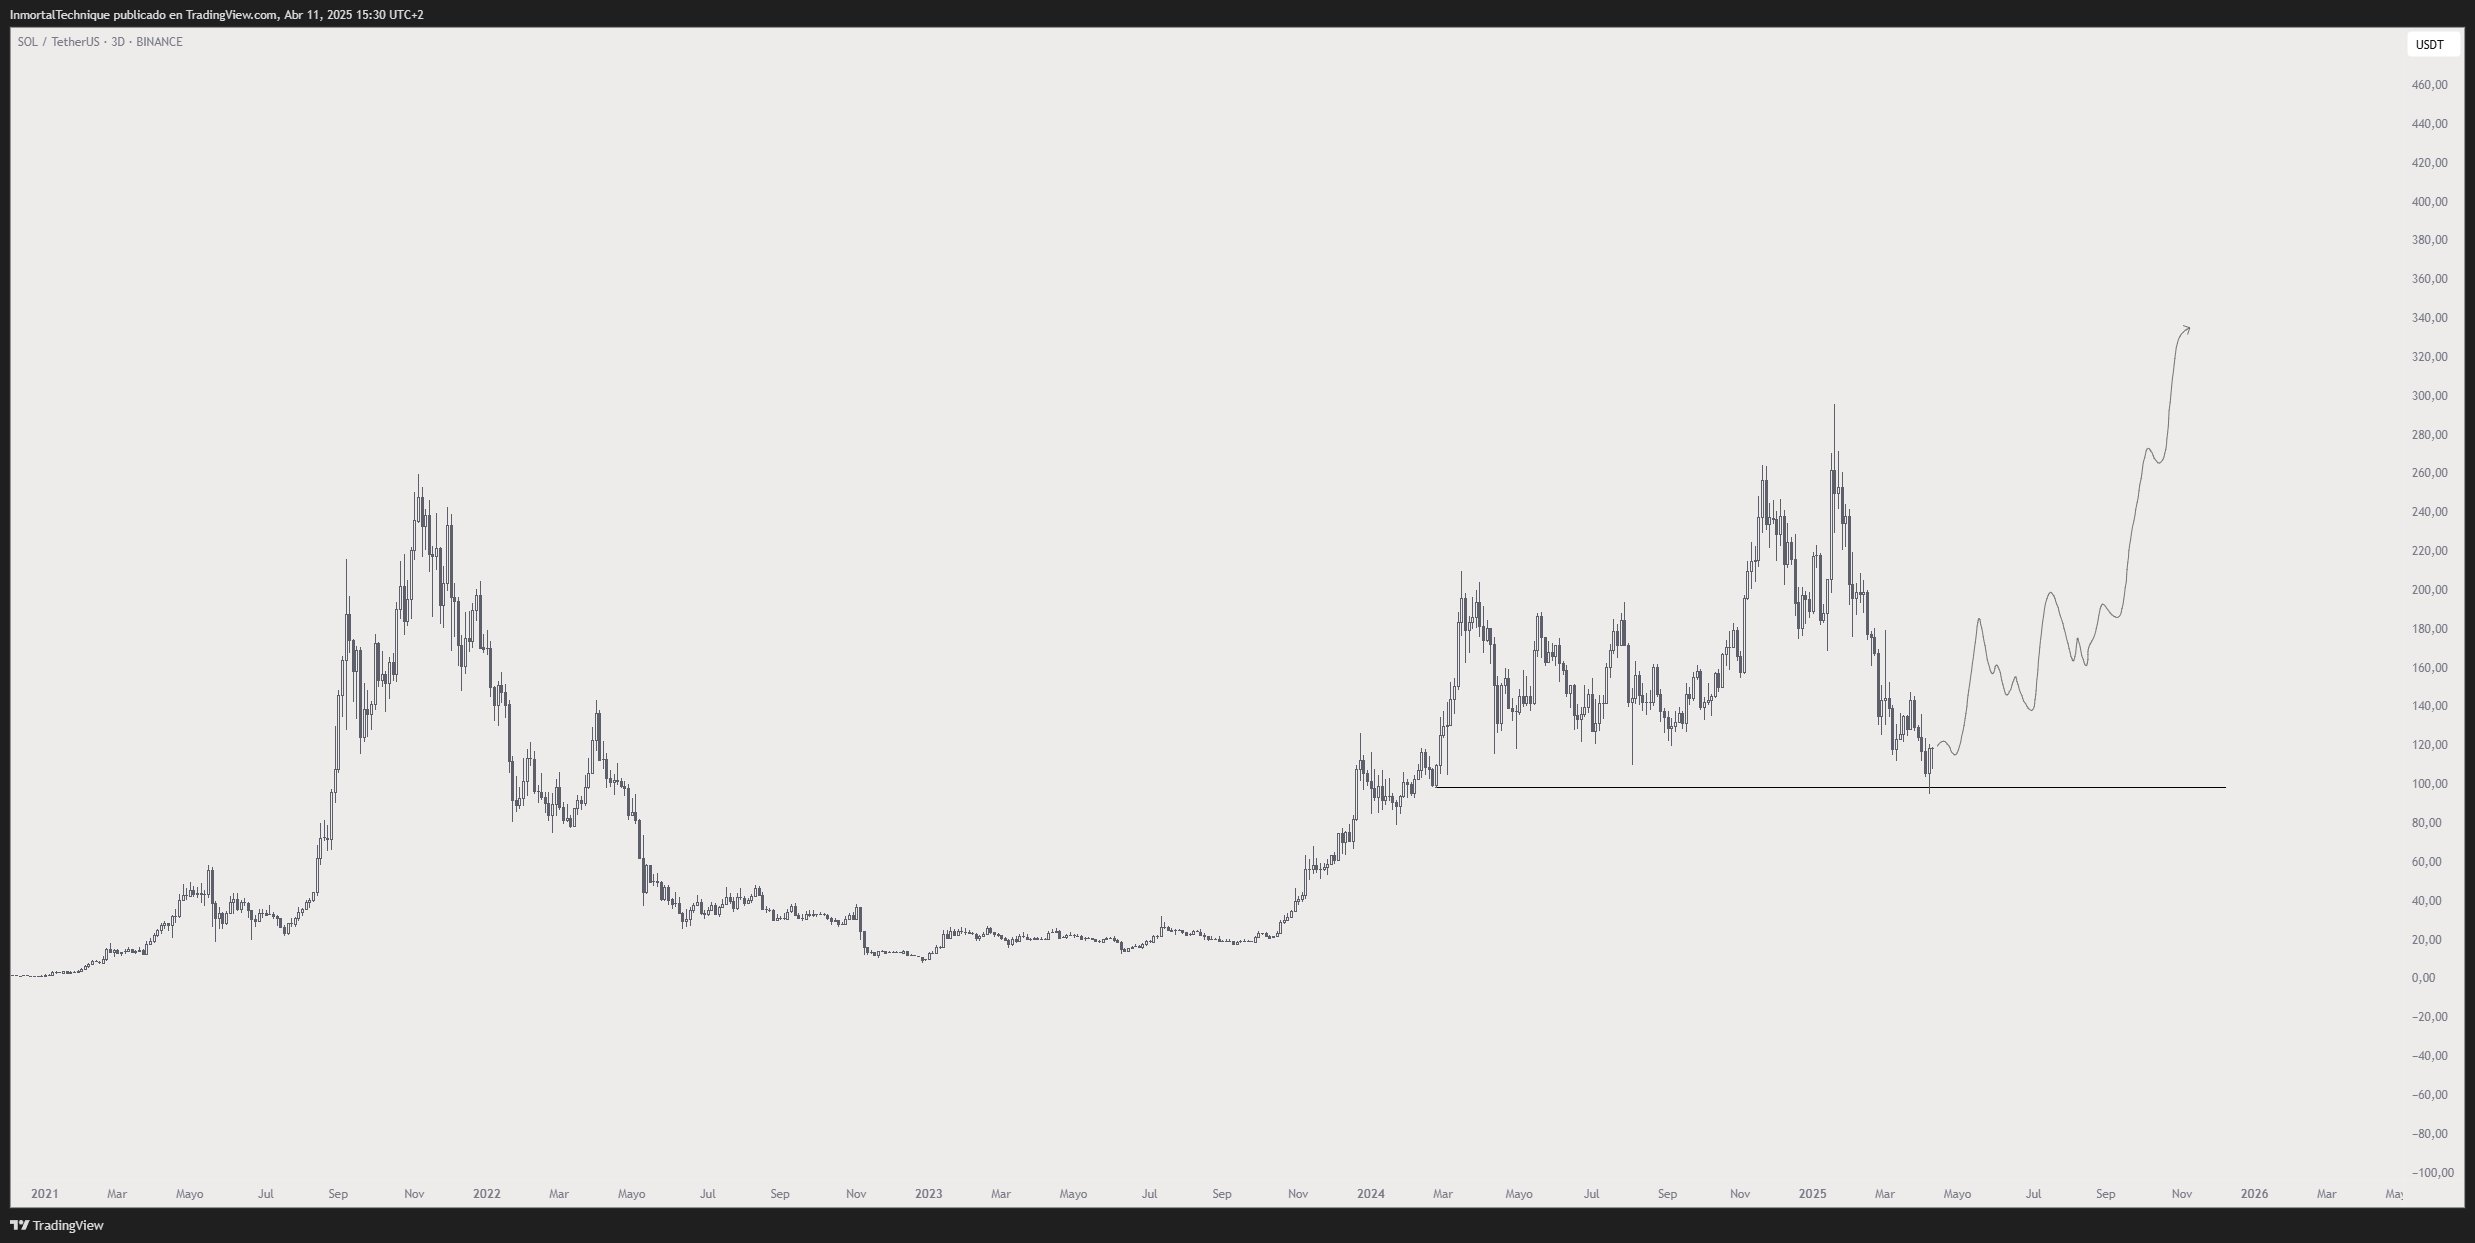
At time of writing, Solana is trading for $128.19, down over 3% on the day.
Looking at Bitcoin, Inmortal thinks that BTC will trade between $74,000 and $95,000 in the coming months before sparking a breakout rally toward the end of the year.
“Expecting something like this:
> Bounce to $90,000
> More chop/ranging ($67,000 maybe)
> Uptrend in the second half of this year
Maybe not in this exact order.
BTC.”
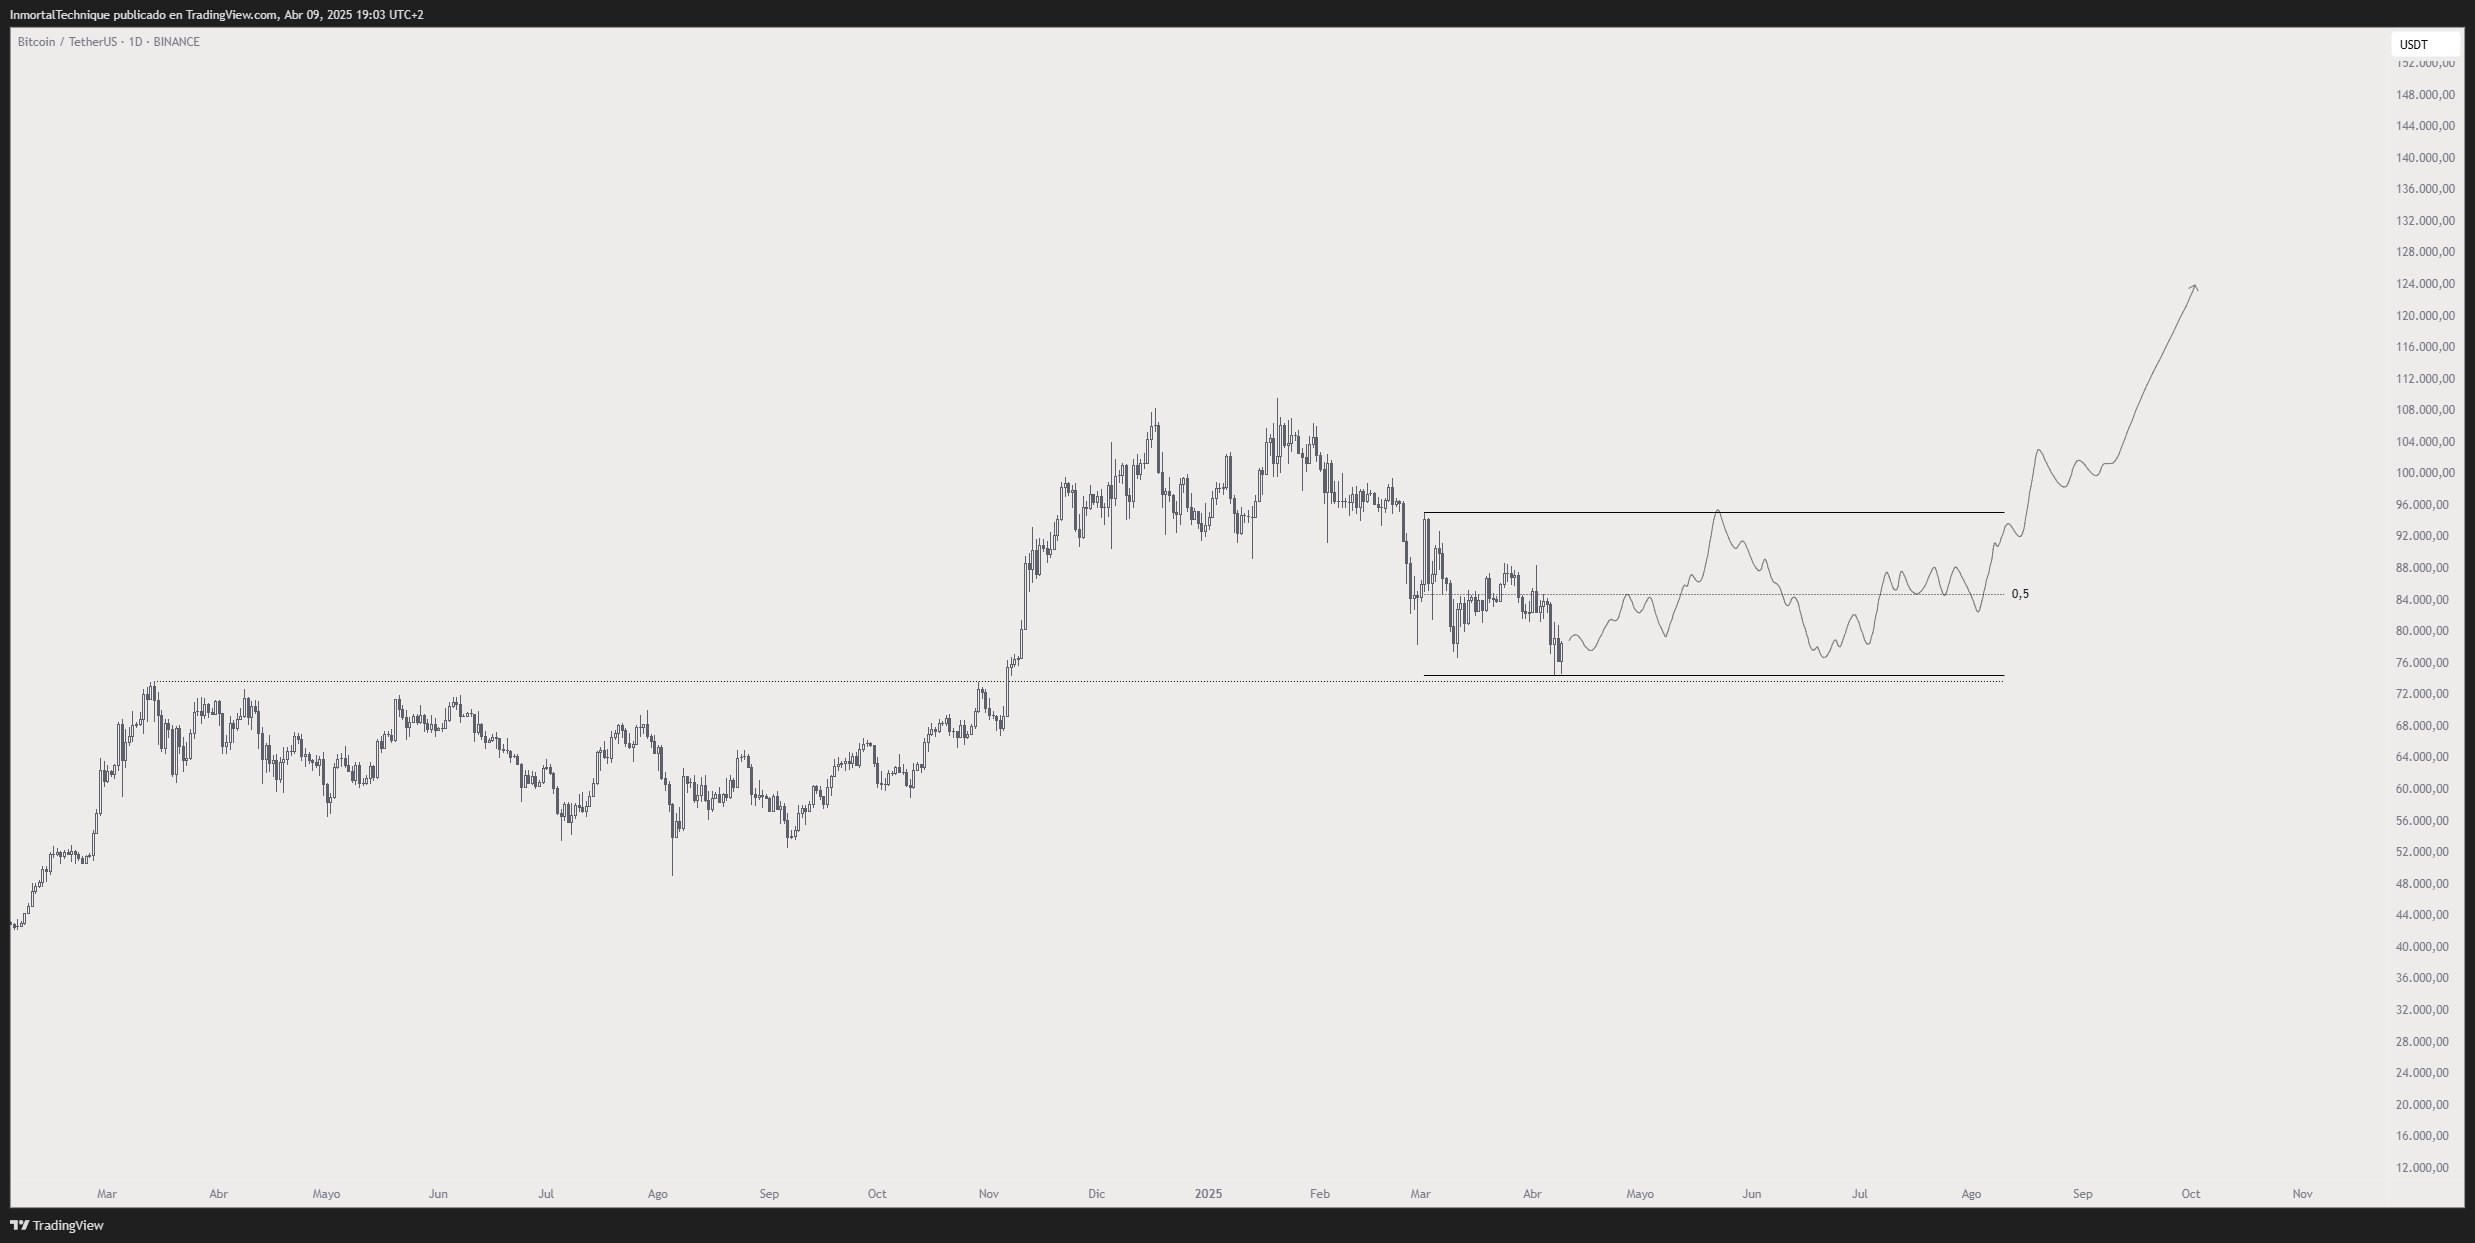
Based on the trader’s chart, he appears to suggest that Bitcoin will soar close to $130,000 by the end of 2025. At time of writing, Bitcoin is worth $84,943.
Turning to the memecoin Floki (FLOKI), Inmortal thinks the altcoin is at a price level where it can potentially carve a major cycle bottom.
“Accumulating more FLOKI at these levels.
RSI (relative strength index) is at the same levels it was 700 days ago, and price at pre-bullrun levels.”
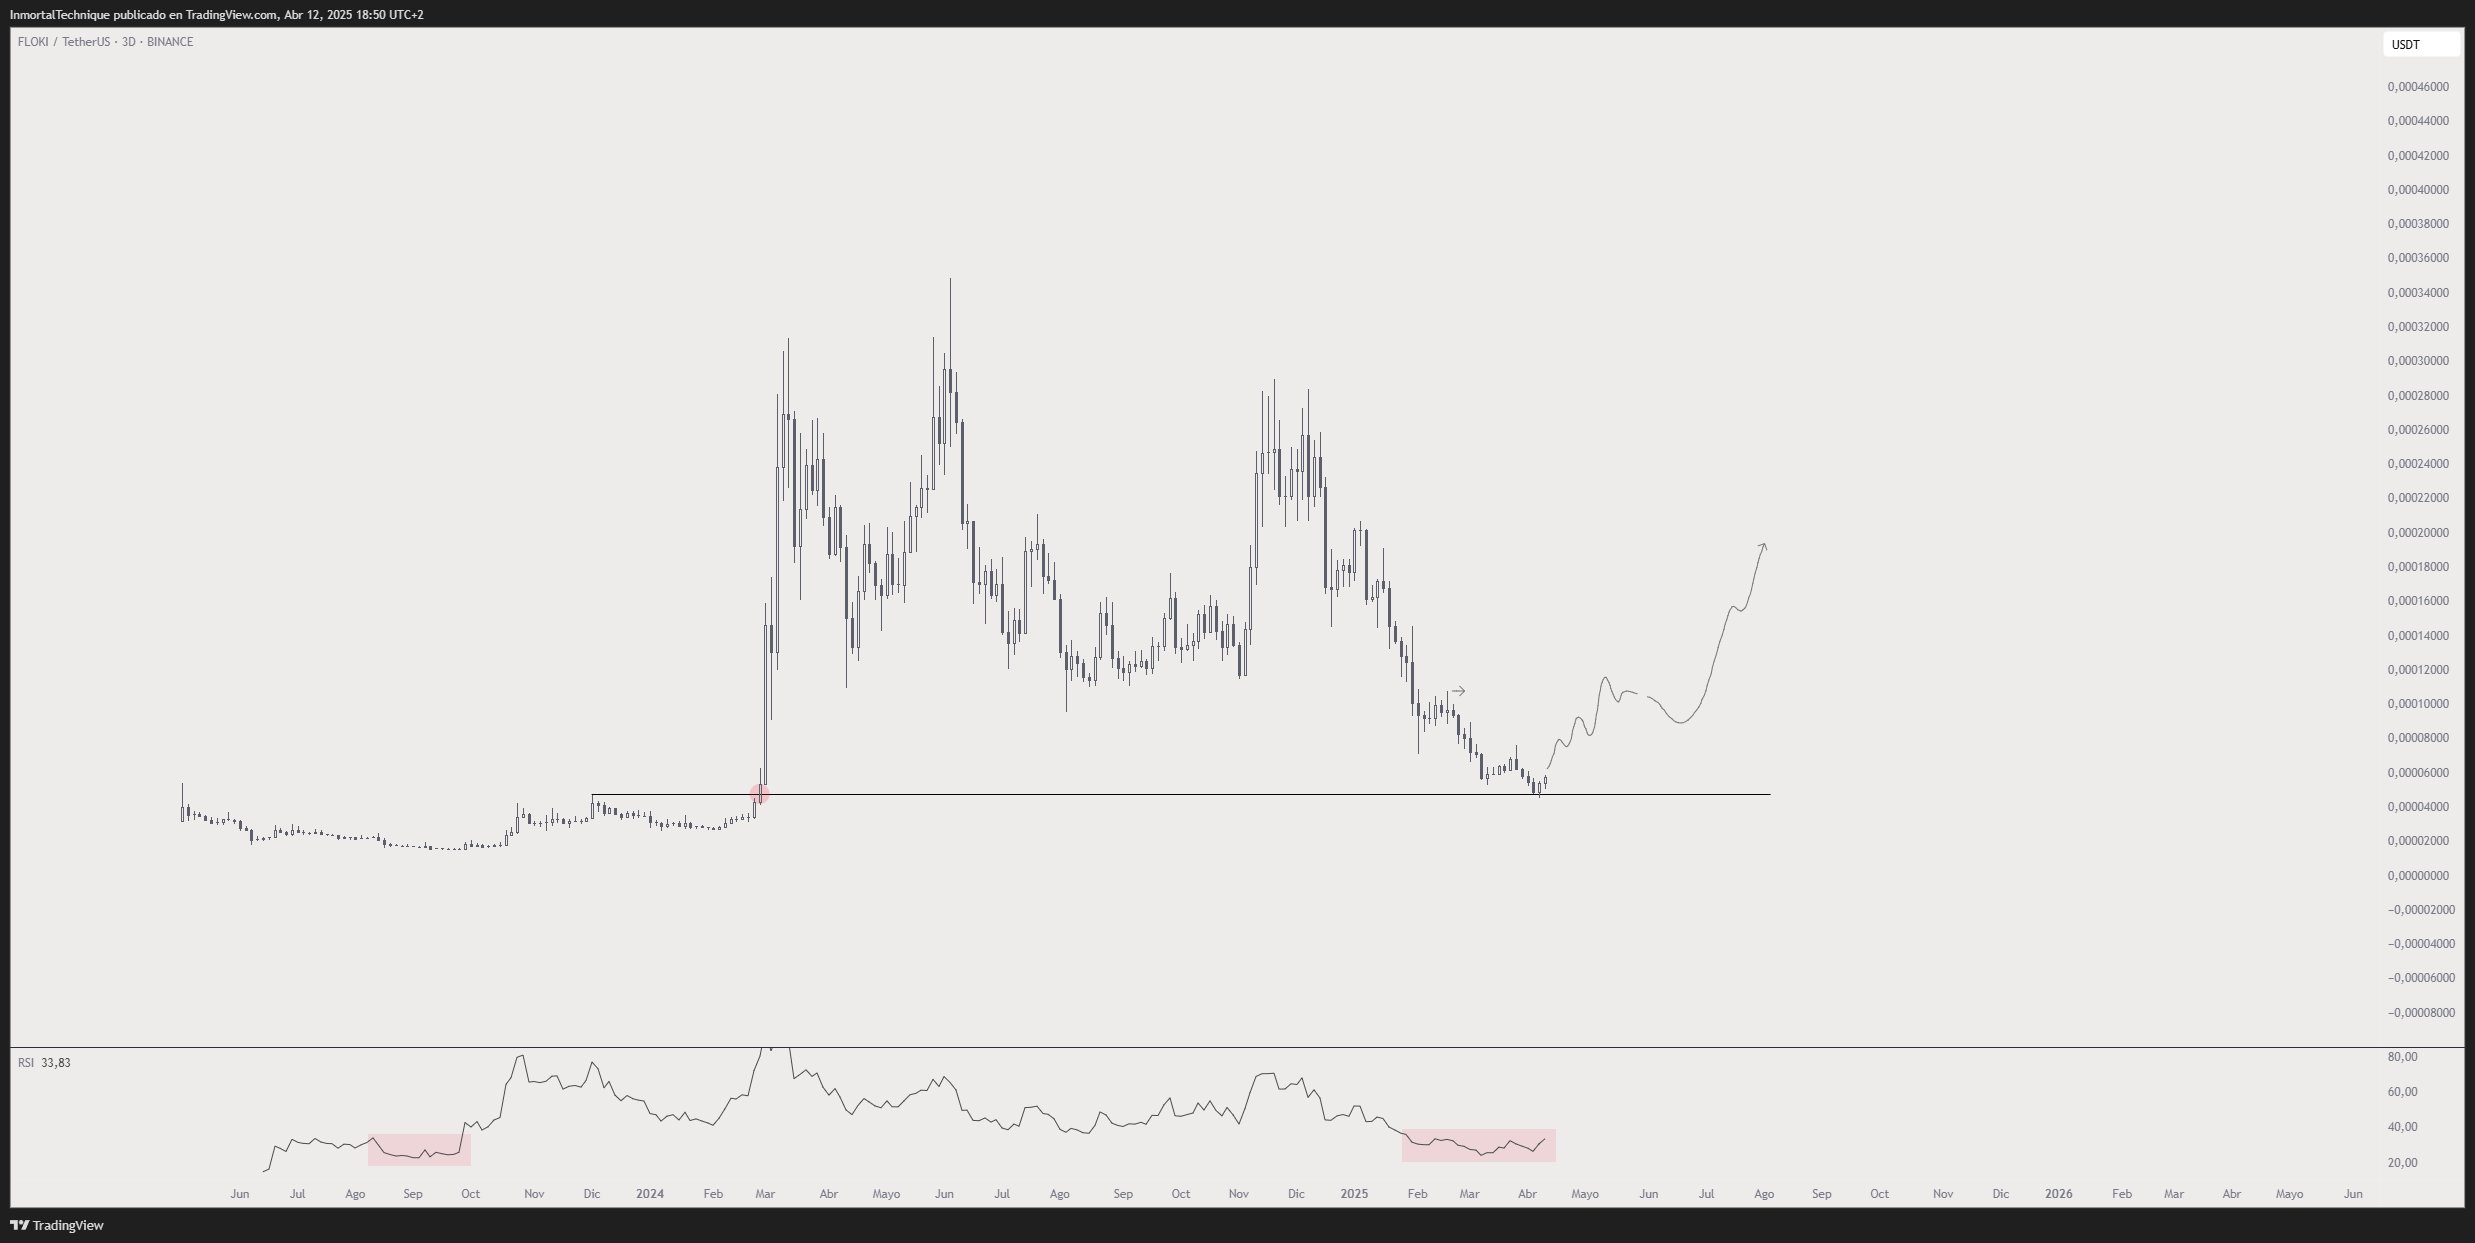
The RSI is a momentum indicator that can help traders spot levels where an asset is oversold or overbought. At time of writing, FLOKI is worth $0.000057.
Follow us on X, Facebook and Telegram
Don’t Miss a Beat – Subscribe to get email alerts delivered directly to your inbox
Check Price Action
Surf The Daily Hodl Mix
 

Disclaimer: Opinions expressed at The Daily Hodl are not investment advice. Investors should do their due diligence before making any high-risk investments in Bitcoin, cryptocurrency or digital assets. Please be advised that your transfers and trades are at your own risk, and any losses you may incur are your responsibility. The Daily Hodl does not recommend the buying or selling of any cryptocurrencies or digital assets, nor is The Daily Hodl an investment advisor. Please note that The Daily Hodl participates in affiliate marketing.
Generated Image: Midjourney
Source link
Altcoin
Solana Price Eyes Breakout Toward $143 As Inverse Head & Shoulders Pattern Takes Shape On 4-hour Chart
Reason to trust
![]()
Strict editorial policy that focuses on accuracy, relevance, and impartiality
Created by industry experts and meticulously reviewed
The highest standards in reporting and publishing
Strict editorial policy that focuses on accuracy, relevance, and impartiality
Morbi pretium leo et nisl aliquam mollis. Quisque arcu lorem, ultricies quis pellentesque nec, ullamcorper eu odio.
Solana appears to be gearing up for a major technical breakout, with recent price action building up an interesting chart formation. A familiar bullish pattern has formed, and if validated, it could drive the price to a level not seen in recent weeks. This new development was highlighted by popular analyst Titan of Crypto on social media platform X.
Pattern Breakout Sets $143 In Sight
Like every other large market-cap cryptocurrency, Solana has experienced an extended period of price crashes since late February. In the case of Solana, this price crash has been drawing out since January, when it reached an all-time high of $293 during the euphoria surrounding the Official Trump meme coin. Since then, Solana has corrected massively, even reaching a low of $97 on April 7.
Related Reading
The price action before and after this $97 low has created an interesting formation on the 4-hour candlestick timeframe chart. As crypto analyst Titan of Crypto noted, this formation is enough to send Solana back up to $143.
At the heart of the latest bullish outlook is a clearly defined inverse head and shoulders structure, which is known for its reliability in signaling a reversal from a downtrend to a bullish breakout. The left shoulder of the pattern began forming in early April as Solana attempted to rebound from sub-$110 levels. The subsequent drop to the $96 bottom on April 7 formed the head of the structure. From there, a recovery started as buyers cautiously stepped back in, giving rise to the right shoulder.
The breakout of the neckline resistance has taken place in the past 24 hours. With this in mind, Titan of Crypto predicted that $143 becomes the next logical destination based on the measured move from the head to the neckline.
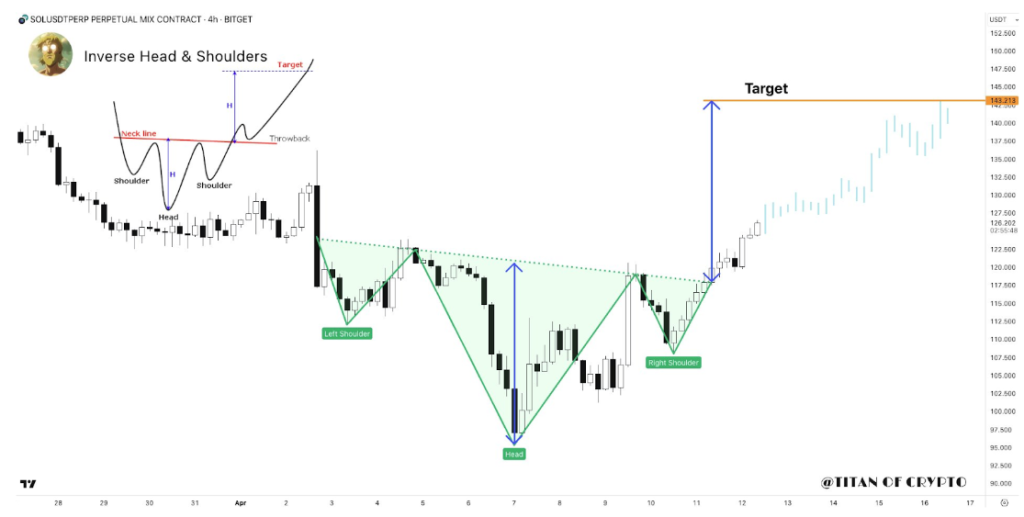
Image From X: Titan of Crypto
Momentum Strengthens With Structure Confirmation
Looking at the chart shared by the analyst, the momentum behind Solana’s price movement appears to be gaining strength. Trading volume is an important metric in evaluating the strength of a breakout, and the volume accompanying the recent breakout above the neckline seemingly confirms it.
Particularly, Solana has seen a 5.3% increase in its price during the past 24 hours, with trading volume surging by 3.76% within this timeframe to $4.21 billion.
Although it is common to see a throwback or minor consolidation just above the neckline, the projected path suggests continued upside as long as price action holds above that key breakout zone.
Related Reading
At the time of writing, Solana is trading at $129, 10% away from reaching this inverse head-and-shoulder target. A move to $143 would not only represent a meaningful recovery from April’s lows but could also improve the confidence in Solana’s price trajectory moving into Q2. The next outlook is what happens after it reaches this target of $143, which will depend on the general market sentiment.
Featured image from The Information, chart from TradingView
Source link

Solana Retests Bearish Breakout Zone – $65 Target Still In Play?

How Expanding Global Liquidity Could Drive Bitcoin Price To New All-Time Highs

Apple Delists 14 Crypto Apps in South Korea Including KuCoin and MEXC Exchanges Amid Regulatory Crackdown

Athens Exchange Group eyes first onchain order book via Sui

Futureverse Acquires Candy Digital, Taps DC Comics and Netflix IP to Boost Metaverse Strategy
Court Grants Ripple And SEC’s Joint Motion To Suspend Appeal

AVAX Falls 2.1% as Nearly All Assets Trade Lower

What is a VTuber, and how do you become one in 2025?

Top Expert’s Update Sets $10 Target

How Academia Interacts With The Bitcoin Ecosystem

AB DAO and Bitget Launch Dual Reward Campaign, Distributing $2.6M Worth of $AB Globally

AI crypto tokens at risk as Nvidia faces restrictions on China exports

Coinbase Urges Australia to Vote for Crypto Progress in May

How High Would Pi Network Price Go If Pi Coin Adopts Transparency to Avoid Mantra Pitfalls

XRP’s ‘Rising Wedge’ Breakdown Puts Focus on $1.6 Price Support


 24/7 Cryptocurrency News5 months ago
Arthur Hayes, Murad’s Prediction For Meme Coins, AI & DeFi Coins For 2025

 Bitcoin3 months ago
Expert Sees Bitcoin Dipping To $50K While Bullish Signs Persist

 24/7 Cryptocurrency News3 months ago
Aptos Leverages Chainlink To Enhance Scalability and Data Access

 Bitcoin5 months ago
Bitcoin Could Rally to $80,000 on the Eve of US Elections

 Opinion5 months ago
Crypto’s Big Trump Gamble Is Risky

 Bitcoin5 months ago
Institutional Investors Go All In on Crypto as 57% Plan to Boost Allocations as Bull Run Heats Up, Sygnum Survey Reveals

 Altcoins3 months ago
Sonic Now ‘Golden Standard’ of Layer-2s After Scaling Transactions to 16,000+ per Second, Says Andre Cronje

 Price analysis5 months ago
Ripple-SEC Case Ends, But These 3 Rivals Could Jump 500x
