SOL
Solana (SOL) Faces Headwinds: Can Bulls Revive Momentum?
Published
4 months agoon
By
admin
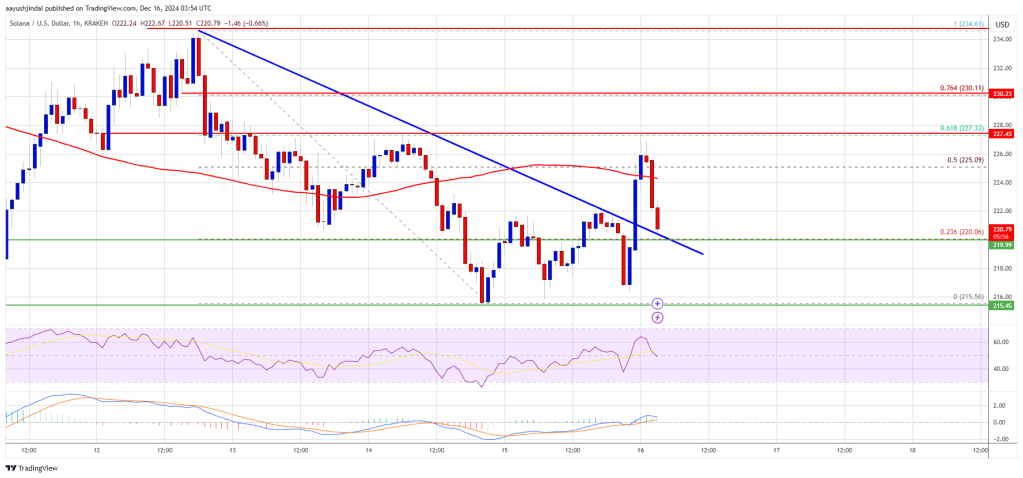
Solana remained stable above the $215 level. SOL price is now recovering losses and facing hurdles near the $228 and $332 levels.
- SOL price started a fresh increase after it tested the $215 zone against the US Dollar.
- The price is now trading below $225 and the 100-hourly simple moving average.
- There was a break above a connecting bearish trend line with resistance at $222 on the hourly chart of the SOL/USD pair (data source from Kraken).
- The pair could start a fresh increase if the bulls clear the $228 zone.
Solana Price Eyes Upside Break
Solana price formed a support base and started a fresh increase from the $215 level but lagged momentum like Bitcoin and Ethereum. There was a decent increase above the $218 and $220 resistance levels.
There was a break above a connecting bearish trend line with resistance at $222 on the hourly chart of the SOL/USD pair. The pair climbed above $225 and tested the 50% Fib retracement level of the downward move from the $234 swing high to the $215 low.
However, the price is now facing many hurdles near $225. Solana is now trading below $225 and the 100-hourly simple moving average. On the upside, the price is facing resistance near the $225 level.
The next major resistance is near the $228 level or the 61.8% Fib retracement level of the downward move from the $234 swing high to the $215 low. The main resistance could be $230. A successful close above the $230 resistance level could set the pace for another steady increase. The next key resistance is $235. Any more gains might send the price toward the $250 level.
Another Decline in SOL?
If SOL fails to rise above the $228 resistance, it could start another decline. Initial support on the downside is near the $220 level. The first major support is near the $215 level.
A break below the $215 level might send the price toward the $205 zone. If there is a close below the $205 support, the price could decline toward the $200 support in the near term.
Technical Indicators
Hourly MACD – The MACD for SOL/USD is losing pace in the bullish zone.
Hourly Hours RSI (Relative Strength Index) – The RSI for SOL/USD is below the 50 level.
Major Support Levels – $220 and $215.
Major Resistance Levels – $228 and $230.
Source link
You may like


Tariff Carnage Starting to Fulfill BTC’s ‘Store of Value’ Promise


The cost of innovation — Regulations are Web3’s greatest asset


Best Crypto to Buy as Derivatives Exchange CME Set to Launch XRP Futures


Metaplanet Buys Additional ¥1.92 Billion Worth Of Bitcoin


Here Are Four Signs the Stock Market Has Bottomed, According to Fundstrat’s Tom Lee


Bitcoin dips below $94,000 as ETFs record $3b weekly inflow
SOL
Solana (SOL) Holding Strong Above $150 — Breakout Zone In Play
Published
2 days agoon
April 25, 2025By
admin
Solana started a fresh increase from the $132 support zone. SOL price is now consolidating and might climb further above the $155 resistance zone.
- SOL price started a fresh increase above the $135 and $150 levels against the US Dollar.
- The price is now trading above $150 and the 100-hourly simple moving average.
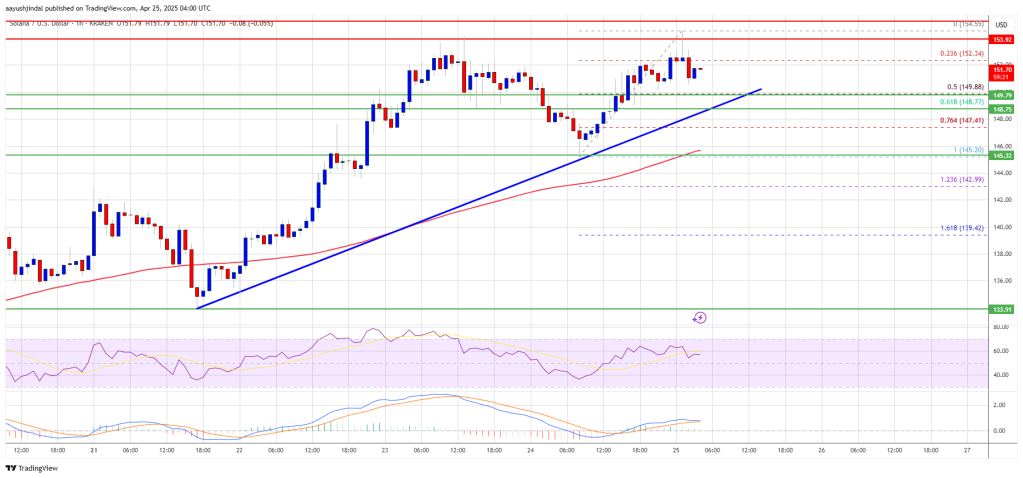
- There is a connecting bullish trend line forming with support at $150 on the hourly chart of the SOL/USD pair (data source from Kraken).
- The pair could start a fresh increase if it clears the $155 resistance zone.
Solana Price Gains Over 10%
Solana price formed a base above the $132 support and started a fresh increase, like Bitcoin and Ethereum. SOL gained pace for a move above the $135 and $145 resistance levels.
The pair even spiked toward the $150 resistance zone. A high was formed at $154.55 and the price is now consolidating gains. There was a minor move below the 23.6% Fib retracement level of the upward move from the $145 swing low to the $155 high.
Solana is now trading above $150 and the 100-hourly simple moving average. There is also a connecting bullish trend line forming with support at $150 on the hourly chart of the SOL/USD pair. The trend line is close to the 50% Fib retracement level of the upward move from the $145 swing low to the $155 high.
On the upside, the price is facing resistance near the $154 level. The next major resistance is near the $155 level. The main resistance could be $162. A successful close above the $162 resistance zone could set the pace for another steady increase. The next key resistance is $175. Any more gains might send the price toward the $180 level.
Pullback in SOL?
If SOL fails to rise above the $155 resistance, it could start another decline. Initial support on the downside is near the $150 zone. The first major support is near the $145 level.
A break below the $145 level might send the price toward the $138 zone. If there is a close below the $138 support, the price could decline toward the $132 support in the near term.
Technical Indicators
Hourly MACD – The MACD for SOL/USD is gaining pace in the bullish zone.
Hourly Hours RSI (Relative Strength Index) – The RSI for SOL/USD is above the 50 level.
Major Support Levels – $150 and $145.
Major Resistance Levels – $155 and $162.
Source link
Altcoins
XRP, Solana, DOGE and Others Among 72 Different ETF Applications Waiting for SEC Approval: Report
Published
4 days agoon
April 24, 2025By
admin
Crypto firms are now waiting to hear back on 72 active applications for new crypto-related exchange-traded funds (ETFs).
James Seyffart, an ETF analyst at Bloomberg Intelligence, compiled the list of submissions to the U.S. Securities and Exchange Commission (SEC).
ETFs awaiting approval include funds tied to Solana (SOL), XRP (XRP), Sui (SUI), Litecoin (LTC), Axelar (AXL) Hedera (HBAR), BNB, Cardano (ADA), Avalanche (AVAX), Dogecoin (DOGE), Polkadot (DOT), Aptos (APT), Chainlink (LINK), Pudgy Penguins (PENGU), Official Trump (TRUMP), Melania (MELANIA) and Bonk (BONK).
Other potential new ETFs are tied to a basket of currencies, and a few are based on Bitcoin (BTC) and/or Ethereum (ETH), assets that have already been approved for inclusion in other spot ETFs.
Eric Balchunas, a senior ETF analyst at Bloomberg Intelligence, predicts that BTC ETFs will remain dominant regardless of the number of altcoin funds that are approved.
“No Second Best? Bitcoin ETFs command 90% of all the crypto fund assets globally. While a TON of alt/meme coin ETFs are likely going to hit market this year, they will only make a minor dent, Bitcoin likely to retain at least 80-85% share long-term.”
The SEC greenlit the first spot market Bitcoin ETFs in January 2024, bringing in billions of dollars worth of inflows to the top digital asset by market cap, and the regulator subsequently approved Ethereum ETFs for trading last July.
Follow us on X, Facebook and Telegram
Don’t Miss a Beat – Subscribe to get email alerts delivered directly to your inbox
Check Price Action
Surf The Daily Hodl Mix
 

Disclaimer: Opinions expressed at The Daily Hodl are not investment advice. Investors should do their due diligence before making any high-risk investments in Bitcoin, cryptocurrency or digital assets. Please be advised that your transfers and trades are at your own risk, and any losses you may incur are your responsibility. The Daily Hodl does not recommend the buying or selling of any cryptocurrencies or digital assets, nor is The Daily Hodl an investment advisor. Please note that The Daily Hodl participates in affiliate marketing.
Featured Image: Shutterstock/Don White – Art Dreamer/Vladimir Sazonov
Source link
24/7 Cryptocurrency News
Solana Price Targets $250 as SOL Strategies Unveils $500M Convertible Note to Buy SOL
Published
4 days agoon
April 23, 2025By
admin
Solana price is on the rise, and analysts observe trends that may propel it to the $250 mark. This is an optimistic prediction following SOL Strategies, a listed Canadian company that deals in the Solana ecosystem, announcing that it has secured a $500 million convertible note deal with ATW Partners to boost its SOL holdings and staking activities.
$500 Million Convertible Note Structure To Buy SOL
SOL Strategies has secured what it describes as a “first-of-its-kind” convertible note facility with ATW Partners. According to the announcement, the $500 million facility will be implemented in multiple tranches. This starts with a $20 million closing expected to occur around May 1, 2025. This is subject to customary closing conditions.
BREAKING: SOL Strategies secures landmark USD $500M convertible note facility with ATW Partners to expand SOL holdings.
This first-of-its-kind structure is exclusively for SOL purchases and staking on our validators, with interest paid in SOL.
This represents the largest… pic.twitter.com/p9SB4dRm6o
— SOL Strategies (CSE: HODL | OTCQX: CYFRF) (@solstrategies_) April 23, 2025
The facility is designed basically for the Solana ecosystem. Also, all capital will be exclusively allocated to purchasing SOL tokens. These tokens will then be staked on validators operated directly by SOL Strategies.
The announcement comes at a time when the Solana price has reclaimed the $150 level. SOL has pumped close to 18% in the last seven days.
In a notable element of the agreement, interest on the notes will be paid in SOL tokens rather than fiat currency. This interest will be calculated as up to 85% of the staking yield generated by the SOL acquired through the facility.
Technical Analysis Points To $250 Solana Price Target
Technical analysts are observing bullish patterns on Solana price charts that are indicative of a possible run-up to the $250 level. The SOL/USDT chart shows a definitive breakout from a falling wedge pattern. This is identified as a bullish indication of a price increase in technical analysis.
Analyst Luciano_BTC has shared some important changes on the chart. They are a “Falling Wedge” pattern that has shifted higher with a clean “Trendline Breakout.” The chart from the analyst also displays a potential target of +50% Uptrend.
Called it – pumped it.
$SOL is the easiest trade of the century.
In my opinion, more green candles are coming.
NFA. https://t.co/MRjTpSy9ij pic.twitter.com/HXYbgwBR58
— Lucky (@LLuciano_BTC) April 23, 2025
Technical analyst Christiaan concurs with this technical outlook. He just tweeted that the Solana price is heading to $250. Another analyst, Lucky, expressed strong conviction about Solana’s prospects. He called it the easiest trade of the century and predicting more green candles are coming.
The technical configuration shows SOL finding support at a point known as a Demand Zone, which Luciano_BTC identified, prior to starting its current rally. The chart shows a number of possible points of resistance to $250, with targets towards $180 and $220 before reaching the final destination. CoinGape has also analyzed and shared their price prediction for Solana, which shows that SOL is 49% bullish.
Vignesh Karunanidhi
Vignesh Karunanidhi is a seasoned crypto journalist with nearly 7 years of experience in the cryptocurrency industry. He has contributed to numerous publications, including WatcherGuru, BeInCrypto, Milkroad, and authored over 10,000 articles
Disclaimer: The presented content may include the personal opinion of the author and is subject to market condition. Do your market research before investing in cryptocurrencies. The author or the publication does not hold any responsibility for your personal financial loss.
Source link

Tariff Carnage Starting to Fulfill BTC’s ‘Store of Value’ Promise

The cost of innovation — Regulations are Web3’s greatest asset

Best Crypto to Buy as Derivatives Exchange CME Set to Launch XRP Futures

Metaplanet Buys Additional ¥1.92 Billion Worth Of Bitcoin

Here Are Four Signs the Stock Market Has Bottomed, According to Fundstrat’s Tom Lee

Bitcoin dips below $94,000 as ETFs record $3b weekly inflow

Bitcoin Post-Halving Price Performance Is the Worst on Record. Why?

Expert Predicts Start Date For Pi Network Price Pump

GameFi Tokens Show Signs of Life After Gala Games, White House Tie-Up

Bitcoin trades at ‘40% discount’ as spot BTC ETF buying soars to $3B in one week

Bitcoin Continues To Flow Out Of Major Exchanges — Supply Squeeze Soon?

BlackRock’s Bitcoin ETF Sees $643 Million Inflows

DePIN Altcoin Outpaces Crypto Market and Skyrockets by Nearly 44% Following High-Profile Exchange Listing

Solaxy, BTC bull token, and Pepeto gaining momentum as leading 2025 presale tokens

Australian Radio Station Used AI DJ For Months Before Being Discovered

Arthur Hayes, Murad’s Prediction For Meme Coins, AI & DeFi Coins For 2025

Expert Sees Bitcoin Dipping To $50K While Bullish Signs Persist

3 Voting Polls Show Why Ripple’s XRP Price Could Hit $10 Soon

Aptos Leverages Chainlink To Enhance Scalability and Data Access

Bitcoin Could Rally to $80,000 on the Eve of US Elections

Crypto’s Big Trump Gamble Is Risky

Sonic Now ‘Golden Standard’ of Layer-2s After Scaling Transactions to 16,000+ per Second, Says Andre Cronje

Institutional Investors Go All In on Crypto as 57% Plan to Boost Allocations as Bull Run Heats Up, Sygnum Survey Reveals

The Future of Bitcoin: Scaling, Institutional Adoption, and Strategic Reserves with Rich Rines

Ripple-SEC Case Ends, But These 3 Rivals Could Jump 500x

Has The Bitcoin Price Already Peaked?

A16z-backed Espresso announces mainnet launch of core product

Xmas Altcoin Rally Insights by BNM Agent I

Blockchain groups challenge new broker reporting rule

I’m Grateful for Trump’s Embrace of Bitcoin
Trending

 24/7 Cryptocurrency News6 months ago
Arthur Hayes, Murad’s Prediction For Meme Coins, AI & DeFi Coins For 2025

 Bitcoin3 months ago
Expert Sees Bitcoin Dipping To $50K While Bullish Signs Persist

 Ripple Price1 month ago
3 Voting Polls Show Why Ripple’s XRP Price Could Hit $10 Soon

 24/7 Cryptocurrency News4 months ago
Aptos Leverages Chainlink To Enhance Scalability and Data Access

 Bitcoin6 months ago
Bitcoin Could Rally to $80,000 on the Eve of US Elections

 Opinion6 months ago
Crypto’s Big Trump Gamble Is Risky

 Altcoins3 months ago
Sonic Now ‘Golden Standard’ of Layer-2s After Scaling Transactions to 16,000+ per Second, Says Andre Cronje

 Bitcoin5 months ago
Institutional Investors Go All In on Crypto as 57% Plan to Boost Allocations as Bull Run Heats Up, Sygnum Survey Reveals


✓ Share: