bull market
SPXHits $1.5B Market Cap First Time As Open Interest Rises
Published
5 months agoon
By
admin
The meme coin SPX6900 has set a significant milestone, passing the $1.5 billion market cap for the very first time on Jan. 7, 2024.
This follows increased trading activities and rising interest in meme coins as an asset class in the crypto market. It goes without saying that it has placed SPX6900 (SPX) among the best-performing digital assets in the early days of 2025, which is often known as the January effect.
https://twitter.com/blocknewsdotcom/status/1876436386334605787
Trading at $1.53, the token gained 1.87% in the past 24 hours, with a daily trading volume exceeding $95 million, highlighting growing investor interest.
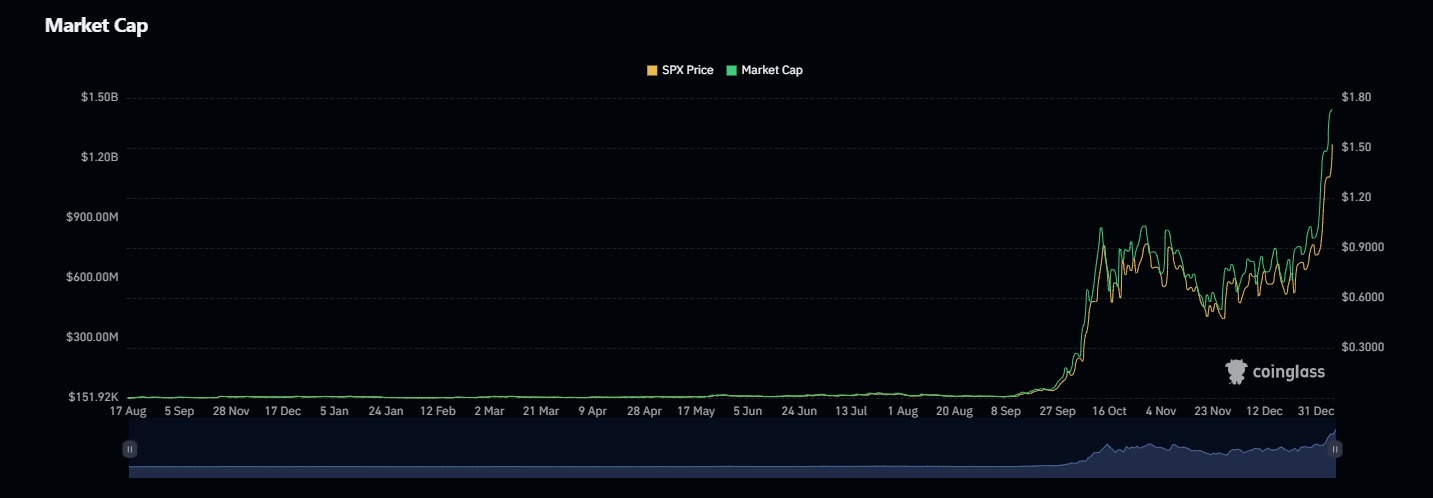
SPX is a meme coin that runs on the ETH blockchain, which comes at a time when meme coins continue to catch market attention with their combination of speculative appeal and cultural resonance. Described in its unofficial manifesto as “the stock market for the people,” the token symbolizes a movement toward economic liberation and an alternative to traditional wealth creation systems. As of today, the circulating supply is estimated to hover around 931 million, with about 6.9% of tokens or roughly 69 million burnt. The token uses the Wormhole technology to be a cross-chain asset, enhancing availability across different blockchain estates.
SPX’s market perspective
From a market point of view, the token could rise on support from technical indicators that show a rather bullish sentiment. The Moving Average Convergence Divergence (MACD) has seen the MACD line cross above the signal line, a classical bullish determinant.
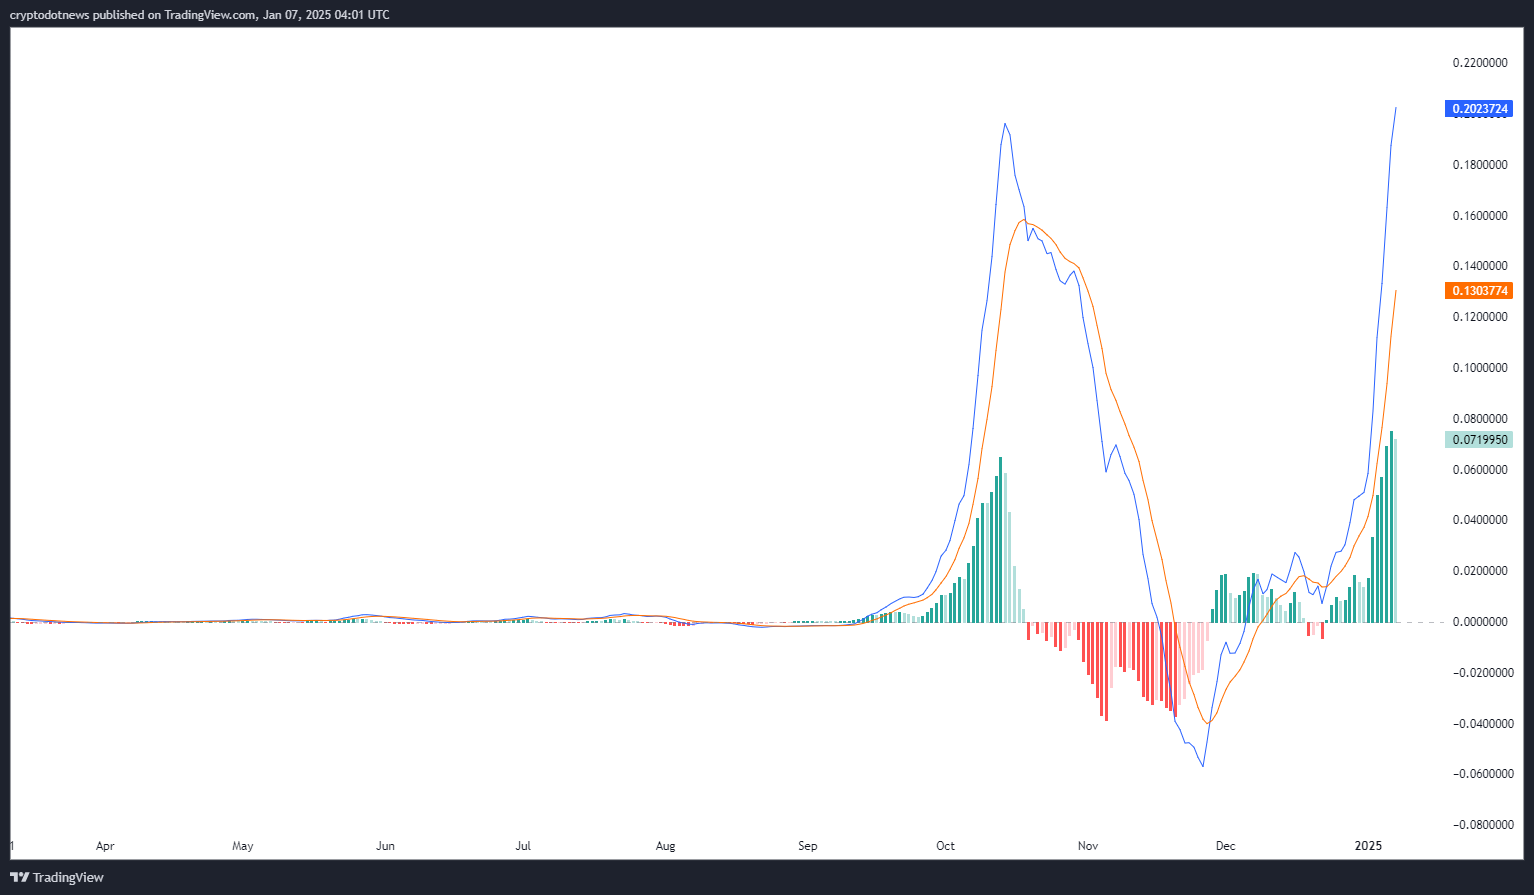
The MACD histogram, which displays green increasing bars, refers to the uninterrupted buying pressure. Moreover, the rise in the trading volume indicates some ongoing enthusiasm within the market.
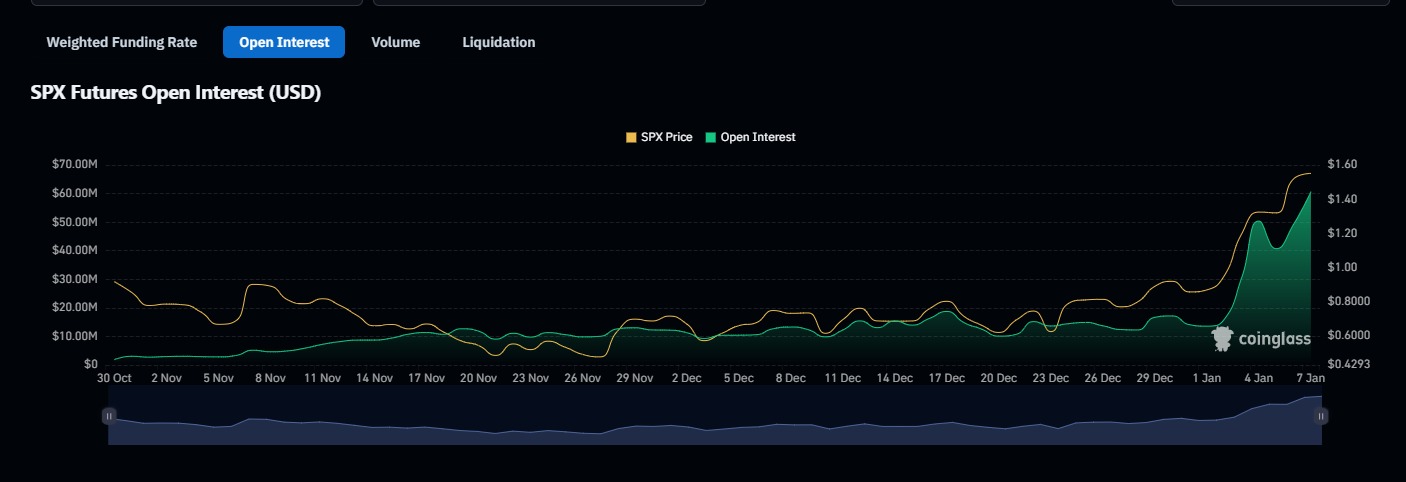
In addition, open interest for SPX futures has grown consistently and surpassed $65 million on Jan. 7, 2025, according to Coinglass. Specification of trader inflows points to increased trader sentiment and willingness to operate in the derivatives market. The growing open interest and an increase in holder counts suggest SPX’s growing adoption. According to Santiment, the number of holders rose from 14,955 in Oct. 2024 to over 23,667 in last week of Dec 2024, reflecting the market confidence that the token is witnessing in early January.
Source link
You may like


Dems Say They’re Blocked From Info on Verge of Crypto Market Structure Bill Hearings


Dow gains 214 points, markets end higher as strong labor data eases tariff concerns


Ethereum Price Headed For Crash To $2,000 With Current Price Action


Tokenized funds hit $5.7B, scaling fast — Moody’s


Authorities Warn of Phony Text Messages Phishing for Sensitive Information, Telling Victims Their Bank Account Is at Risk


Tether invests in Chilean crypto exchange Orionx

Disclosure: The views and opinions expressed here belong solely to the author and do not represent the views and opinions of crypto.news’ editorial.
Although some believe that crypto PR and communications efforts should slow down when the markets are cooling off, it couldn’t be further from the truth. Sure, during crypto winters, product development teams huddle together to work on building their solutions—and that’s great—but these are also the ideal times for brand building.
Indeed, when the market is going through a crypto slowdown, the strategic brands are seizing the opportunity to strengthen credibility while everyone else is hibernating. And when the market inevitably heats up, this strategy will position such players ahead of the competition.
Now, not all might agree with this point of view, arguing that pushing PR during a downturn is tone-deaf. Others might see slow market communications as unnecessary noise when product development should be the only priority. But visibility isn’t vanity—it’s strategy, and it’s easier to get noticed in calmer markets.
Slower news, hungrier journalists
As the movements in the crypto market slow down, so does everything else that relates to it, including newsrooms. In other words, journalists have more space (and patience) for stories that go beyond mere price action. There are no big stories of exploding digital assets. Bitcoin (BTC) is nowhere near reaching a new all-time high, and altcoins are taking the cue from the industry’s number one, sleeping it off themselves.
Thus, when the hype and the noise in the crypto sphere die down, media outlets are on the lookout for stories worth telling. In such moments, true innovation and strong projects get their chance to shine and get real editorial interest, instead of getting lost among drama-driven headlines.
Small news can be perceived as newsworthy in a bear market
Here’s a secret—during a bull run, not even a $10 million funding round might turn heads. It’s just too common when there’s money flowing everywhere across the board. To illustrate, an insider source at a crypto media powerhouse once said that their “funding news coverage threshold is a minimum of $10 million, with exceptions.”
This might sound counterintuitive at first, but in a more bearish market sentiment, that same outlet might just be interested in a mere $5 million, or even a $1.4 million seed round, like the one recently raised by crypto payment hub Lyzi to expand its Tezos-based service.
In other words, Lyzi has just told the world that it’s there and constantly working on building its product. Arguably, in a period of market pessimism, it would be one hell of a smart and well-timed PR move, and the best part—the likes of CoinDesk might pick it up.
Pick up the mic when no one else is talking
Providing expert commentary when the industry goes silent becomes even more valuable. Journalists still seek third-party sources and insights, and this is your chance to establish yourself as an authoritative figure in the sector, to whom journalists will come back when the bull market returns.
This means that when it’s all quiet on the crypto front and a journalist comes knocking at your door, be ready. Hiring a good PR firm that will lead you, shape your story, and provide the stage is certainly the right move, but it’s up to you to step up with confidence and claim the spotlight.
Execution still matters
With this in mind, don’t mindlessly drop news just for the sake of it. Be strategic about timing, like holidays, conferences, and other major events that might overshadow your news, as well as the tone—this isn’t the time to brag but display resilience and value.
Also, use the time of market bearishness to build your reputation and flesh out your digital footprint through earned media placements in trusted crypto outlets. Potential users, partners, and investors will look you up online, so make sure they have good things to read about you—that’s your PR working in the background.
The real bottom line
All things considered, crypto PR in times of market stagnation and bearish sentiment is not so much about creating hype as it is about demonstrating real substance. It’s about crafting a narrative that portrays you as the crypto player who can weather the blizzard, better positioning your brand.
So, the next time you’re considering staying silent during a crypto downturn, think again. You might miss out on the best PR opportunities of the cycle, as at this time, you could get more attention than usual.
Don’t wait for the bull to charge—make your mark when the field is clear.

Afik Rechler
Afik Rechler is the co-founder and co-CEO of Chainstory, a results-driven crypto PR agency. He specializes in crypto communications and search-driven content marketing. Afik has been in the crypto industry since late 2016, helping blockchain businesses meet their marketing and communications goals.
Source link
24/7 Cryptocurrency News
CryptoQuant CEO Explains Why Bitcoin Bull Market is Over Now
Published
2 months agoon
April 5, 2025By
admin
CryptoQuant CEO Ki Young Ju avers that the Bitcoin bull market is over as prices hover around the $82K mark. The expert hinges his theory for Bitcoin price on key technicals, analyzing the relationship between Realized Cap, Market Cap, and selling pressure to reach his conclusions.
Expert Gives Reason Why The Bitcoin Bull Market Is Over
According to an analysis on X, Ki Young Ju reveals that Bitcoin is firmly in bear market territory to the dismay of investors. The CryptoQuant CEO surmised in his analysis that the curtain has fallen for the Bitcoin bull market giving reasons.
In his analysis, Ju bases his prediction on the interplay between Bitcoin’s Realized Cap and the asset’s market capitalization. Realized market cap measures Bitcoin’s value using the price at which each BTC held in wallets was transferred. On the other hand, the market cap measures value by multiplying the circulating BTC supply with current prices.
The CryptoQuant CEO notes that market capitalization alone is not the best way to track the Bitcoin Bull Market. According to Ju, when there is low selling pressure in the markets, small Bitcoin purchases often send the market capitalization to new highs. Ju notes that Strategy has ridden the tailwind of low selling pressure to grow the paper value of their BTC holdings.
Conversely, when sell pressure is high, sizeable purchases are unable to send Bitcoin price on a rally. Strategy’s purchase of 22,048 BTC for $1.92 billion did not trigger a rally like its previous acquisition.
Onchain data indicates that Bitcoin’s Realized Cap is rising but market capitalization continues its decline, an indicator of bearish sentiments. Ju notes that fresh capital is flooding the markets but prices are not responding, signaling the end of the bitcoin bull market.


“When even large capital can’t push prices upward, it’s a bear,” said Ju.
Bitcoin Price Flashes Bearish Signals
Despite glowing fundamentals and large acquisitions, on-chain indicators are underwhelming for the top cryptocurrency. Bitcoin price is consolidating within a bearish pennant, a signal for even lower prices. However, a small bump has triggered speculation of a potential Bitcoin price decoupling from S&P500.


Crypto Sat says a short-term drop to $80K is in play for Bitcoin with prices standing at $82,950. However, Ju has even grimmer predictions for BTC, noting that a near-term rally is unlikely for the asset. The CryptoQuant CEO notes that it will take the asset up to six months to drag itself out of the bear market.
“Sell pressure could ease anytime, but historically, real reversals take at least six months,” said Ju.
Despite the dour sentiments, US Treasury Secretary Scott Bessent has praised BTC as a store of value comparing it with gold.
Aliyu Pokima
Aliyu Pokima is a seasoned cryptocurrency and emerging technologies journalist with a knack for covering needle-moving stories in the space. Aliyu delivers breaking news stories, regulatory updates, and insightful analysis with depth and precision. When he’s not poring over charts or following leads, Aliyu enjoys playing the bass guitar, lifting weights and running marathons.
Disclaimer: The presented content may include the personal opinion of the author and is subject to market condition. Do your market research before investing in cryptocurrencies. The author or the publication does not hold any responsibility for your personal financial loss.
Source link

Following a sharp multi-week selloff that dragged Bitcoin from above $100,000 to below $80,000, the recent price bounce has traders debating whether the Bitcoin bull market is truly back on track or if this is merely a bear market rally before the next macro leg higher.
Bitcoin’s Local Bottom or Bull Market Pause?
Bitcoin’s latest correction was deep enough to rattle confidence, but shallow enough to maintain macro trend structure. Price seems to have set a local bottom between $76K–$77K, and several reliable metrics are beginning to solidify the local lows and point towards further upside.
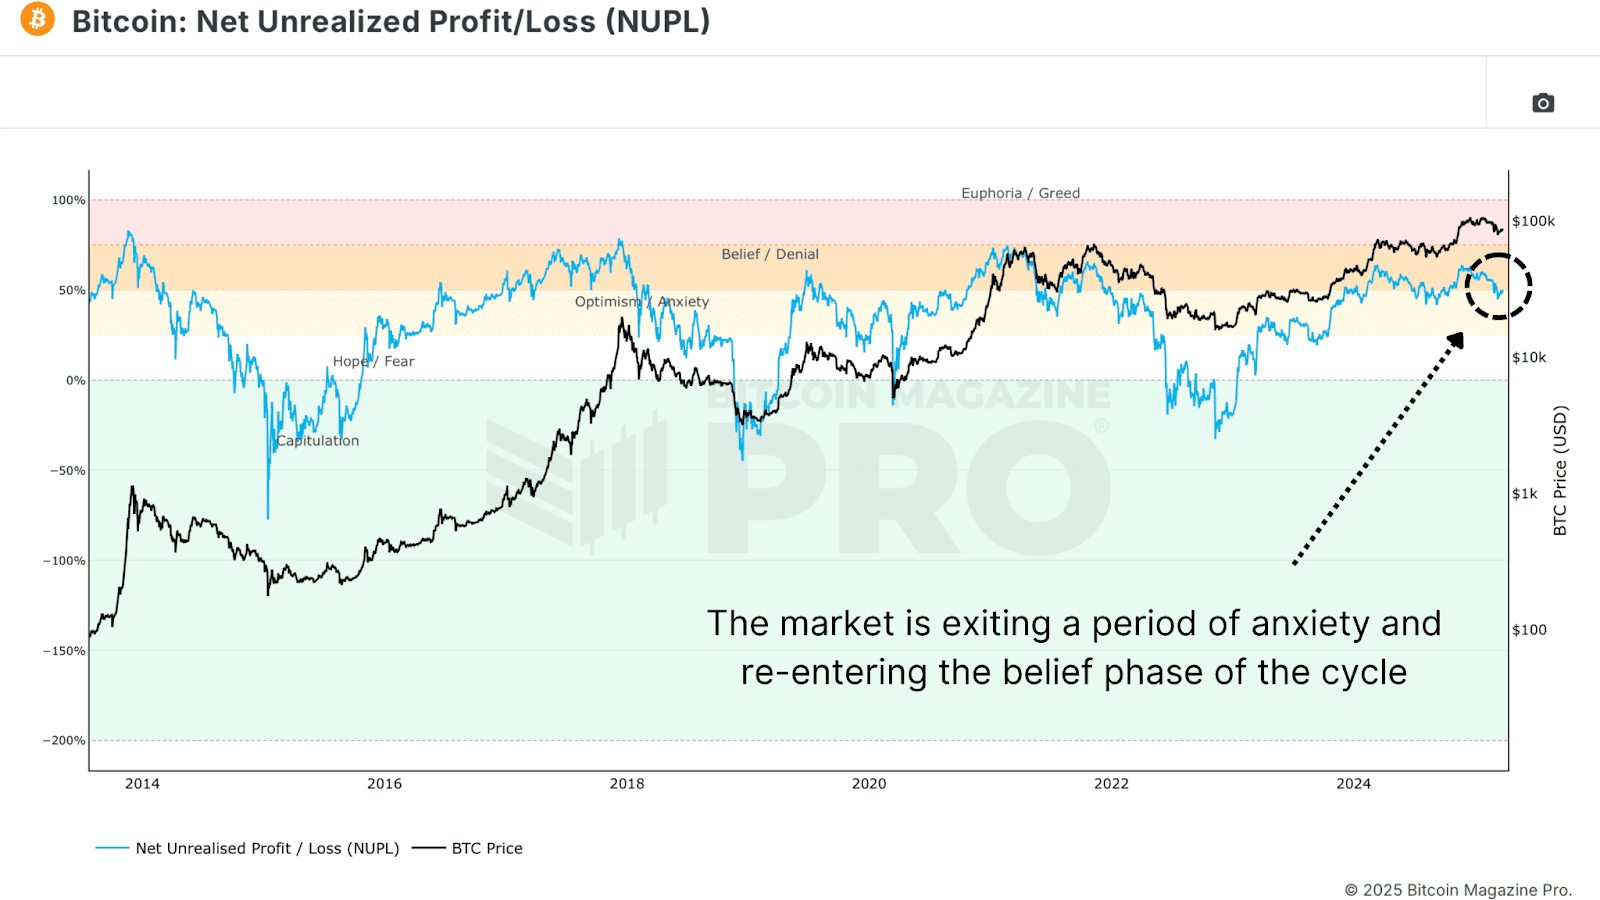
The Net Unrealized Profit and Loss (NUPL) is one of the most reliable sentiment gauges across Bitcoin cycles. As price fell, NUPL dropped into “Anxiety” territory, but following the rebound, NUPL has now reclaimed the “Belief” zone, a critical sentiment transition historically seen at macro higher lows.
The Value Days Destroyed (VDD) Multiple weighs BTC spending by both coin age and transaction size, and compares the data to a previous yearly average, giving insight into long term holder behavior. Current readings have reset to low levels, suggesting that large, aged coins are not being moved. This is a clear signal of conviction from smart money. Similar dynamics preceded major price rallies in both the 2016/17 and 2020/21 bull cycles.

Bitcoin Long-Term Holders Boost Bull Market
We’re also now seeing the Long Term Holder Supply beginning to climb. After profit-taking above $100K, long-term participants are now re-accumulating at lower levels. Historically, these phases of accumulation have set the foundation for supply squeezes and subsequent parabolic price action.

Bitcoin Hash Ribbons Signal Bull Market Cross
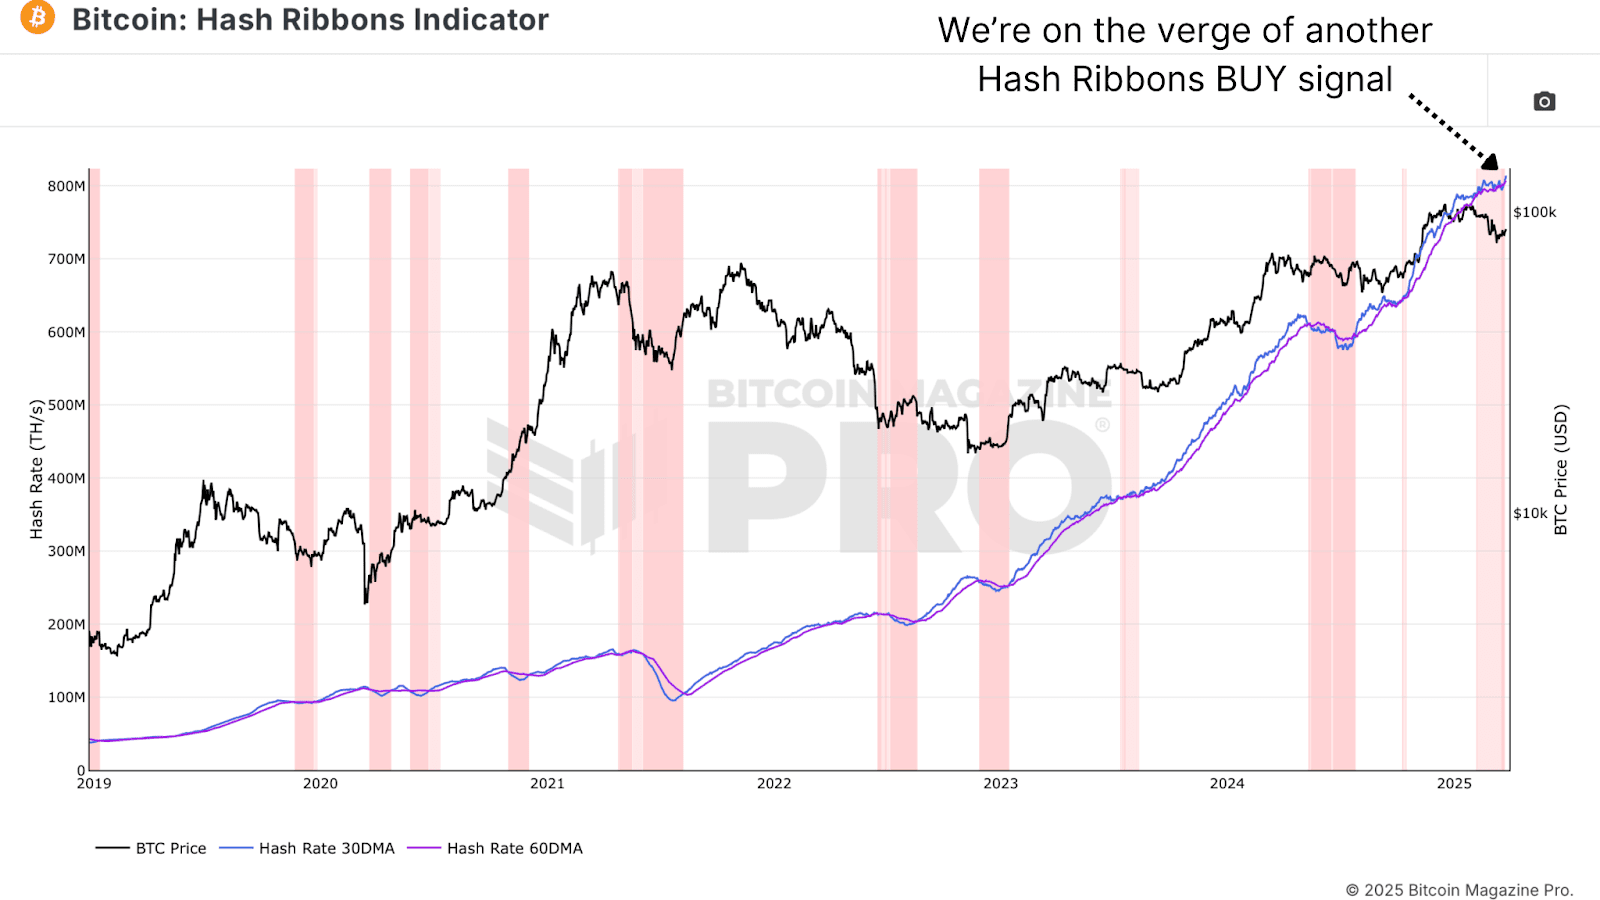
The Hash Ribbons Indicator has just completed a bullish crossover, where the short-term hash rate trend moves above the longer-term average. This signal has historically aligned with bottoms and trend reversals. Given that miner behavior tends to reflect profitability expectations, this cross suggests miners are now confident in higher prices ahead.
Bitcoin Bull Market Tied to Stocks
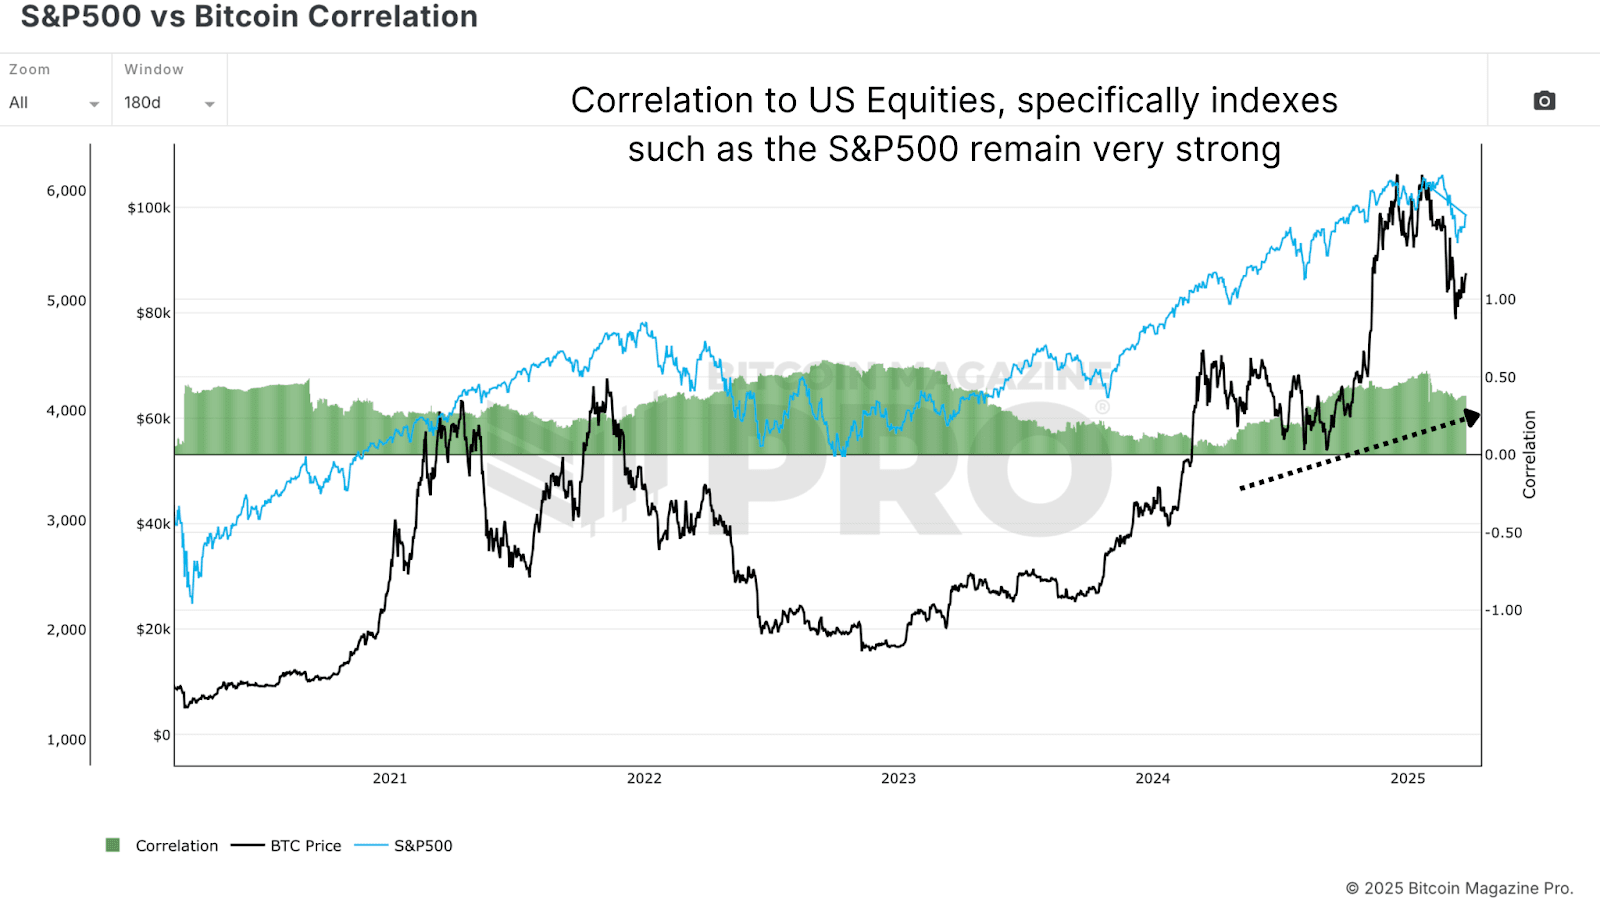
Despite bullish on-chain data, Bitcoin remains closely tied to macro liquidity trends and equity markets, particularly the S&P 500. As long as that correlation holds, BTC will be partially at the mercy of global monetary policy, risk sentiment, and liquidity flows. While rate cut expectations have helped risk assets bounce, any sharp reversal could cause renewed choppiness for Bitcoin.
Bitcoin Bull Market Outlook
From a data-driven perspective, Bitcoin looks increasingly well-positioned for a sustained continuation of its bull cycle. On-chain metrics paint a compelling picture of resilience for the Bitcoin bull market. The Net Unrealized Profit and Loss (NUPL) has shifted from “Anxiety” during the dip to the “Belief” zone after the rebound—a transition often seen at macro higher lows. Similarly, the Value Days Destroyed (VDD) Multiple has reset to levels signaling conviction among long-term holders, echoing patterns before Bitcoin’s rallies in 2016/17 and 2020/21. These metrics point to structural strength, bolstered by long-term holders aggressively accumulating supply below $80,000.
Further supporting this, the Hash Ribbons indicator’s recent bullish crossover reflects growing miner confidence in Bitcoin’s profitability, a reliable sign of trend reversals historically. This accumulation phase suggests the Bitcoin bull market may be gearing up for a supply squeeze, a dynamic that has fueled parabolic moves before. The data collectively highlights resilience, not weakness, as long-term holders seize the dip as an opportunity. Yet, this strength hinges on more than just on-chain signals—external factors will play a critical role in what comes next.
However, macro conditions still warrant caution, as the Bitcoin bull market doesn’t operate in isolation. Bull markets take time to build momentum, often needing steady accumulation and favorable conditions to ignite the next leg higher. While the local bottom between $76K–$77K seems to hold, the path forward won’t likely feature vertical candles of peak euphoria yet. Bitcoin’s tie to the S&P 500 and global liquidity trends means volatility could emerge from shifts in monetary policy or risk sentiment.
For example, while rate cut expectations have lifted risk assets, an abrupt reversal—perhaps from inflation spikes or geopolitical shocks—could test Bitcoin’s stability. Thus, even with on-chain data signaling a robust setup, the next phase of the Bitcoin bull market will likely unfold in measured steps. Traders anticipating a return to six-figure prices will need patience as the market builds its foundation.
If you’re interested in more in-depth analysis and real-time data, consider checking out Bitcoin Magazine Pro for valuable insights into the Bitcoin market.
Disclaimer: This article is for informational purposes only and should not be considered financial advice. Always do your own research before making any investment decisions.
Source link
Dems Say They’re Blocked From Info on Verge of Crypto Market Structure Bill Hearings

Dow gains 214 points, markets end higher as strong labor data eases tariff concerns
Ethereum Price Headed For Crash To $2,000 With Current Price Action
Tokenized funds hit $5.7B, scaling fast — Moody’s
Authorities Warn of Phony Text Messages Phishing for Sensitive Information, Telling Victims Their Bank Account Is at Risk

Tether invests in Chilean crypto exchange Orionx

MARA Hits Record-High Bitcoin Production in May
Retail investors no longer FOMO into BTC, altcoins
AVAX Rises 3.8% on Strong Volume, Breaking Key Resistance Levels

K33 begins Bitcoin buying with 10 BTC purchase for treasury strategy
Why $107,500 And $103,500 Are The Levels To Watch
Pakistan Proposes New Crypto Regulations
Japanese Bitcoin Hoarder Metplanet Adds $115,600,000 Worth of BTC As Stock Surpasses 263% Gains on the Year
Bitcoin traders anticipate decline, watch $100K
Ethereum Foundation Restructures R&D Division, Plans ‘Rethink’ on Design and Development

Arthur Hayes, Murad’s Prediction For Meme Coins, AI & DeFi Coins For 2025

Pi Network coin to $10? 4 catalysts that may make it possible

3 Voting Polls Show Why Ripple’s XRP Price Could Hit $10 Soon

Expert Sees Bitcoin Dipping To $50K While Bullish Signs Persist

Aptos Leverages Chainlink To Enhance Scalability and Data Access

Bitcoin Could Rally to $80,000 on the Eve of US Elections

Crypto’s Big Trump Gamble Is Risky

The Future of Bitcoin: Scaling, Institutional Adoption, and Strategic Reserves with Rich Rines

Institutional Investors Go All In on Crypto as 57% Plan to Boost Allocations as Bull Run Heats Up, Sygnum Survey Reveals

Sonic Now ‘Golden Standard’ of Layer-2s After Scaling Transactions to 16,000+ per Second, Says Andre Cronje

Ripple-SEC Case Ends, But These 3 Rivals Could Jump 500x

Has The Bitcoin Price Already Peaked?

A16z-backed Espresso announces mainnet launch of core product

Blockchain groups challenge new broker reporting rule

Xmas Altcoin Rally Insights by BNM Agent I
Trending

 24/7 Cryptocurrency News7 months ago
Arthur Hayes, Murad’s Prediction For Meme Coins, AI & DeFi Coins For 2025

 Markets3 months ago
Pi Network coin to $10? 4 catalysts that may make it possible

 Ripple Price3 months ago
3 Voting Polls Show Why Ripple’s XRP Price Could Hit $10 Soon

 Bitcoin5 months ago
Expert Sees Bitcoin Dipping To $50K While Bullish Signs Persist

 24/7 Cryptocurrency News5 months ago
Aptos Leverages Chainlink To Enhance Scalability and Data Access

 Bitcoin7 months ago
Bitcoin Could Rally to $80,000 on the Eve of US Elections

 Opinion7 months ago
Crypto’s Big Trump Gamble Is Risky

 Bitcoin4 months ago
The Future of Bitcoin: Scaling, Institutional Adoption, and Strategic Reserves with Rich Rines


✓ Share: