Bitcoin Magazine Pro
The Bitcoin Report: Key Trends, Insights, and Bitcoin Price Forecast
Published
6 months agoon
By
admin

Dive into the full October 2024 Bitcoin Report for the latest insights and analysis. Click here to read the full report: Read the Report
The October 2024 edition of The Bitcoin Report is packed with expert insights and bullish price forecasts as Bitcoin continues to carve its place as the leading decentralized digital asset. This month, we focus on several key topics: Bitcoin’s decreasing exchange balances, ETF inflows surging past $5 billion, and bullish price targets that could redefine Bitcoin’s value over the next quarter. Featured contributions come from some of the biggest names in the Bitcoin space, including Caitlin Long, who provides an industry insight into Bitcoin’s adoption cycle, and Tone Vays, whose exclusive price forecast gives reasons for optimism as Bitcoin heads toward potential new highs.
Report Highlights:
- Bitcoin On-Chain Analysis: This section examines how decreasing exchange balances and growing self-custody reflect an increase in long-term holding sentiment. With Bitcoin exchange balances hitting new lows, it signals rising confidence among investors that are choosing to take control of their own assets rather than leave them on exchanges.
- Bitcoin ETFs: October saw over $5.4 billion in inflows to Bitcoin ETFs, with BlackRock’s IBIT leading the market. This record-setting month underscores the growing acceptance of Bitcoin in mainstream financial markets, bolstered by the approval of options trading on Bitcoin ETFs. Dr. Michael Tabone, Economist & Professor at the University of the Cumberlands, provides his take on how this surge could play out in the coming months.
- Bitcoin Mining Update: Russia and China have quietly expanded their influence in global mining, with the US still holding the largest hashrate share. Lukas Pfeiffer of Crypto Oxygen elaborates on how these shifts may reshape global mining dynamics and what it means for the future.
- Price Forecast by Tone Vays: Bitcoin analyst Tone Vays remains incredibly optimistic about Bitcoin’s future price, citing multiple technical indicators and historical patterns. The report details potential price targets ranging from $102,000 to $140,000 by mid-2025, supported by bullish technical analysis such as Fibonacci extensions and a classic cup and handle chart pattern.
- Industry Insights from Caitlin Long: Caitlin Long, Founder & CEO of Custodia Bank, provides her perspective on Bitcoin’s adoption trends and how the broader economic climate continues to favor decentralized assets. According to Long, Bitcoin’s fundamentals are strong, and a bull market could be on the horizon following the 2024 U.S. presidential election.
The report also contains valuable contributions from other experts in the Bitcoin ecosystem, including Philip Swift on Bitcoin derivatives, Lucas Betschart on regulatory changes, Pete Rizzo on Bitcoin history, Pascal Hügli with on-chain analysis, Dr. Michael Tabone on Bitcoin stocks and ETFs, Joël Kai Lenz on Bitcoin adoption, and Patrick Heusser on technical analysis. These contributions provide a well-rounded look at Bitcoin’s current state and its future potential.
Get the full insights, charts, and analysis by accessing the complete report now. We invite your organization to explore potential sponsorship or joint-publication opportunities for future editions by reaching out to Mark Mason at mark.mason@btcmedia.org. Let’s orange-pill the world together!
Download and Share: This report is freely available to all. Download, share, and help drive the conversation on Bitcoin adoption and education. Use the hashtag #TheBitcoinReport in your posts to join the movement.
Source link
You may like


Stripe Tests New Stablecoin Project as $3.7T Market Looms


Falling Wedge Pattern Confirms $264 target


Ethereum community members propose new fee structure for the app layer


Crypto Investors Sue Nike, Accuse Apparel Giant of Rug Pull After Abrupt Closure of Metaverse Business: Report


Top cryptocurrencies to watch: Pi Network, XRP, Sui


This Week in Crypto Games: Ubisoft’s ‘Might & Magic’, ‘Peaky Blinders’ in Development
Adoption
Is 8% Of Bitcoin Owned By Institutions A Threat To Its Future?
Published
2 days agoon
April 26, 2025By
admin
Institutional ownership of Bitcoin has surged over the past year, with around 8% of the total supply already in the hands of major entities, and that number is still climbing. ETFs, publicly listed companies, and even nation-states have begun securing substantial positions. This raises important questions for investors. Is this growing institutional presence a good thing for Bitcoin? And as more BTC becomes locked up in cold wallets, treasury holdings, and ETFs, is our on-chain data losing its reliability? In this analysis, we dig into the numbers, trace the capital flows, and explore whether Bitcoin’s decentralized ethos is truly at risk or simply evolving.
The New Whales
Let’s start with the Treasury of Public Listed Companies table. Major companies, including Strategy, MetaPlanet, and others, have collectively accumulated more than 700,000 BTC. Considering that Bitcoin’s total hard-capped supply is 21 million, this represents roughly 3.33% of all BTC that will ever exist. While that supply ceiling won’t be reached in our lifetimes, the implications are clear: the institutions are making long-term bets.

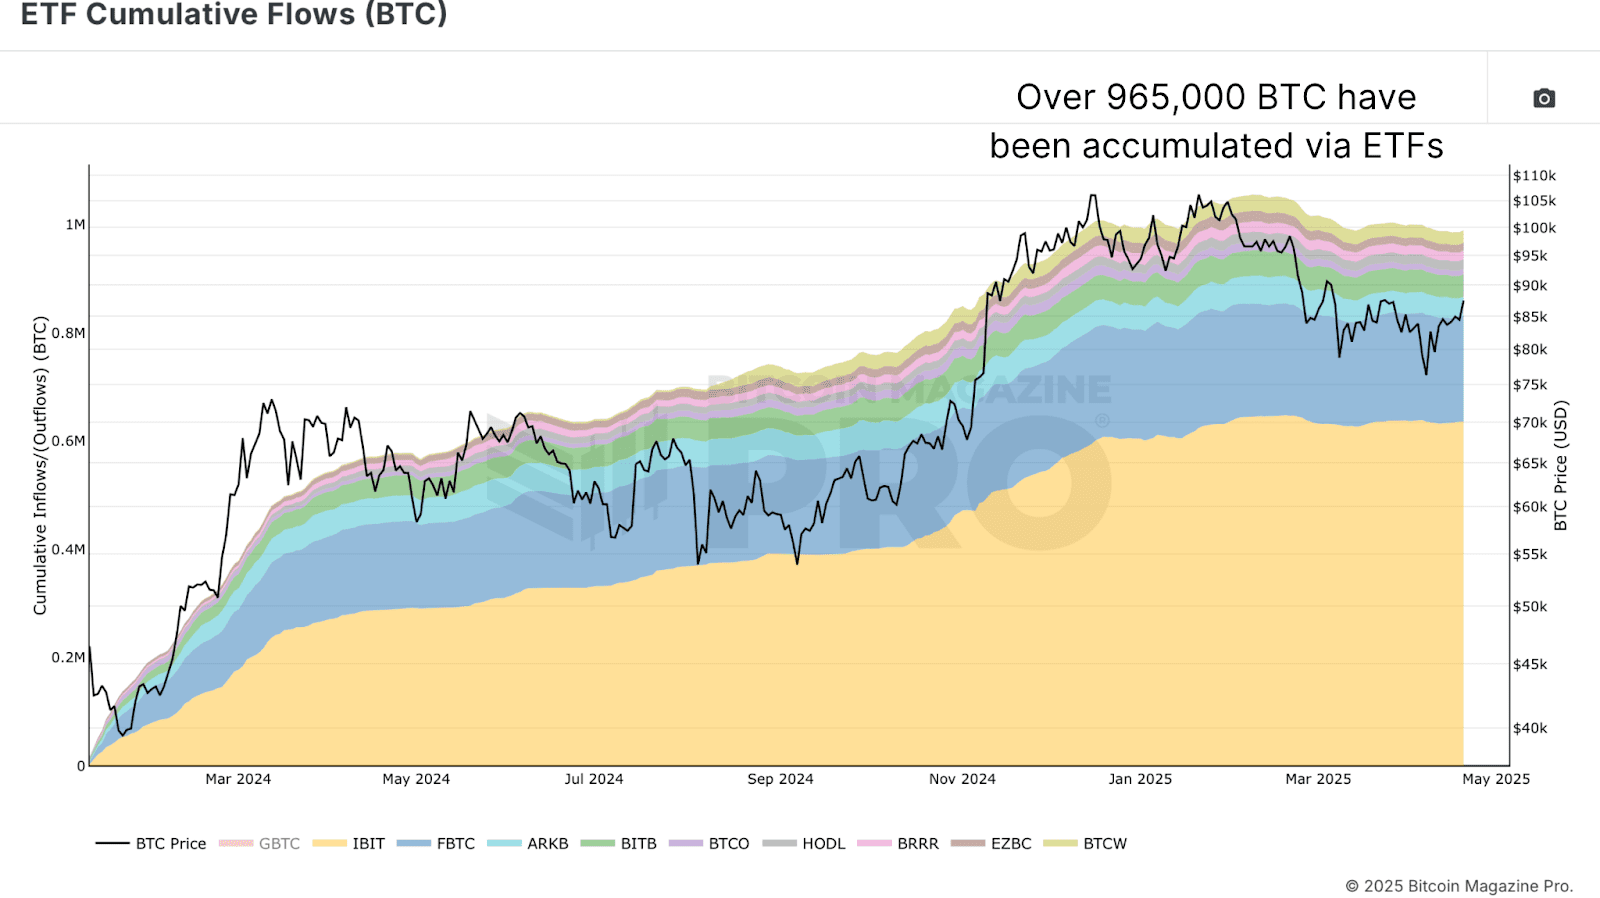
In addition to direct corporate holdings, we can see from the EFT Cumulative Flows (BTC) chart that ETFs now control a significant slice of the market as well. At the time of writing, spot Bitcoin ETFs hold approximately 965,000 BTC, just under 5% of the total supply. That figure fluctuates slightly but remains a major force in daily market dynamics. When we combine corporate treasuries and ETF holdings, the number climbs to over 1.67 million BTC, or roughly 8% of the total theoretical supply. But the story doesn’t stop there.
Beyond Wall Street and Silicon Valley, some governments are now active players in the Bitcoin space. Through sovereign purchases and reserves under initiatives like the Strategic Bitcoin Reserve, nation-states collectively hold approximately 542,000 BTC. Add that to the previous institutional holdings, and we arrive at over 2.2 million BTC in the hands of institutions, ETFs, and governments. On the surface, that’s about 10.14% of the total 21 million BTC supply.
Forgotten Satoshis and Lost Supply
Not all 21 million BTC are actually accessible. Estimates based on 10+ Years HODL Wave data, a measurement of coins that haven’t moved in a decade, suggest that over 3.4 million BTC are likely lost forever. This includes Satoshi’s wallets, early mining-era coins, forgotten phrases, and yes, even USBs in landfills.
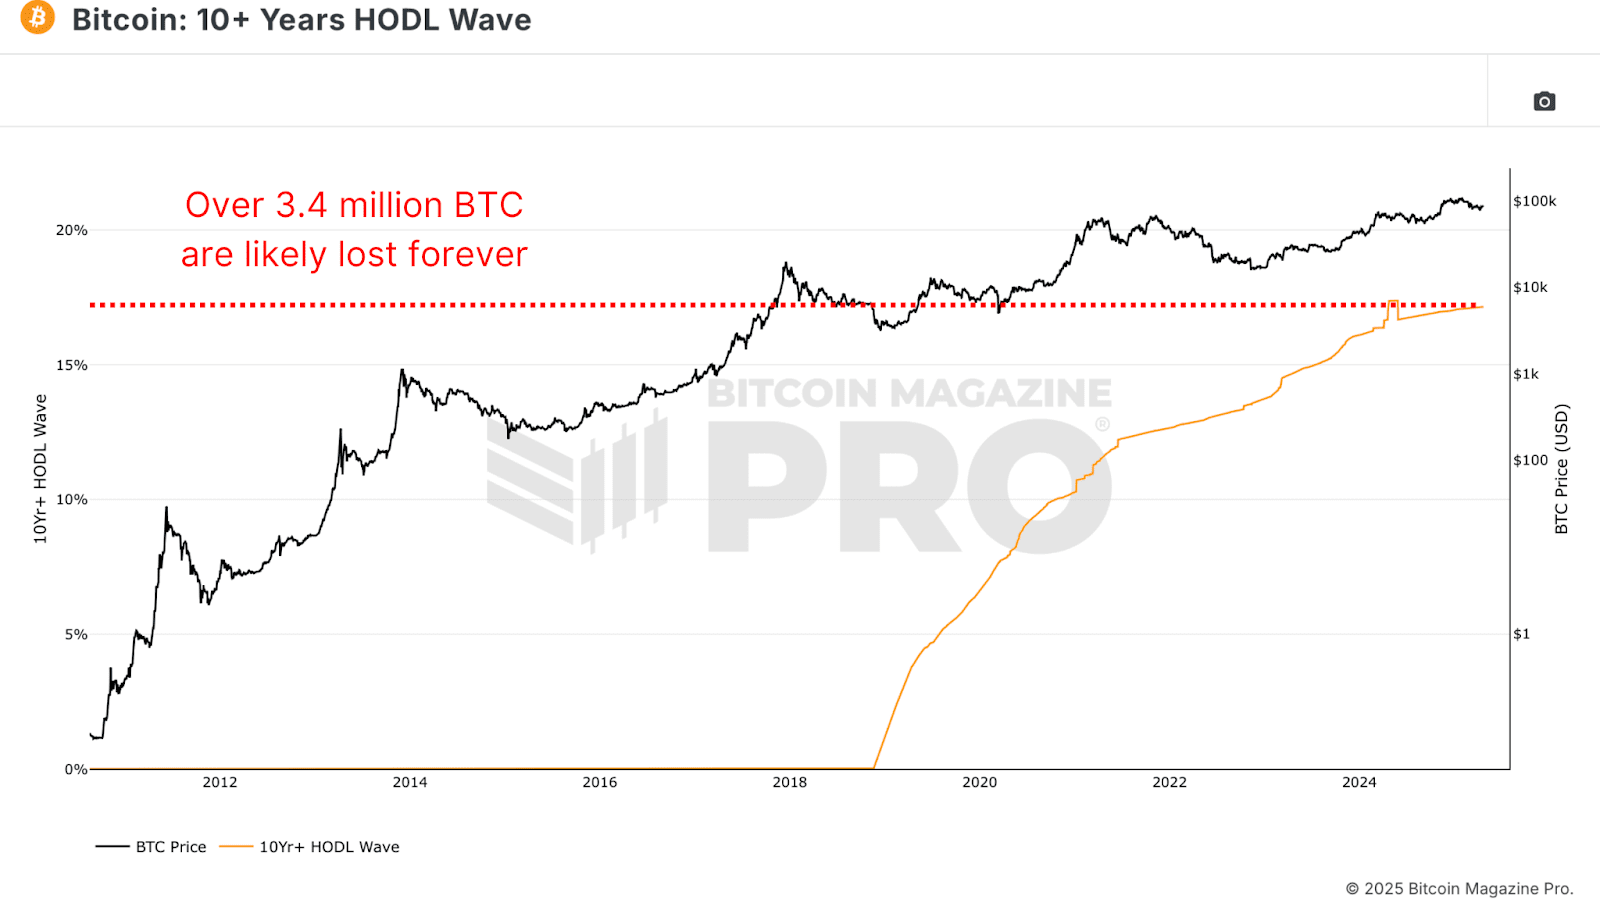
With approximately 19.8 million BTC currently in circulation and roughly 17.15% presumed to be lost, the effective supply is closer to 16.45 million BTC. That radically changes the equation. When measured against this more realistic supply, the percentage of BTC held by institutions rises to roughly 13.44%. This means that approximately one in every 7.4 BTC available to the market is already locked up by institutions, ETFs, or sovereigns.
Are Institutions Controlling Bitcoin?
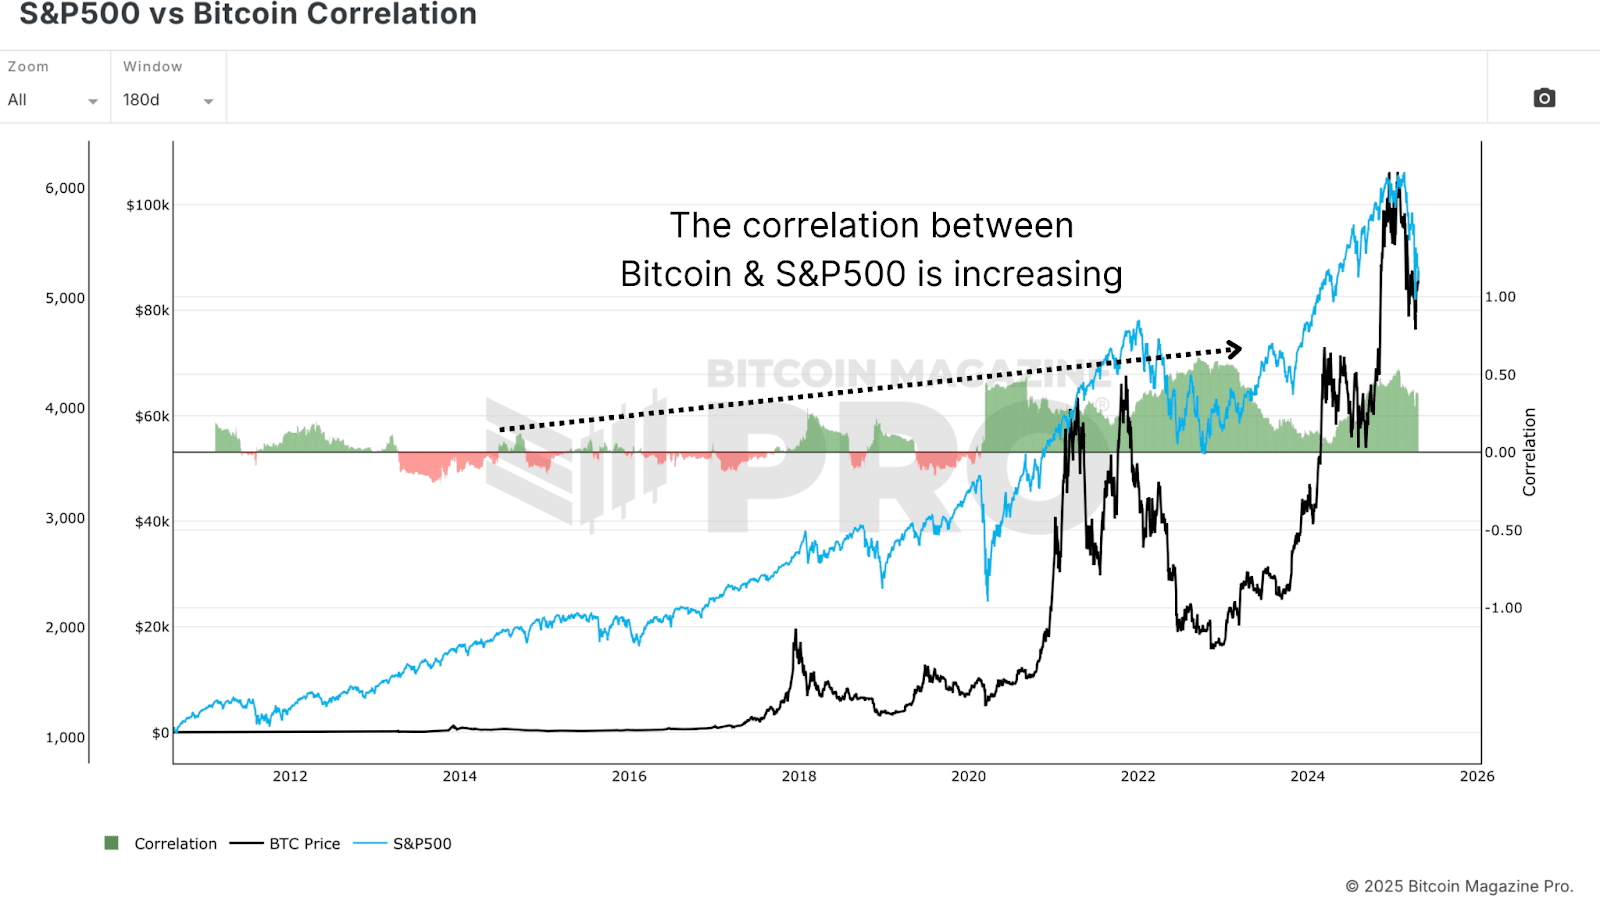
Does this mean Bitcoin is being controlled by corporations? Not yet. But it does signal a growing influence, especially in price behavior. From the S&P 500 vs Bitcoin Correlation chart, it is evident that the correlation between Bitcoin and traditional equity indexes like the S&P 500 or Nasdaq has tightened significantly. As these large entities enter the market, BTC is increasingly viewed as a “risk-on” asset, meaning its price tends to rise and fall with broader investor sentiment in traditional markets.
This can be beneficial in bull markets. When global liquidity expands and risk assets perform well, Bitcoin now stands to attract larger inflows than ever before, especially as pensions, hedge funds, and sovereign wealth funds begin allocating even a small percentage of their portfolios. But there’s a trade-off. As institutional adoption deepens, Bitcoin becomes more sensitive to macroeconomic conditions. Central bank policy, bond yields, and equity volatility all start to matter more than they once did.
Despite these shifts, more than 85% of Bitcoin remains outside institutional hands. Retail investors still hold the overwhelming majority of the supply. And while ETFs and company treasuries may hoard large amounts in cold storage, the market remains broadly decentralized. Critics argue that on-chain data is becoming less useful. After all, if so much BTC is locked up in ETFs or dormant wallets, can we still draw accurate conclusions from wallet activity? This concern is valid, but not new.
Need to Adapt
Historically, much of Bitcoin’s trading activity has occurred off-chain, particularly on centralized exchanges like Coinbase, Binance, and (once upon a time) FTX. These trades rarely appeared on-chain in meaningful ways but still influenced price and market structure. Today, we face a similar situation, only with better tools. ETF flows, corporate filings, and even nation-state purchases are subject to disclosure regulations. Unlike opaque exchanges, these institutional players often must disclose their holdings, providing analysts with a wealth of data to track.
Moreover, on-chain analytics isn’t static. Tools like the MVRV-Z score are evolving. By narrowing the focus, say, to an MVRV Z-Score 2YR Rolling average instead of full historical data, we can better capture current market dynamics without the distortion of long-lost coins or inactive supply.

Conclusion
To wrap it up, institutional interest in Bitcoin has never been higher. Between ETFs, corporate treasuries, and sovereign entities, over 2.2 million BTC are already spoken for, and that number is growing. This flood of capital has undoubtedly had a stabilizing effect on price during periods of market weakness. However, with that stability comes entanglement. Bitcoin is becoming more tied to traditional financial systems, increasing its correlation to equities and broader economic sentiment.
Yet this does not spell doom for Bitcoin’s decentralization or the relevance of on-chain analytics. In fact, as more BTC is held by identifiable institutions, the ability to track flows becomes even more precise. The retail footprint remains dominant, and our tools are becoming smarter and more responsive to market evolution. Bitcoin’s ethos of decentralization isn’t at risk; it’s just maturing. And as long as our analytical frameworks evolve alongside the asset, we’ll be well-equipped to navigate whatever comes next.
For more deep-dive research, technical indicators, real-time market alerts, and access to a growing community of analysts, visit BitcoinMagazinePro.com.

Disclaimer: This article is for informational purposes only and should not be considered financial advice. Always do your own research before making any investment decisions.
Source link

Bitcoin’s 2025 journey hasn’t delivered the explosive bull market surge many expected. After peaking above $100,000, the 2025 Bitcoin price retraced sharply to as low as $75,000, sparking debate among investors and analysts about where we stand in the Bitcoin cycle. In this analysis, we cut through the noise, leveraging on-chain indicators and macro data to determine if the Bitcoin bull market remains intact or if a deeper Bitcoin correction looms in Q3 2025. Key metrics like MVRV Z-Score, Value Days Destroyed (VDD), and Bitcoin capital flows provide critical insights into the market’s next move.
Is Bitcoin’s 2025 Pullback Healthy or Bull Cycle End?
A strong starting point for assessing the 2025 Bitcoin cycle is the MVRV Z-Score, a trusted on-chain indicator that compares market value to realized value. After hitting 3.36 at Bitcoin’s $100,000 peak, the MVRV Z-Score dropped to 1.43, aligning with the 2025 Bitcoin price decline from $100,000 to $75,000. This 30% Bitcoin correction may seem alarming, but recent data shows the MVRV Z-Score rebounding from its 2025 low of 1.43.
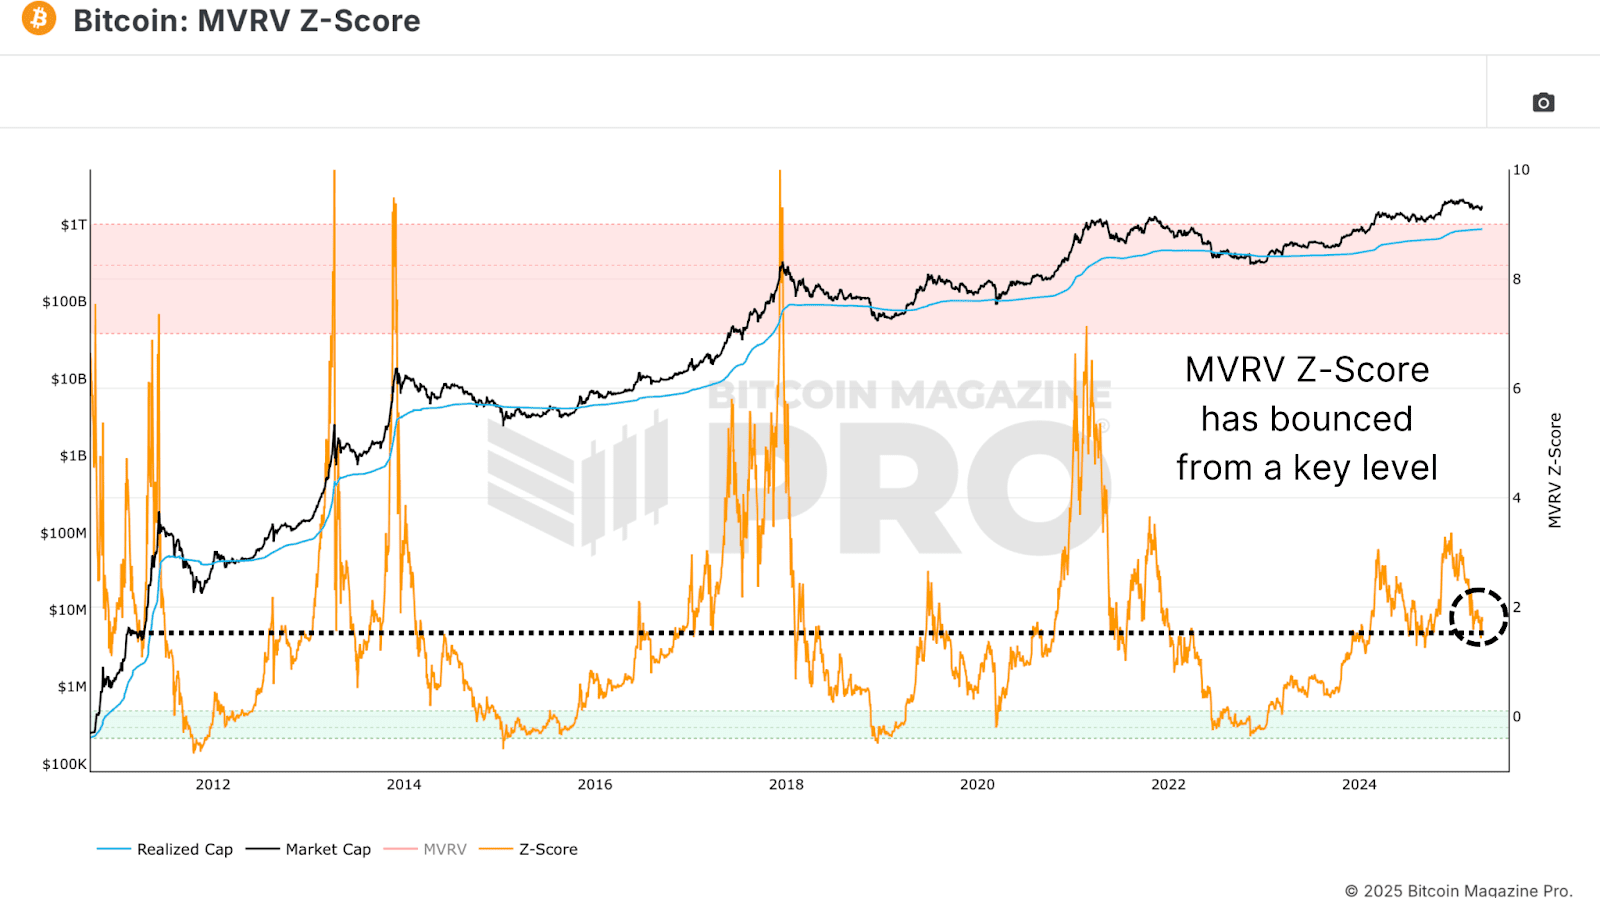
Historically, MVRV Z-Score levels around 1.43 have marked local bottoms, not tops, in prior Bitcoin bull markets (e.g., 2017 and 2021). These Bitcoin pullbacks often preceded resumed uptrends, suggesting the current correction aligns with healthy bull cycle dynamics. While investor confidence is shaken, this move fits historical patterns of Bitcoin market cycles.
How Smart Money Shapes the 2025 Bitcoin Bull Market
The Value Days Destroyed (VDD) Multiple, another critical on-chain indicator, tracks the velocity of BTC transactions weighted by holding periods. Spikes in VDD signal profit-taking by experienced holders, while low levels indicate Bitcoin accumulation. Currently, VDD is in the “green zone,” mirroring levels seen in late bear markets or early bull market recoveries.

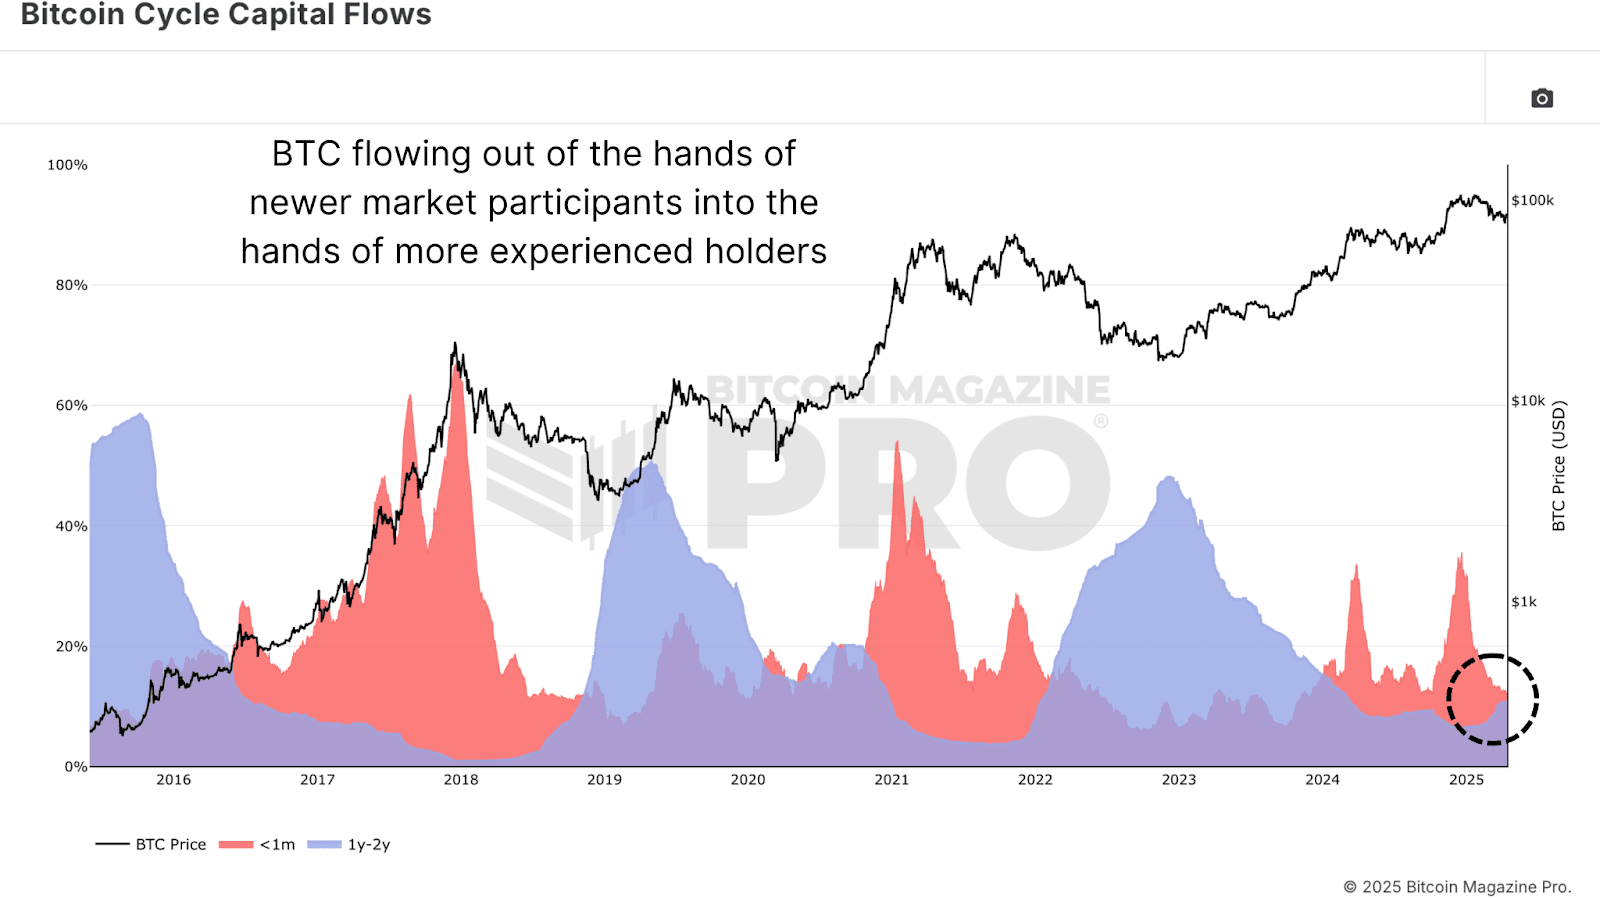
Following Bitcoin’s reversal from $100,000, the low VDD suggests the end of a profit-taking phase, with long-term holders accumulating in anticipation of higher 2025 Bitcoin prices. The Bitcoin Cycle Capital Flows chart further illuminates this trend, breaking down realized capital by coin age. Near the $106,000 peak, new market entrants (<1 month) drove a spike in activity, signaling FOMO-driven buying. Since the Bitcoin pullback, this group’s activity has cooled to levels typical of early-to-mid bull markets.
In contrast, the 1–2 year cohort—often macro-savvy Bitcoin investors—is increasing activity, accumulating at lower prices. This shift mirrors Bitcoin accumulation patterns from 2020 and 2021, where long-term holders bought during dips, setting the stage for bull cycle rallies.
Where Are We in the 2025 Bitcoin Market Cycle?
Zooming out, the Bitcoin market cycle can be divided into three phases:
- Bear phase: Deep Bitcoin corrections of 70–90%.
- Recovery phase: Reclaiming prior all-time highs.
- Bull/exponential phase: Parabolic Bitcoin price advances.
Past bear markets (2015, 2018) lasted 13–14 months, and the most recent Bitcoin bear market followed suit at 14 months. Recovery phases typically span 23–26 months, and the current 2025 Bitcoin cycle falls within this range. However, unlike past bull markets, Bitcoin’s breakout above previous highs was followed by a pullback rather than an immediate surge.
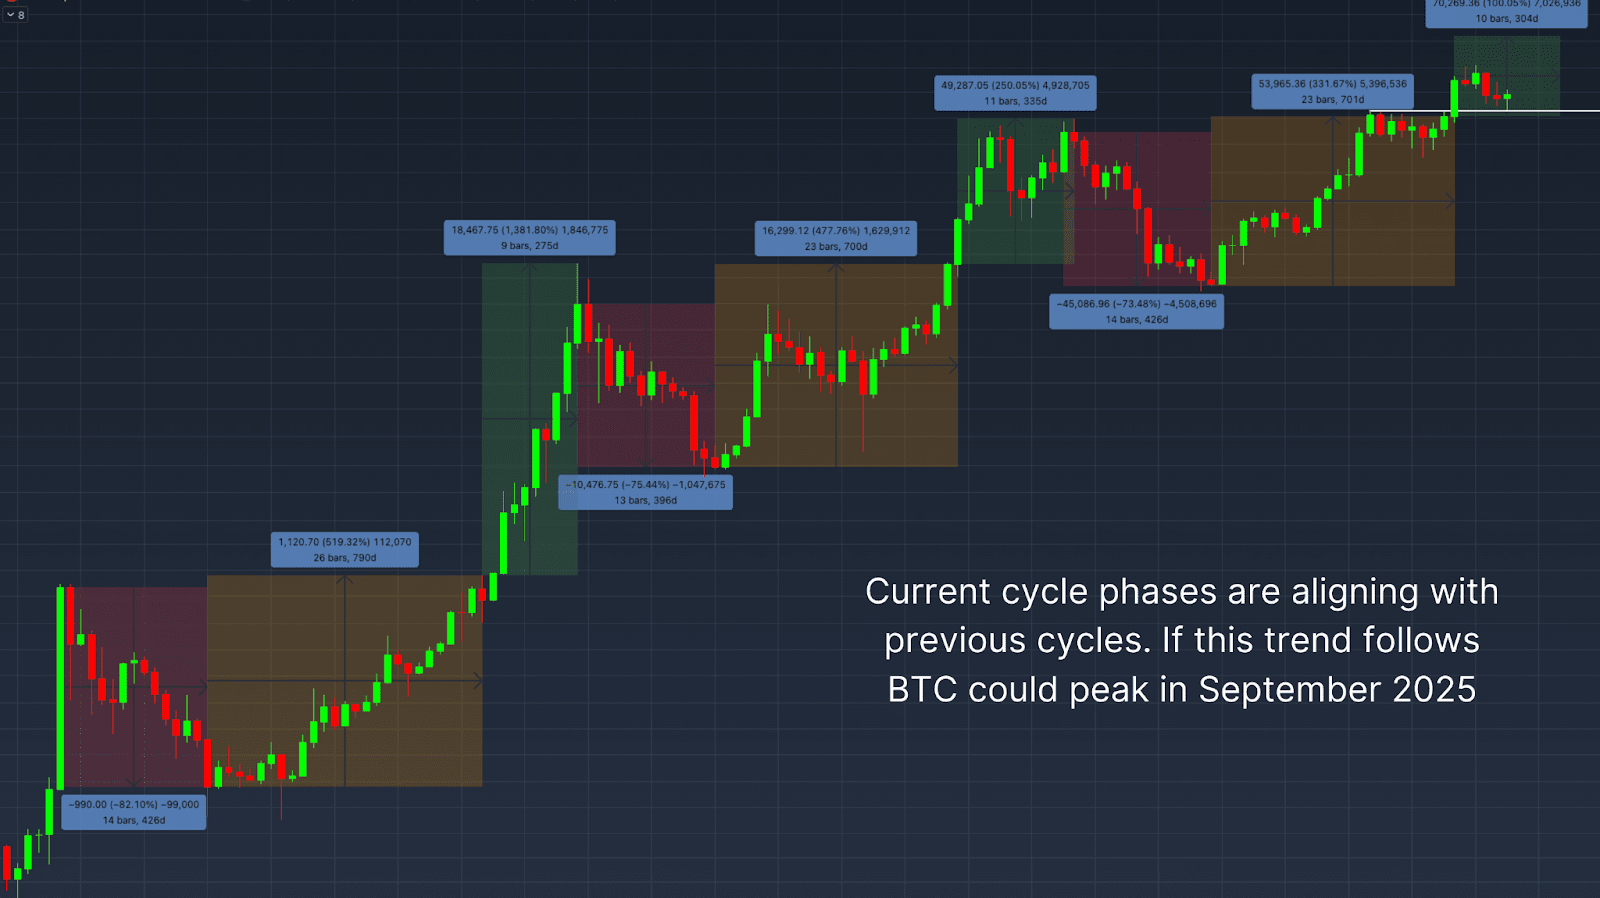
This Bitcoin pullback may signal a higher low, setting up the exponential phase of the 2025 bull market. Based on past cycles’ 9–11-month exponential phases, the Bitcoin price could peak around September 2025, assuming the bull cycle resumes.
Macro Risks Impacting Bitcoin Price in Q3 2025
Despite bullish on-chain indicators, macro headwinds pose risks to the 2025 Bitcoin price. The S&P 500 vs. Bitcoin Correlation chart shows Bitcoin remains tightly linked to U.S. equities. With fears of a global recession growing, weakness in traditional markets could cap Bitcoin’s near-term rally potential.

Monitoring these macro risks is crucial, as a deteriorating equity market could trigger a deeper Bitcoin correction in Q3 2025, even if on-chain data remains supportive.
Conclusion: Bitcoin’s Q3 2025 Outlook
Key on-chain indicators—MVRV Z-Score, Value Days Destroyed, and Bitcoin Cycle Capital Flows—point to healthy, cycle-consistent behavior and long-term holder accumulation in the 2025 Bitcoin cycle. While slower and uneven compared to past bull markets, the current cycle aligns with historical Bitcoin market cycle structures. If macro conditions stabilize, Bitcoin appears poised for another leg up, potentially peaking in Q3 or Q4 2025.
However, macro risks, including equity market volatility and recession fears, remain critical to watch. For a deeper dive, check out this YouTube video: Where We Are In This Bitcoin Cycle.
For more deep-dive research, technical indicators, real-time market alerts, and access to a growing community of analysts, visit BitcoinMagazinePro.com.

Disclaimer: This article is for informational purposes only and should not be considered financial advice. Always do your own research before making any investment decisions.
Source link
Bitcoin
How Expanding Global Liquidity Could Drive Bitcoin Price To New All-Time Highs
Published
2 weeks agoon
April 16, 2025By
admin
Bitcoin’s price trajectory is once again capturing headlines, and this time the catalyst appears to be global liquidity trends reshaping investor sentiment. In a recent comprehensive breakdown, Matt Crosby, Lead Analyst at Bitcoin Magazine Pro, presents compelling evidence tying the digital asset’s renewed bullish momentum to the expanding global M2 money supply. His insights not only illuminate the future of Bitcoin price but also anchor its macroeconomic relevance in a broader financial context.
Bitcoin Price and Global Liquidity: A High-Impact Correlation
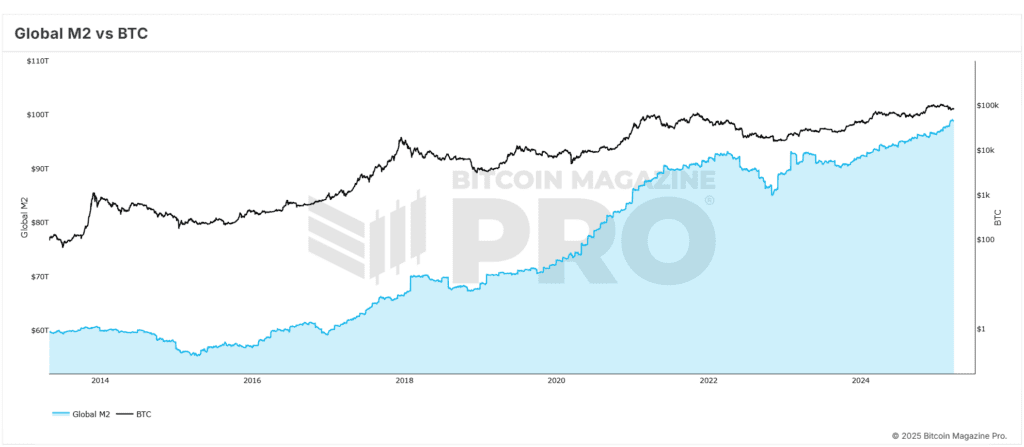
Crosby highlights a remarkable and consistent correlation—often exceeding 84%—between Bitcoin price and global M2 liquidity levels. As liquidity increases across the global economy, Bitcoin price typically responds with upward movement, although with a noticeable delay. Historical data supports the observation of a 56–60 day lag between monetary expansion and Bitcoin price increases.
This insight has recently proven accurate, as Bitcoin price rebounded from lows of $75,000 to above $85,000. This trend closely aligns with the forecasted recovery that Crosby and his team had outlined based on macro indicators, validating the strength and reliability of the correlation driving Bitcoin price upward.
Why the 2-Month Delay Impacts Bitcoin Price
The two-month delay in market response is a critical observation for understanding Bitcoin price movements. Crosby emphasizes that monetary policy and liquidity injections do not immediately affect speculative assets like BTC. Instead, there is an incubation period, typically around two months, during which liquidity filters through financial systems and begins to influence Bitcoin price.
Crosby has optimized this correlation through various backtests, adjusting timeframes and offsets. Their findings indicate that a 60-day delay yields the most predictive accuracy across both short-term (1-year) and extended (4-year) historical Bitcoin price action. This lag provides a strategic advantage to investors who monitor macro trends to anticipate Bitcoin price surges.
S&P 500 and Its Influence on Bitcoin Price Trends
Adding further credibility to the thesis, Crosby extends his analysis to traditional equity markets. The S&P 500 exhibits an even stronger all-time correlation of approximately 92% with global liquidity. This correlation strengthens the argument that monetary expansion is a significant driver not just for Bitcoin price, but also for broader risk-on asset classes.
By comparing liquidity trends with multiple indices, Crosby demonstrates that Bitcoin price is not an anomaly but part of a broader systemic pattern. When liquidity rises, equities and digital assets alike tend to benefit, making M2 supply an essential indicator for timing Bitcoin price movements.
Forecasting Bitcoin Price to $108,000 by June 2025
To build a forward-looking perspective, Crosby employs historical fractals from previous bull markets to project future Bitcoin price movements. When these patterns are overlaid with current macro data, the model points to a scenario where Bitcoin price could retest and potentially surpass its all-time highs, targeting $108,000 by June 2025.
This optimistic projection for Bitcoin price hinges on the assumption that global liquidity continues its upward trajectory. The Federal Reserve’s recent statements suggest that further monetary stimulus could be deployed if market stability falters—another tailwind for Bitcoin price growth.
The Rate of Expansion Affects Bitcoin Price
While rising liquidity levels are significant, Crosby stresses the importance of monitoring the rate of liquidity expansion to predict Bitcoin price trends. The year-on-year M2 growth rate offers a more nuanced view of macroeconomic momentum. Although liquidity has generally increased, the pace of expansion had slowed temporarily before resuming an upward trend in recent months.

This trend is strikingly similar to conditions observed in early 2017, just before Bitcoin price entered an exponential growth phase. The parallels reinforce Crosby’s bullish outlook on Bitcoin price and emphasize the importance of dynamic, rather than static, macro analysis.
Final Thoughts: Preparing for the Next Bitcoin Price Phase
While potential risks such as a global recession or a significant equity market correction persist, current macro indicators point toward a favorable environment for Bitcoin price. Crosby’s data-driven approach offers investors a strategic lens to interpret and navigate the market.
For those looking to make informed decisions in a volatile environment, these insights provide actionable intelligence grounded in economic fundamentals to capitalize on Bitcoin price opportunities.
For more deep-dive research, technical indicators, real-time market alerts, and access to a growing community of analysts, visit BitcoinMagazinePro.com.

Disclaimer: This article is for informational purposes only and should not be considered financial advice. Always do your own research before making any investment decisions.
Source link

Stripe Tests New Stablecoin Project as $3.7T Market Looms

Falling Wedge Pattern Confirms $264 target
Dogecoin Confirms Daily Trend Reversal With Breakout, Retest, And New Uptrend

Ethereum community members propose new fee structure for the app layer

Crypto Investors Sue Nike, Accuse Apparel Giant of Rug Pull After Abrupt Closure of Metaverse Business: Report

Top cryptocurrencies to watch: Pi Network, XRP, Sui

This Week in Crypto Games: Ubisoft’s ‘Might & Magic’, ‘Peaky Blinders’ in Development

Why Arbitrum-Nvidia Partnership Collapsed – And What It Means for Web3

Tariff Carnage Starting to Fulfill BTC’s ‘Store of Value’ Promise

The cost of innovation — Regulations are Web3’s greatest asset

Best Crypto to Buy as Derivatives Exchange CME Set to Launch XRP Futures

Metaplanet Buys Additional ¥1.92 Billion Worth Of Bitcoin

Here Are Four Signs the Stock Market Has Bottomed, According to Fundstrat’s Tom Lee

Bitcoin dips below $94,000 as ETFs record $3b weekly inflow

Bitcoin Post-Halving Price Performance Is the Worst on Record. Why?

Arthur Hayes, Murad’s Prediction For Meme Coins, AI & DeFi Coins For 2025

Expert Sees Bitcoin Dipping To $50K While Bullish Signs Persist

3 Voting Polls Show Why Ripple’s XRP Price Could Hit $10 Soon

Aptos Leverages Chainlink To Enhance Scalability and Data Access

Bitcoin Could Rally to $80,000 on the Eve of US Elections

Crypto’s Big Trump Gamble Is Risky

Institutional Investors Go All In on Crypto as 57% Plan to Boost Allocations as Bull Run Heats Up, Sygnum Survey Reveals

The Future of Bitcoin: Scaling, Institutional Adoption, and Strategic Reserves with Rich Rines

Sonic Now ‘Golden Standard’ of Layer-2s After Scaling Transactions to 16,000+ per Second, Says Andre Cronje

Ripple-SEC Case Ends, But These 3 Rivals Could Jump 500x

Has The Bitcoin Price Already Peaked?

A16z-backed Espresso announces mainnet launch of core product

Xmas Altcoin Rally Insights by BNM Agent I

Blockchain groups challenge new broker reporting rule

I’m Grateful for Trump’s Embrace of Bitcoin
Trending

 24/7 Cryptocurrency News6 months ago
Arthur Hayes, Murad’s Prediction For Meme Coins, AI & DeFi Coins For 2025

 Bitcoin3 months ago
Expert Sees Bitcoin Dipping To $50K While Bullish Signs Persist

 Ripple Price1 month ago
3 Voting Polls Show Why Ripple’s XRP Price Could Hit $10 Soon

 24/7 Cryptocurrency News4 months ago
Aptos Leverages Chainlink To Enhance Scalability and Data Access

 Bitcoin6 months ago
Bitcoin Could Rally to $80,000 on the Eve of US Elections

 Opinion6 months ago
Crypto’s Big Trump Gamble Is Risky

 Bitcoin5 months ago
Institutional Investors Go All In on Crypto as 57% Plan to Boost Allocations as Bull Run Heats Up, Sygnum Survey Reveals

 Altcoins3 months ago
Sonic Now ‘Golden Standard’ of Layer-2s After Scaling Transactions to 16,000+ per Second, Says Andre Cronje


