Bitcoin Magazine Pro
The Bitcoin Report: Parabolic Growth Predicted for Q4 2024
Published
3 months agoon
By
admin
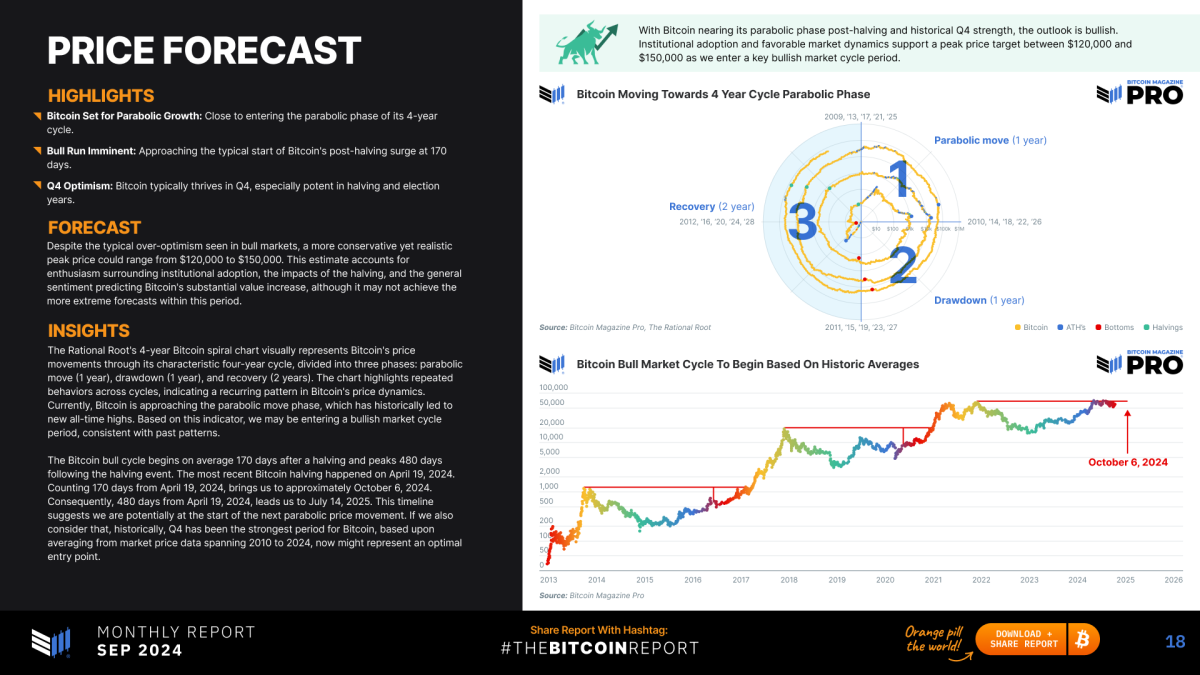
As we enter Q4, a period historically known for strong Bitcoin performance, the latest edition of The Bitcoin Report from Bitcoin Magazine Pro delivers essential insights into the evolving market dynamics of Bitcoin. With a blend of quantitative on-chain data, technical analysis, and macroeconomic perspectives, this report offers a comprehensive look at Bitcoin’s positioning, highlighting critical opportunities and challenges for both investors and market participants.
Key Highlights from the Report:
- Historical Q4 Performance: Bitcoin has averaged a 23.3% return in Q4, showing a strong seasonal trend toward bullish performance.
- Breaking Significant Resistance: Recent technical analysis points to Bitcoin breaking through key resistance levels, potentially setting the stage for parabolic growth.
- Derivatives Market Momentum: The derivatives market shows renewed momentum, with rising open interest and reduced leverage across major exchanges.
- Mining Profitability Recovery: Mining profitability has rebounded, with hash price reaching a two-month high, signaling a strengthening of Bitcoin’s underlying fundamentals.
- Institutional Accumulation: In September, U.S. Bitcoin ETFs purchased 17,941 Bitcoins—32.9% more than the 13,500 new Bitcoins mined during the same period, indicating significant institutional demand.

This 21-page report is built on a solid foundation of on-chain metrics, technical analysis, and macroeconomic factors. It provides an in-depth examination of Bitcoin’s recent market developments, including trends like institutional accumulation and mining profitability recovery. With Q4 historically delivering strong returns for Bitcoin, the report highlights how macroeconomic factors—such as potential Federal Reserve rate cuts and liquidity injections from the People’s Bank of China—could act as catalysts for Bitcoin’s continued growth. In a low-leverage environment within derivatives markets, these monetary policies may spark a new Bitcoin rally.
Expert Analysis and Insights
Featuring exclusive commentary and insights from leading industry figures like Lyn Alden, The Rational Root, and Julian Liniger, this second monthly edition of The Bitcoin Report is a must-read for both investors and enthusiasts.

The analytical rigor presented in this edition is further enriched by the perspectives of thought leaders such as Philip Swift, Pete Rizzo, Dr. Michael Tabone, Dr. Demelza Hays, Patrick Heusser, Lucas Betschart, Lukas Pfeiffer, Pascal Hugli, and Joël Kai Lenz. Their insights cover a spectrum of issues including macroeconomic policy implications, sector-specific developments, and technical indicators. By leveraging the collective expertise of leading analysts, The Bitcoin Report delivers an unparalleled breadth of analysis, from micro-level on-chain behaviors to macro-level geopolitical and economic drivers influencing Bitcoin’s adoption curve.
Share, Discuss, and Engage
We invite you to read and download the September edition, filled with insights that will keep you ahead in this fast-evolving market. Whether you’re managing portfolios, seeking long-term Bitcoin exposure, or simply staying informed, The Bitcoin Report provides the knowledge you need to stay on top of the trend.
Feel free to share the report’s content, take screenshots, and post on social media using the hashtag #TheBitcoinReport. By tracking these conversations, we can improve future editions and continue delivering high-value content to the Bitcoin community.
Opportunities for Sponsorship and Collaboration
Interested in sponsoring future editions of The Bitcoin Report or exploring joint-publication opportunities? Partner with us to gain exposure in the fast-growing Bitcoin space.
For more information, reach out to Mark Mason at mark.mason@btcmedia.org to discuss how your brand can be part of this exciting initiative.
Source link
You may like


Coinbase (COIN) Stock Could Become Available on Base Chain, According to Creator Jesse Pollak


Anchors Are Evil! Bitcoin Core Is Destroying Bitcoin!


Tether, top crypto exchange to swap $1b USDT to Tron network


Top Altcoins to Buy in 2025 That Could Skyrocket in 60 Days


MicroStrategy Continues Weekly Bitcoin Buying Spree With Another $101 Million


New Pi Cycle Top Prediction Chart Identifies Bitcoin Price Market Peaks with Precision
Bitcoin Magazine Pro
New Pi Cycle Top Prediction Chart Identifies Bitcoin Price Market Peaks with Precision
Published
6 hours agoon
January 6, 2025By
admin

Bitcoin investors and analysts constantly seek innovative tools and indicators to gain a competitive edge in navigating volatile market cycles. A recent addition to this arsenal is the Pi Cycle Top Prediction chart, now available on Bitcoin Magazine Pro. Designed for professional and institutional investors, this chart builds on the widely recognized Pi Cycle Top indicator—a tool that has historically pinpointed Bitcoin’s market cycle peaks with remarkable accuracy.
🚨 NEW FREE CHART ALERT 🚨
Following the amazing feedback we received on our video series:
'Mathematically Predicting the BTC Peak'
We decided to recreate the data we used and provide it in a new and completely FREE indicator:
🔥 Bitcoin Pi Cycle Top Prediction 🔥
This… pic.twitter.com/9DqRWGhhGr
— Bitcoin Magazine Pro (@BitcoinMagPro) January 6, 2025
Understanding the Pi Cycle Top Prediction Indicator
The Pi Cycle Top Prediction chart enhances the concept of its predecessor by projecting future potential crossover points of two key moving averages:
- 111-day Moving Average (111DMA)
- 350-day Moving Average multiplied by two (350DMA x2)
By calculating the rate of change of these two moving averages over the past 14 days, the tool extrapolates their trajectory into the future. This approach provides a predictive estimate of when these two averages will cross, signaling a potential market top.
Historically, the crossover of these moving averages has been closely associated with Bitcoin’s cycle tops. In fact, the original Pi Cycle Top indicator successfully identified Bitcoin’s previous cycle peaks to within three days, both before and after its creation.
Implications for Market Behavior
When the 111DMA approaches the 350DMA x2, it suggests that Bitcoin’s price may be rising unsustainably, often reflecting heightened speculative fervor. A crossover typically signals the end of a bull market, followed by a price correction or bear market.
For professional investors, this tool is invaluable as a risk management mechanism. By identifying periods when market conditions might be overheating, it allows investors to make informed decisions about their exposure to Bitcoin and adjust their strategies accordingly.
Key Prediction: September 17, 2025
The current projection estimates that the moving averages will cross on September 17, 2025. This date represents a potential market top, offering investors a timeline to monitor and reassess their positions as market dynamics evolve. Users can view this projection in detail by hovering over the chart on the Bitcoin Magazine Pro platform.
Origins and Related Tools
The Pi Cycle Top Prediction indicator was conceptualized by Matt Crosby, Lead Analyst at Bitcoin Magazine Pro. It builds on the original Pi Cycle Top indicator, created by Philip Swift, Managing Director of Bitcoin Magazine Pro. Swift’s Pi Cycle Top has become a trusted resource among Bitcoin analysts and investors for its historical accuracy in identifying market peaks.
Investors interested in a deeper exploration of market cycles can also refer to:
- The Original Pi Cycle Top Indicator: View the chart
- The Pi Cycle Top and Bottom Indicator: View the chart
Video Explainer and Educational Resources
For a comprehensive explanation of the Pi Cycle Top Prediction chart, investors can watch a detailed video by Matt Crosby, available here. This video provides an overview of the methodology, practical applications, and historical context for this predictive tool.
Why This Matters for Professional Investors
In a market as dynamic and unpredictable as Bitcoin, professional investors require sophisticated tools to anticipate and respond to significant market shifts. The Pi Cycle Top Prediction chart offers:
- Data-Driven Insights: By leveraging historical data and predictive modeling, the chart delivers actionable insights for portfolio management.
- Timing Precision: The ability to estimate cycle tops with a high degree of accuracy enhances strategic decision-making.
- Risk Mitigation: Early warning signals of market overheating empower investors to protect their portfolios from potential downside risks.
As Bitcoin matures into an asset class increasingly adopted by institutional investors, tools like the Pi Cycle Top Prediction chart become essential for understanding and navigating its unique market cycles. By integrating this chart into their analytical toolkit, investors can deepen their insights and improve their long-term investment outcomes.
To explore live data and stay informed on the latest analysis, visit bitcoinmagazinepro.com.
Disclaimer: This article is for informational purposes only and should not be considered financial advice. Always do your own research before making any investment decisions.
Source link
Bitcoin 2025
2025 Bitcoin Outlook: Insights Backed by Metrics and Market Data
Published
3 days agoon
January 3, 2025By
admin
As we step into 2025, it’s time to take a measured and analytical approach to what the year might hold for Bitcoin. Taking into account on-chain, market cycle, macroeconomic data, and more for confluence, we can go beyond pure speculation to paint a data-driven picture for the coming months.
MVRV Z-Score: Plenty of Upside Potential
The MVRV Z-Score measures the ratio between Bitcoin’s realized price (the average acquisition price of all BTC on the network) and its market cap. Standardizing this ratio for volatility gives us the Z-Score, which historically provides a clear picture of market cycles.
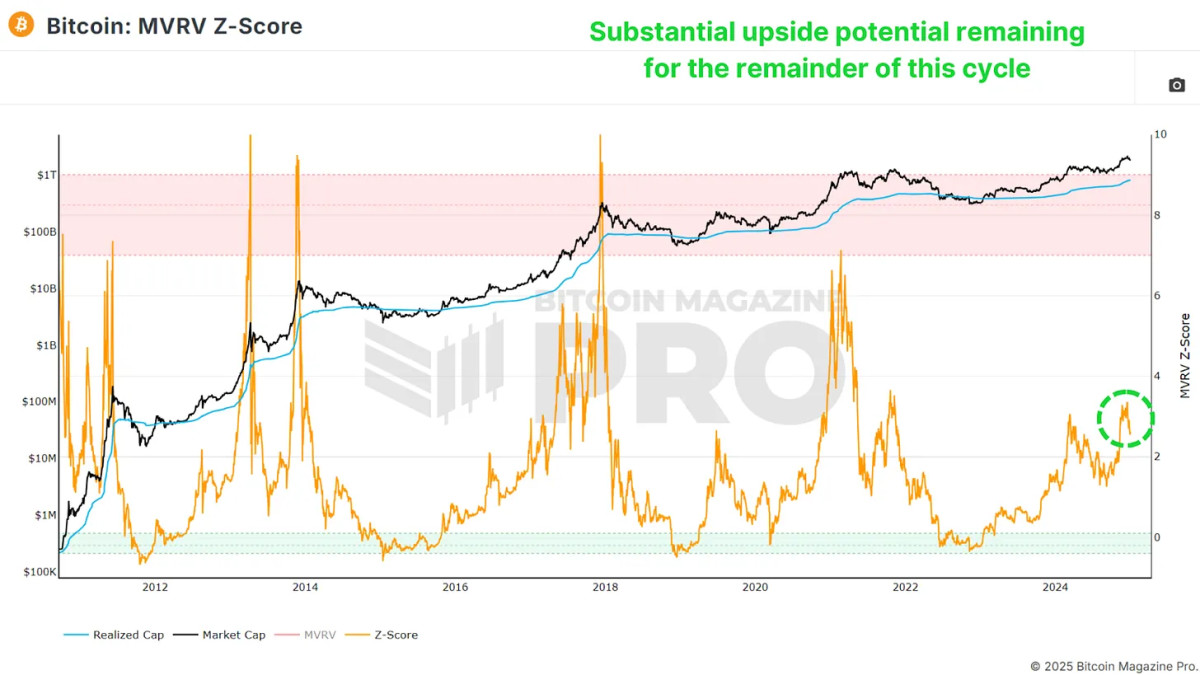
Currently, the MVRV Z-Score suggests we still have significant upside potential. While previous cycles have seen the Z-Score reach values above 7, I believe anything above 6 indicates overextension, prompting a closer look at other metrics to identify a market peak. Presently, we’re hovering at levels comparable to May 2017—when Bitcoin was valued at only a few thousand dollars. Given the historical context, there’s room for multiple hundreds of percent in potential gains from current levels.
The Pi Cycle Oscillator: Bullish Momentum Resumes
Another essential metric is the Pi Cycle Top and Bottom indicator, which tracks the 111-day and 350-day moving averages (the latter multiplied by 2). Historically, when these averages cross, it often signals a Bitcoin price peak within days.
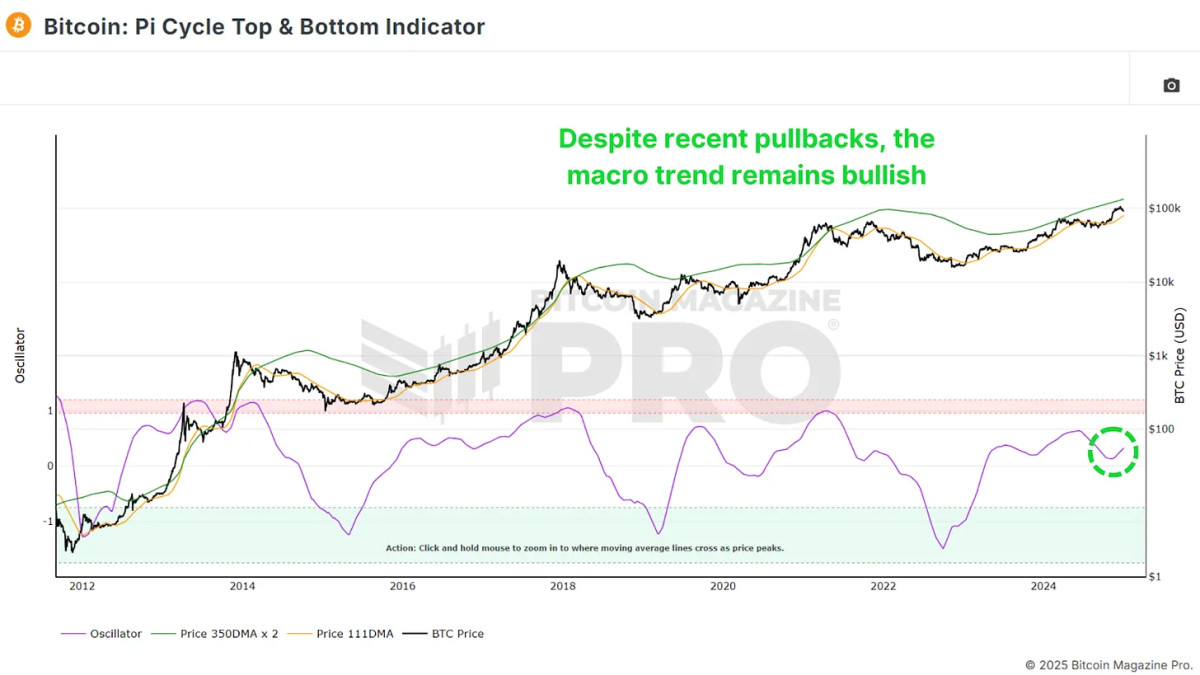
The distance between these two moving averages has started to trend upward again, suggesting renewed bullish momentum. While 2024 saw periods of sideways consolidation, the breakout we’re seeing now indicates that Bitcoin is entering a stronger growth phase, potentially lasting several months.
The Exponential Phase of the Cycle
Looking at Bitcoin’s historical price action, cycles often feature a “post-halving cooldown” lasting 6–12 months before entering an exponential growth phase. Based on previous cycles, we’re nearing this breakout point. While diminishing returns are expected compared to earlier cycles, we could still see substantial gains.
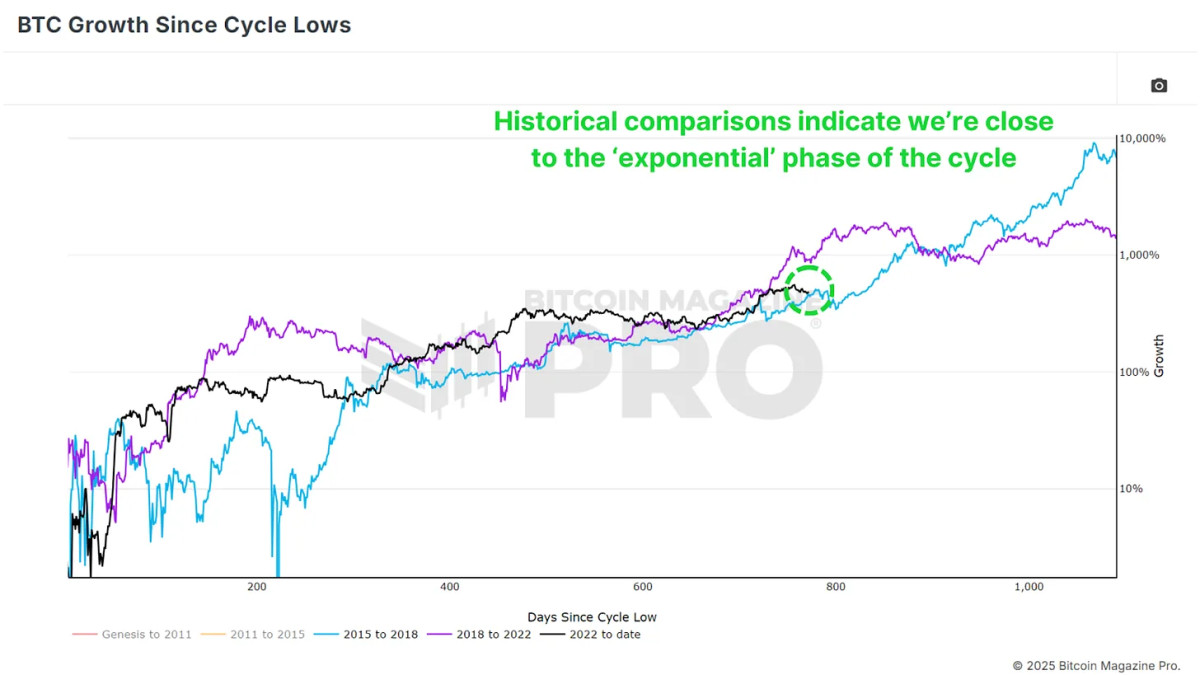
For context, breaking the previous all-time high of $20,000 in the 2020 cycle led to a peak near $70,000—a 3.5x increase. If we see even a conservative 2x or 3x from the last peak of $70,000, Bitcoin could realistically reach $140,000–$210,000 in this cycle.
Macro Factors Supporting BTC in 2025
Despite headwinds in 2024, Bitcoin performed strongly, even in the face of a strengthening U.S. Dollar Index (DXY). Historically, Bitcoin and the DXY move inversely, so any reversal in the DXY’s strength could further fuel Bitcoin’s upside.
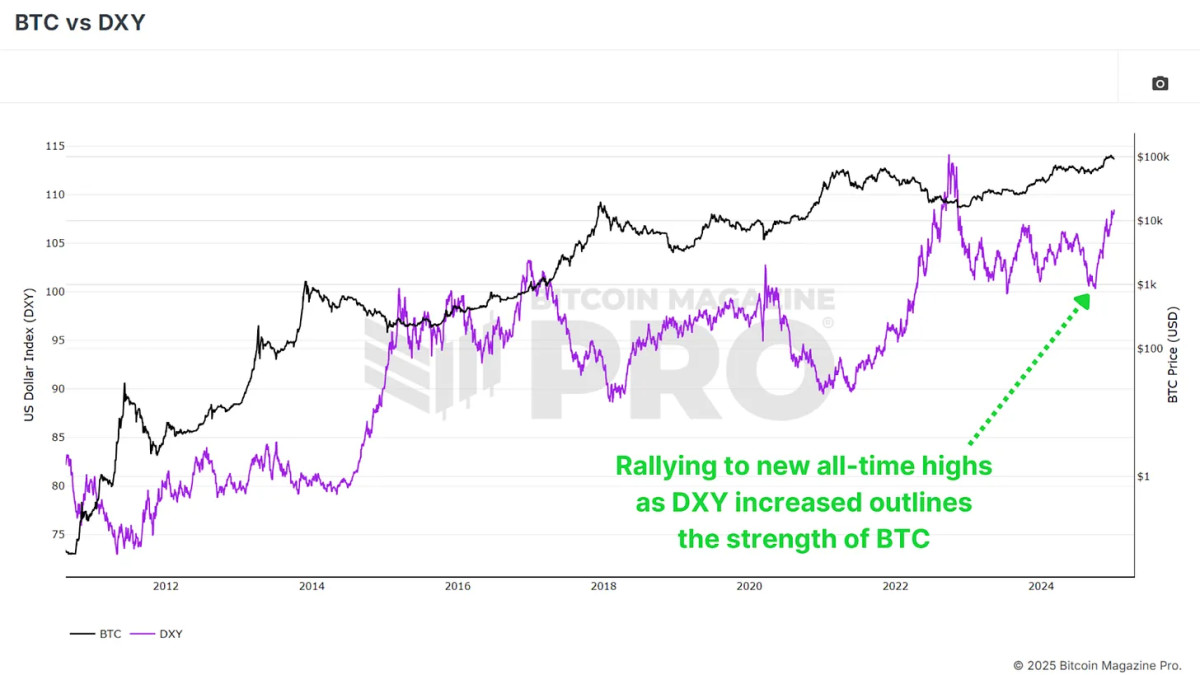
Other macroeconomic indicators, such as high-yield credit cycles and the global M2 money supply, suggest improving conditions for Bitcoin. The contraction in the money supply seen in 2024 is expected to reverse in 2025, setting the stage for an even more favorable environment.
Cycle Master Chart: A Long Way to Go
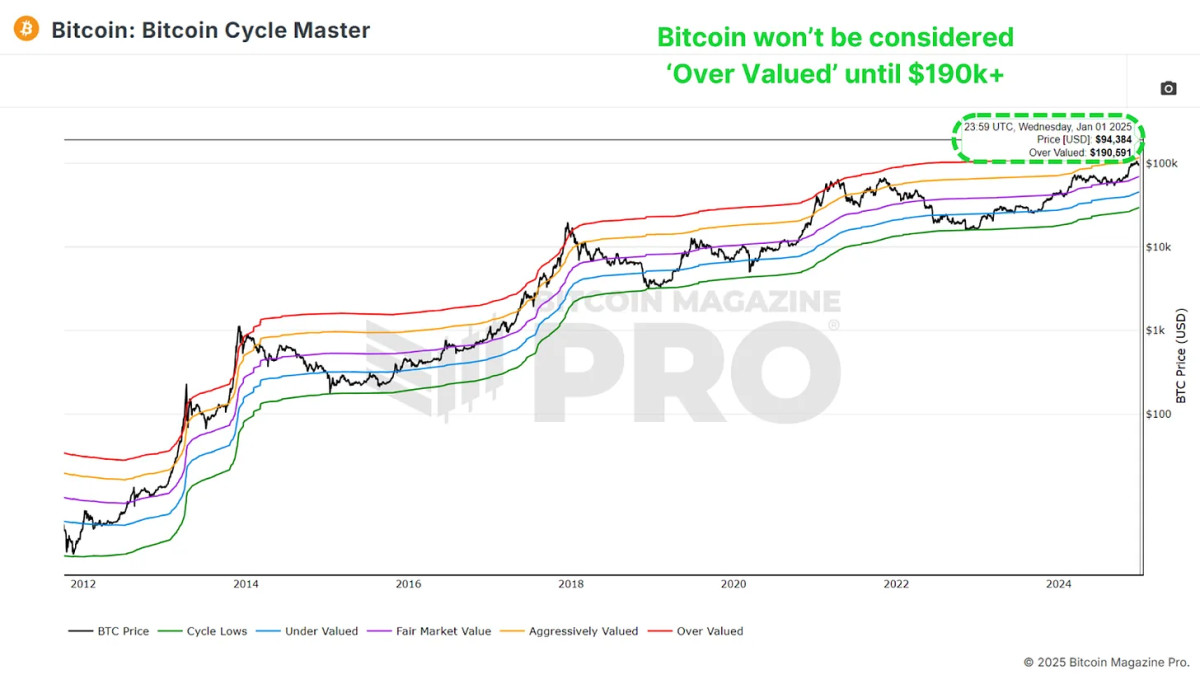
The Bitcoin Cycle Master Chart, which aggregates multiple on-chain valuation metrics, shows that Bitcoin still has considerable room to grow before reaching overvaluation. The upper boundary, currently around $190,000, continues to rise, reinforcing the outlook for sustained upward momentum.
Conclusion
Currently, almost all data points are aligned for a bullish 2025. As always, past performance doesn’t guarantee future results, however the data strongly suggests that Bitcoin’s best days may still lie ahead, even after an incredibly positive 2024.
For a more in-depth look into this topic, check out a recent YouTube video here: Bitcoin 2025 – A Data Driven Outlook
For more detailed Bitcoin analysis and to access advanced features like live charts, personalized indicator alerts, and in-depth industry reports, check out Bitcoin Magazine Pro.
Disclaimer: This article is for informational purposes only and should not be considered financial advice. Always do your own research before making any investment decisions.
Source link
Bitcoin Magazine Pro
How To Buy Bitcoin During Bull Market Dips
Published
1 week agoon
December 27, 2024By
admin
Buying Bitcoin at significantly higher prices than just a few months ago can be daunting. However, with the right strategies, you can buy Bitcoin during dips with a favorable risk-to-reward ratio while riding the bull market.
Confirming Bull Market Conditions
Before accumulating, ensure you’re still in a bull market. The MVRV Z-score helps identify overheated or undervalued conditions by analyzing the deviation between market value and realized value.
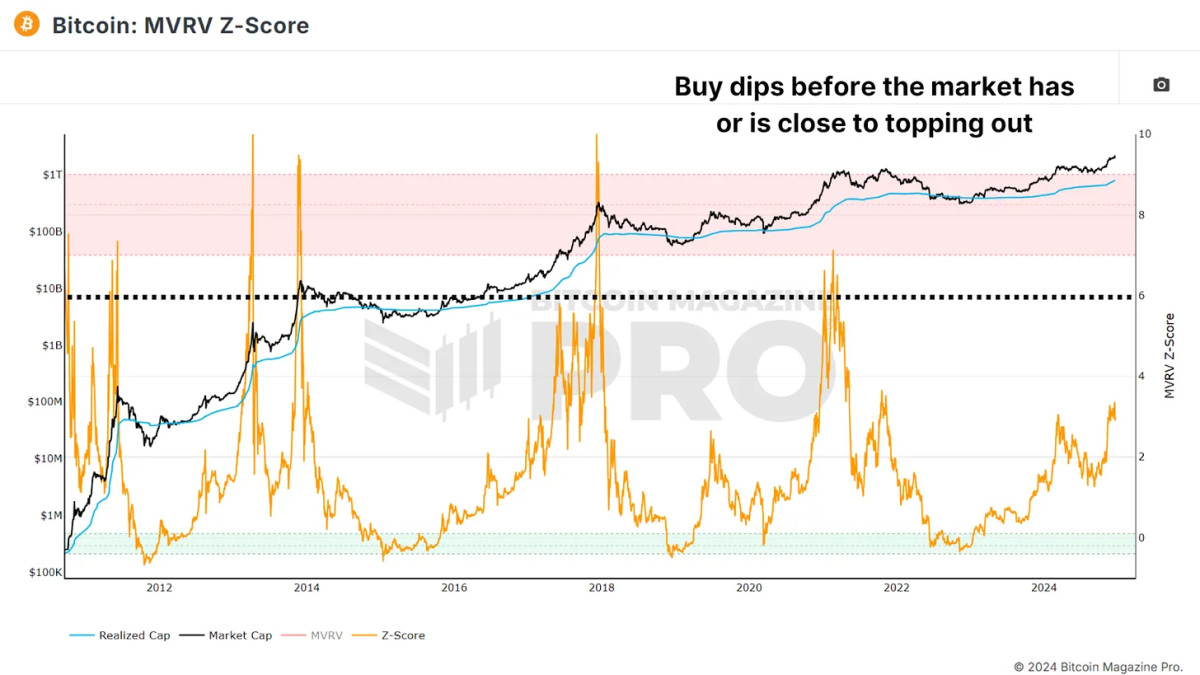
Avoid Buying when the Z-score reaches high values, such as above 6.00, which would indicate the market is overextended and nearing a potential bearish reversal. If the Z-score is below this, dips likely represent opportunities, especially if other indicators align. Don’t accumulate aggressively during a bear market. Focus instead on finding the macro bottom.
Short-Term Holders
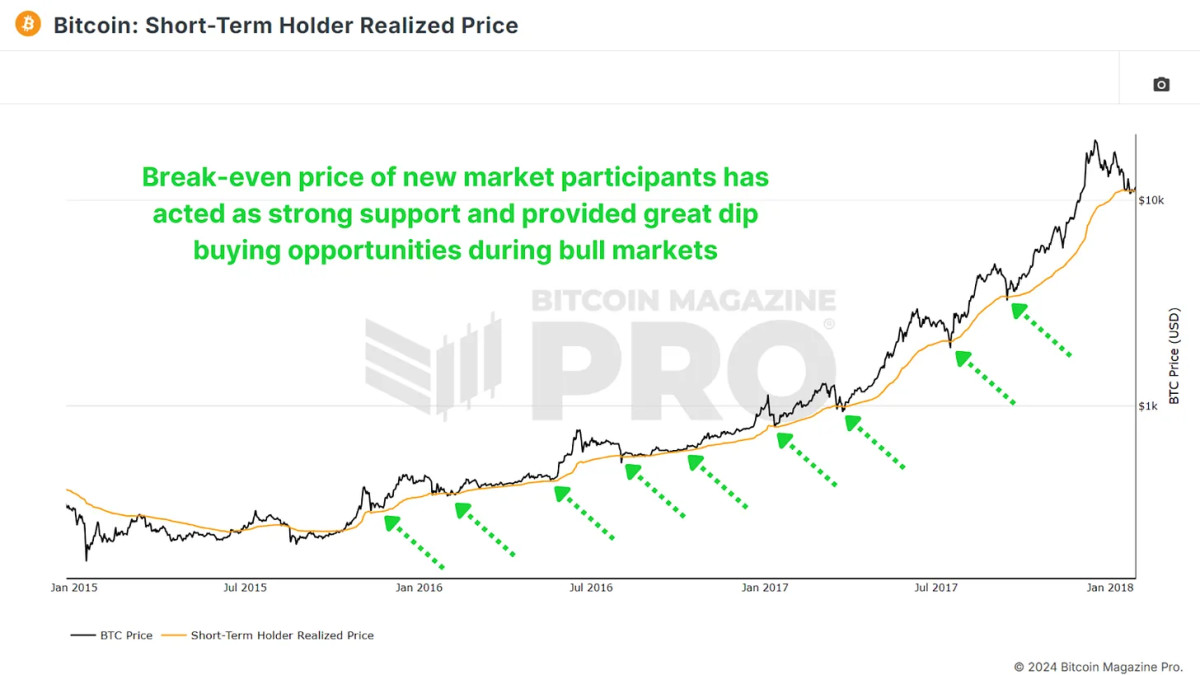
This chart reflects the average cost basis of new market participants, offering a glimpse into the Short-Term Holder activity. Historically, during bull cycles, whenever the price rebounds off the Short-Term Holder Realized Price line (or slightly dips below), it has presented excellent opportunities for accumulation.
Gauging Market Sentiment
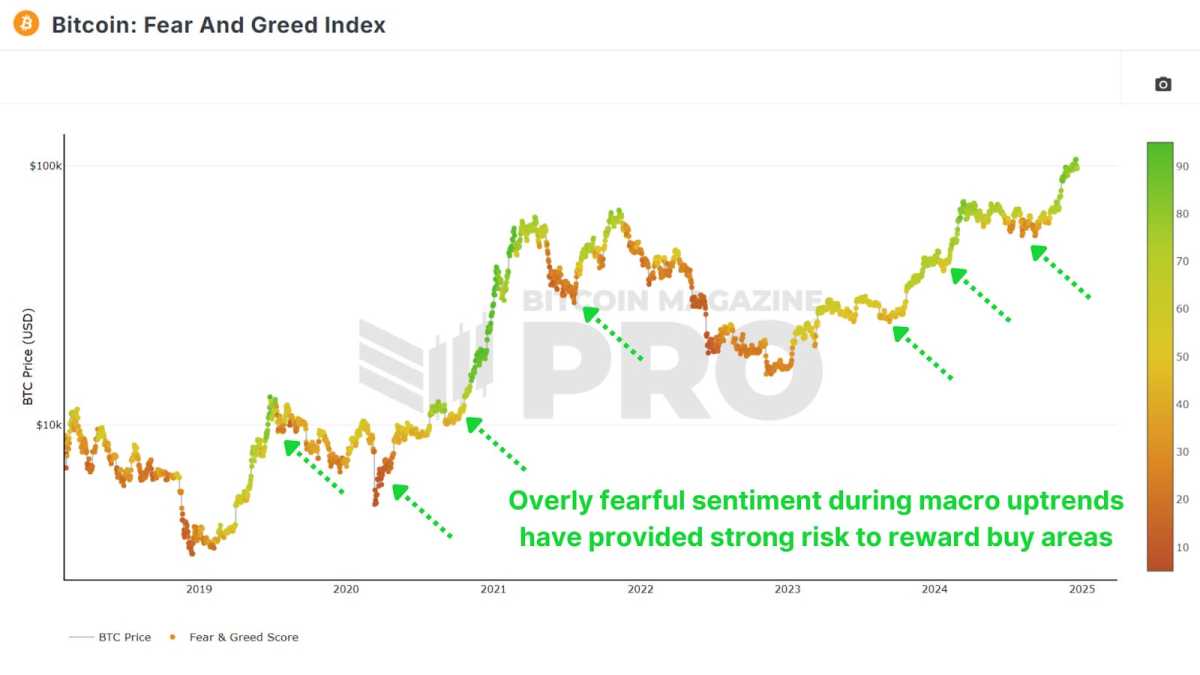
Though simple, the Fear and Greed Index provides valuable insight into market emotions. Scores of 25 or below often signify extreme fear, which often accompanies irrational sell-offs. These moments offer favorable risk-to-reward conditions.
Spotting Market Overreaction
Funding Rates reflect trader sentiment in futures markets. Negative Funding during bull cycles are particularly telling. Exchanges like Bybit, which attract retail investors, show that negative Rates are a strong signal for accumulation during dips.
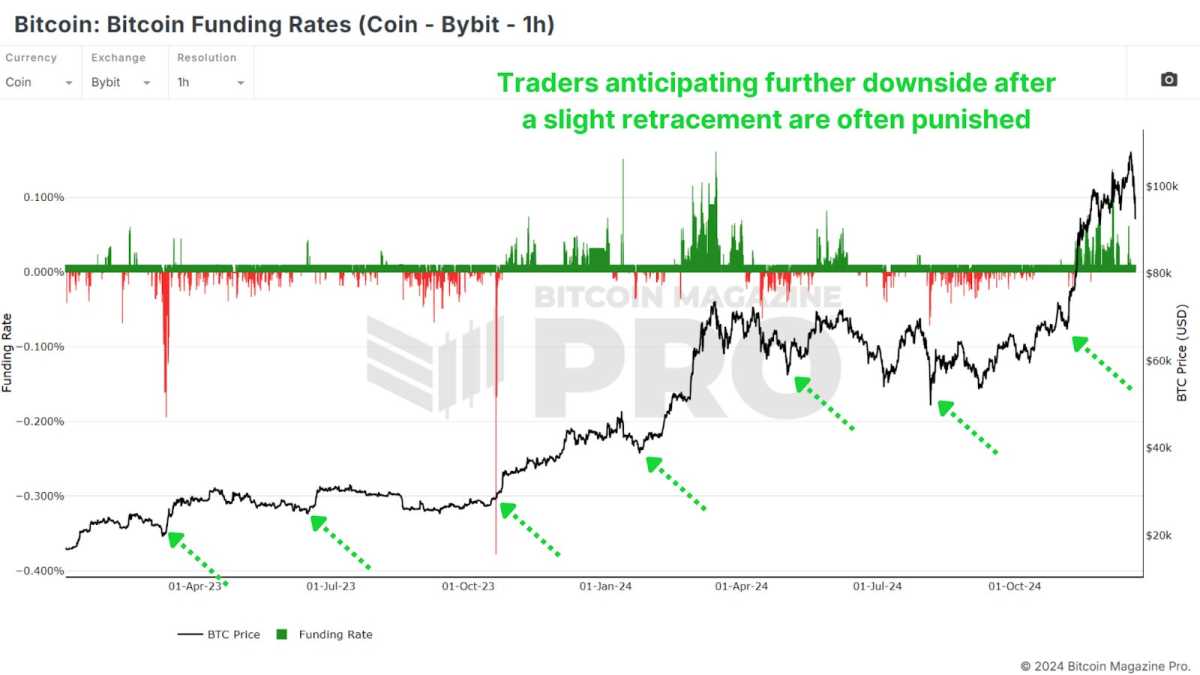
When traders use BTC as collateral, negative rates often indicate excellent buying opportunities, as those shorting with Bitcoin tend to be more cautious and deliberate. This is why I prefer focusing on Coin-Denominated Funding Rates as opposed to regular USD Rates.
Active Address Sentiment Indicator
This tool measures the divergence between Bitcoin’s price and network activity, when we see a divergence in the Active Address Sentiment Indicator (AASI) it indicates that there’s overly bearish price action given how strong the underlying network usage is.

My preferred method of utilization is to wait until the 28-day percentage price change dips beneath the lower standard deviation band of the 28-day percentage change in active addresses and crosses back above. This buy signal confirms network strength and often signals a reversal.
Conclusion
Accumulating during bull market dips involves managing risk rather than chasing bottoms. Buying slightly higher but in oversold conditions reduces the likelihood of experiencing a 20%-40% drawdown compared to purchasing during a sharp rally.
Confirm we’re still in a bull market and dips are for buying, then identify favorable buying zones using multiple metrics for confluence, such as Short-Term Holder Realized Price, Fear & Greed Index, Funding Rates, and AASI. Prioritize small, incremental purchases (dollar-cost averaging) over going all-in and focus on risk-to-reward ratios rather than absolute dollar amounts.
By combining these strategies, you can make informed decisions and capitalize on the unique opportunities presented by bull market dips. For a more in-depth look into this topic, check out a recent YouTube video here: How To Accumulate Bitcoin Bull Market Dips
For more detailed Bitcoin analysis and to access advanced features like live charts, personalized indicator alerts, and in-depth industry reports, check out Bitcoin Magazine Pro.
Disclaimer: This article is for informational purposes only and should not be considered financial advice. Always do your own research before making any investment decisions.
Source link
Coinbase (COIN) Stock Could Become Available on Base Chain, According to Creator Jesse Pollak

Anchors Are Evil! Bitcoin Core Is Destroying Bitcoin!

Tether, top crypto exchange to swap $1b USDT to Tron network
Top Altcoins to Buy in 2025 That Could Skyrocket in 60 Days
MicroStrategy Continues Weekly Bitcoin Buying Spree With Another $101 Million
New Pi Cycle Top Prediction Chart Identifies Bitcoin Price Market Peaks with Precision

SPX6900 price rockets to ATH: will SPX hit $2 soon?

Pepe Coin Price Set to Crash 30% As Top Holders Sell PEPE
MicroStrategy Buys a Further 1,020 Bitcoin
New crypto haven or US competitor: Russia approves crypto taxation
Ex-SEC Lawyer Affirms Settlement in XRP Lawsuit
These Are His Next Buys
UAE’s Bitcoin mining firm Phoenix Group expands in US ahead of Nasdaq listing: report
Shiba Inu Community Unveils TREAT Token Launch Date, Here’s When
Bithumb Meta Rebrands to Bithumb Partners for Investors

Telegram users can send gifts to friends, TON fails to pump

Ethereum’s lowered yield might signal a paradigmatic shift in the ecosystem

Bitcoin Could Rally to $80,000 on the Eve of US Elections

Institutional Investors Go All In on Crypto as 57% Plan to Boost Allocations as Bull Run Heats Up, Sygnum Survey Reveals

Crypto’s Big Trump Gamble Is Risky

A Kamala Presidency Could Be Just as Bullish for Bitcoin

Ripple-SEC Case Ends, But These 3 Rivals Could Jump 500x

SEC filing underway, Bitcoin rewards app Fold adopts FLD ticker

Arthur Hayes, Murad’s Prediction For Meme Coins, AI & DeFi Coins For 2025

Cardano and the XRP price action lock in bulls vs bears battle as RCO Finance prepares for 3,000% surge

A16z-backed Espresso announces mainnet launch of core product

Tether CEO Paolo Ardoino Denies Rumors That Stablecoin Issuer Is Under Federal Investigation

Crypto Exchange OKX Moves To Support USDC Ecosystem by Adding Six New Trading Pairs

Trump’s Coin Is About As Revolutionary As OneCoin

Ripple Vs. SEC, Shiba Inu, US Elections Steal Spotlight
Trending

 News3 months ago
Telegram users can send gifts to friends, TON fails to pump

 Bitcoin2 months ago
Bitcoin Could Rally to $80,000 on the Eve of US Elections

 DeFi3 months ago
Ethereum’s lowered yield might signal a paradigmatic shift in the ecosystem

 Bitcoin2 months ago
Institutional Investors Go All In on Crypto as 57% Plan to Boost Allocations as Bull Run Heats Up, Sygnum Survey Reveals

 Opinion2 months ago
Crypto’s Big Trump Gamble Is Risky

 Opinion3 months ago
A Kamala Presidency Could Be Just as Bullish for Bitcoin

 Price analysis2 months ago
Ripple-SEC Case Ends, But These 3 Rivals Could Jump 500x

 Bitcoin3 months ago
SEC filing underway, Bitcoin rewards app Fold adopts FLD ticker


