
Altcoin
Trader Says One Large-Cap Altcoin To Skyrocket by at Least 116%, Updates Outlook XRP, Cardano and Dogecoin

A widely followed analyst and trader is leaning bullish on a top-30 altcoin by market cap while outlining the path forward for three other crypto assets.
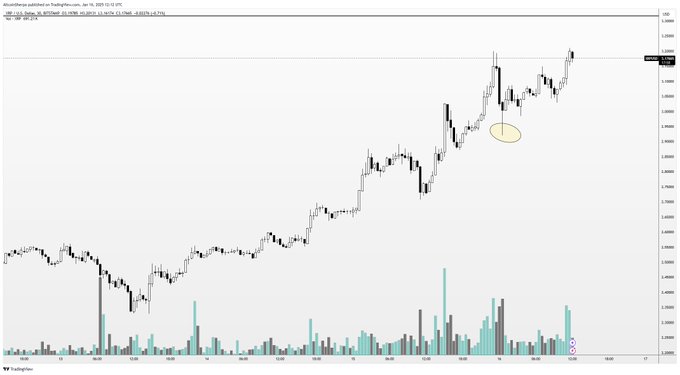
The analyst pseudonymously known as Sherpa tells his 239,700 followers on the social media platform X that the utility token of the decentralized open financial system, Hyperliquid (HYPE), is likely to surge by at least 116% from the current level before the end of this cycle.
“…I still think HYPE is a great project and will go to $50+ later this cycle. It just hits too many narratives and I have a bag of this (and I’m doing a little trading just to hope to get more points). Wouldn’t rush into a position here but more scale in. Not one to give you a 10x at these current levels for this cycle in my opinion but could still be a safe one to hold.”

Hyperliquid is trading at $23.16 at time of writing.
Next up is XRP. While observing that XRP is demonstrating strength as it sits just below its all-time high, Sherpa says that XRP is not at an ideal level for long entries.
“For what it’s worth, I don’t actually recommend you buy more at this current position. It’s at former all-time high and this is a natural retracement point. Think you should be patient with it. I’m going to wait a bit before adding and hope it dips.”
Next up is Cardano (ADA). The analyst says Cardano appears “pretty strong” on the weekly time frame and could continue to go up as long as other first-generation altcoins continue to appreciate.

Turning to Dogecoin (DOGE), Sherpa says the largest memecoin by market cap “looks strong still.”
According to Sherpa, Dogecoin could trade in a range for a while before revisiting the 42-month high of around $0.485 reached in December.
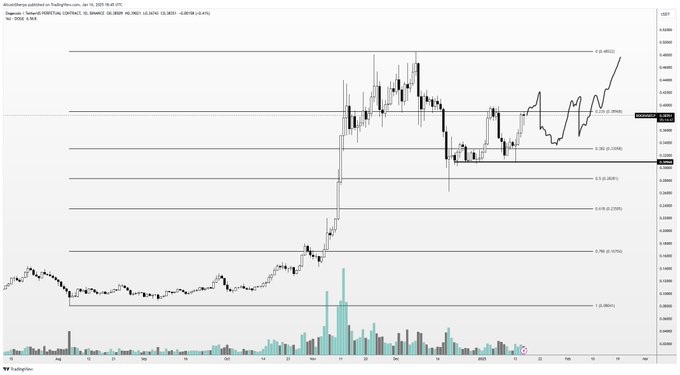
Dogecoin is trading at $0.412 at time of writing.
Don’t Miss a Beat – Subscribe to get email alerts delivered directly to your inbox
Check Price Action
Follow us on X, Facebook and Telegram
Surf The Daily Hodl Mix
 

Disclaimer: Opinions expressed at The Daily Hodl are not investment advice. Investors should do their due diligence before making any high-risk investments in Bitcoin, cryptocurrency or digital assets. Please be advised that your transfers and trades are at your own risk, and any losses you may incur are your responsibility. The Daily Hodl does not recommend the buying or selling of any cryptocurrencies or digital assets, nor is The Daily Hodl an investment advisor. Please note that The Daily Hodl participates in affiliate marketing.
Generated Image: Midjourney
Source link


Reason to trust
![]()
Strict editorial policy that focuses on accuracy, relevance, and impartiality
Created by industry experts and meticulously reviewed
The highest standards in reporting and publishing
Strict editorial policy that focuses on accuracy, relevance, and impartiality
Morbi pretium leo et nisl aliquam mollis. Quisque arcu lorem, ultricies quis pellentesque nec, ullamcorper eu odio.
The XRP price is eyeing a surge of 20% as it looks to reach a major resistance zone at $2.50, providing a bullish outlook for the altcoin. This projection comes amid XRP’s pullback to retest the breakout zone, with a confirmation of this breakout likely to lead to new highs.
XRP Price Eyes 20% Surge To $2.51
In a TradingView post, crypto analyst Liam indicated that the XRP price could soon rally to the key resistance level at $2.15803. The analyst highlighted $2.29387 and $2.40995 as the other key resistance levels for the altcoin. Meanwhile, he mentioned that $2.18880 and $2.08373 are the key support zones to keep an eye on.
Related Reading
Liam also commented on the current XRP price action and what needs to happen for the altcoin to reach this $2.51 target. He noted that the altcoin recently broke above a key consolidation range but is now pulling back to retest the breakout zone. If the support between $2.18880 and $2.08373 holds, then the altcoin could initiate a strong bullish rally towards the resistance zones, with $2.51803 as the major target.

The crypto analyst advised market participants to closely monitor price action around the retest zone. He claimed that a strong bullish rejection from support could offer a high-probability long opportunity toward the higher targets.
The XRP price currently boasts a bullish outlook, with the broader crypto market witnessing a reversal from recent lows. XRP’s fundamentals also support a price. CME Group recently announced plans to launch XRP futures contracts in May, while ProShares Trust XRP ETF could launch soon, which would also provide institutional investors with exposure to the fourth-largest crypto by market cap.
$2.24 Is Also A Major Resistance To Keep An Eye On
Crypto analyst CasiTrades suggested that $2.24 is another major resistance level to keep an eye on for the XRP price. She noted that this level has been a key focus for weeks. XRP recently broke above this level as it surged to $2.27 but faced strong rejection, and is now looking to retest $2.24 as resistance.
Related Reading
CasiTrades asserted that price remains vulnerable to deeper support until it can reclaim and close above $2.24. On the bullish side, the analyst claimed that this is a critical area that needs to be respected to keep bullish momentum intact. Crypto analyst Dark Defender assured that XRP will continue to climb to the top. His accompanying chart showed that the altcoin could reach as high as $8 in this market cycle.
At the time of writing, the XRP price is trading at around $2.28, up over 5% in the last 24 hours, according to data from CoinMarketCap.
Featured image from Pixabay, chart from Tradingview.com
Source link
Reason to trust
![]()
Strict editorial policy that focuses on accuracy, relevance, and impartiality
Created by industry experts and meticulously reviewed
The highest standards in reporting and publishing
Strict editorial policy that focuses on accuracy, relevance, and impartiality
Morbi pretium leo et nisl aliquam mollis. Quisque arcu lorem, ultricies quis pellentesque nec, ullamcorper eu odio.
Dogecoin’s price is entering a new bullish phase after months of decline. Technical analysis of the daily candlestick timeframe chart shows that the popular meme cryptocurrency is flashing a trend reversal, hinting at a significant shift from bearish to bullish momentum.
Analyst Flags Daily Trend Reversal On Dogecoin Chart
A prominent crypto analyst known as Trader Tardigrade has highlighted a confirmed trend reversal for Dogecoin. In a post on X (formerly Twitter) this week, he pointed out that DOGE’s daily chart has flipped from a downtrend to an uptrend. This claim is reinforced by a technical analysis of Dogecoin’s price action.
Related Reading
Dogecoin’s price recently broke above a descending trendline that had defined its downtrend for several weeks. This breakout occurred on April 22, when Dogecoin closed above $0.165 on the daily candlestick timeframe. This breakout was the first step indicating the coin was escaping its bearish trajectory.
Shortly after breaching the downward sloping resistance line, Dogecoin’s price pulled back between April 23 and April 24 to retest the same trendline, but this time from above. Importantly, the former resistance trendline held strong as a new support level during the retest. Following that successful test, Dogecoin resumed its upward climb, marking the continuation of the new uptrend.
This pattern of breakout, retest, continuation is a classic technical confirmation of a trend reversal. The successful retest of this trendline gives more confidence that the bullish shift is real and not a false signal.
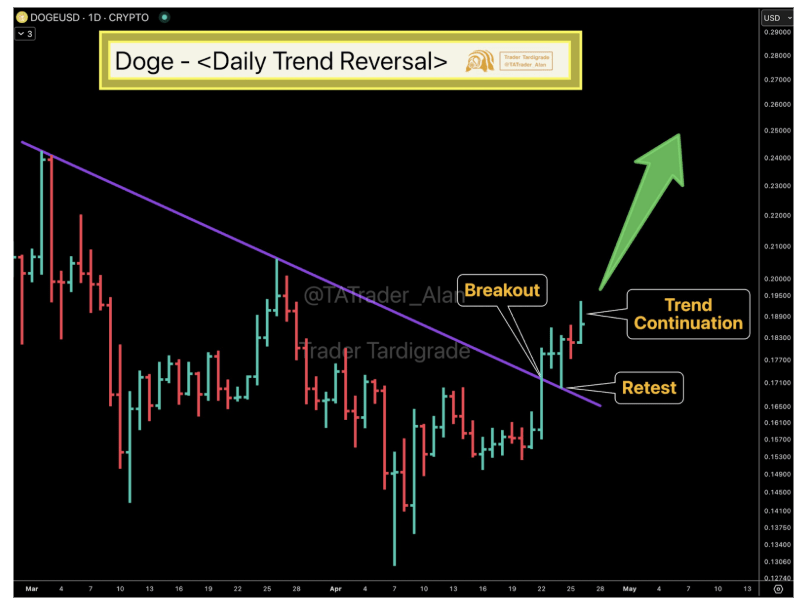
Image From X: Trader Tardigrade
Bullish Target: $0.25 By Early May
With the daily trend now pointing upward, the focus is now on how far this new uptrend could carry Dogecoin. According to Trader Tardigrade’s analysis, Dogecoin could continue climbing in the coming days, potentially crossing the quarter-dollar mark very soon. As indicated on the chart he shared by Trader Tardigrade, the next Dogecoin price target is around $0.25 by the first week of May.
If achieved, a rise to $0.25 would be a significant milestone, considering Dogecoin has been stuck in a downtrend for over 10 weeks. As such, a break to $0.25 would mark Dogecoin’s highest price since late February and a robust recovery from its recent lows around the $0.14 to $0.15 range. Such a move would also represent roughly a 51% gain from the breakout level of $0.165.
However, $0.25 is only the target in the short term. In a separate analysis, Trader Tardigrade pointed to Dogecoin’s long-term chart, highlighting a round bottom formation. The accompanying chart shows that in previous cycles, Dogecoin’s price formed a rounded bottom before entering explosive upward trends. This repeated pattern, now visible again on the monthly timeframe, signals that Dogecoin may be on the verge of another significant breakout. The long-term price target in this case is $2.8.
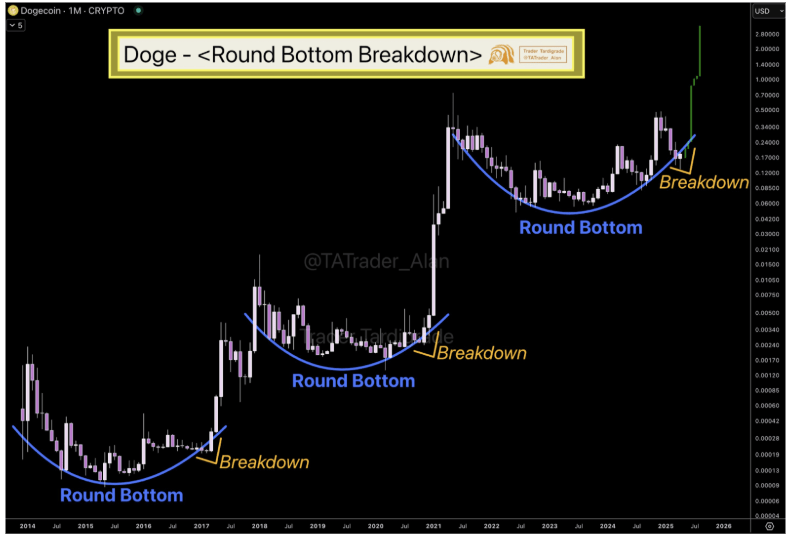
Image From X: Trader Tardigrade
Related Reading
At the time of writing, Dogecoin is trading at $0.18.
Featured image from Unsplash, chart from TradingView
Source link

TAO has recently shown signs of breaking free from its extended bearish market structure with a decisive impulse move. While this shift is promising, if a higher low is established at a key confluence zone, TAO could be setting up for a potential 200% rally toward the previous range high.
Over the past several weeks, Bittensor (TAO) has been locked in a steady downtrend, consistently printing lower highs and lower lows. That pattern may now be changing. The recent impulsive move broke above a significant lower high, marking the first real break in TAO’s bearish structure. Now, price is hovering around a high-probability zone for continuation—provided buyers can confirm a valid higher low.
Key technical points
- TAO Breaks Bearish Market Structure: TAO has broken the most recent lower high, signaling a potential shift in trend for the first time since the range high.
- Testing the 0.618 Fibonacci and VWAP: Price is now testing the golden Fibonacci level, which aligns with the VWAP drawn from the top of the current downtrend, forming a crucial area of technical confluence.
- Point of Control (POC) as a Pivot Zone: If TAO confirms a higher low at this zone, where POC, VWAP, and 0.618 Fib all intersect, it increases the probability of a strong bullish impulse.

From a technical perspective, this current zone of interaction is highly significant for TAO. The confluence of key indicators, specifically the point of control, 0.618 Fibonacci level, and anchored VWAP, creates a strong area of interest. If buyers defend this level and TAO forms a higher low, the setup for a Wave 3 bullish impulse becomes far more likely. This would target the previous range high, equating to a projected 200% rally from the current zone.
Zooming out to the macro structure, TAO remains inside a large sideways range. The recent bounce from the range low shows clear signs of buyer activity, indicating demand at lower levels.
Should TAO begin consolidating above this confluence zone, form a bullish market structure, and show strong volume profile support, the odds of a full range rotation increase sharply.
What to expect in the coming price action
TAO is at a critical inflection point. If the higher low confirms at this confluence zone, the bullish case strengthens dramatically. A successful retest could spark a powerful continuation move, offering one of the clearest 200% setups in the current market structure.
Source link

Bitcoin Is About To Begin Outperforming Gold, Says InvestAnswers – Here’s His Timeline

Bloomberg Analyst Confirms No Set Launch Date for ProShares XRP ETFs

What is Base? The Ethereum Layer-2 Network Launched by Coinbase

Loopscale hacker in talks to return stolen crypto

Bitcoin (BTC) Yield Platform Coming From Coinbase (COIN), Aspen Digital

The Emerging Market For State Services Via Citizen X

XRP Price Shoots For 20% Surge To $2.51 Amid Pullback To Breakout Zone

Stocks edge higher ahead of big earnings week

Here’s How Bitcoin Could Boost Demand for US Treasuries, According to Macro Guru Luke Gromen

Experts Predict US Recession in 2025 if Trump-China Trade War Tariffs Stay

Monero Jumps 51% After ‘Suspicious Transfer’ of $333M in Bitcoin

ZachXBT flags suspicious $330M Bitcoin transfer triggering Monero surge

Monero’s XMR Rockets 40% as XRP Leads Crypto Majors Gains

The 5 top crypto loan platforms of 2025

XRP Price Shows Strength — Breakout Above Key Levels Possible?


 24/7 Cryptocurrency News6 months ago
Arthur Hayes, Murad’s Prediction For Meme Coins, AI & DeFi Coins For 2025

 Bitcoin3 months ago
Expert Sees Bitcoin Dipping To $50K While Bullish Signs Persist

 Ripple Price1 month ago
3 Voting Polls Show Why Ripple’s XRP Price Could Hit $10 Soon

 24/7 Cryptocurrency News4 months ago
Aptos Leverages Chainlink To Enhance Scalability and Data Access

 Bitcoin6 months ago
Bitcoin Could Rally to $80,000 on the Eve of US Elections

 Opinion6 months ago
Crypto’s Big Trump Gamble Is Risky

 Bitcoin6 months ago
Institutional Investors Go All In on Crypto as 57% Plan to Boost Allocations as Bull Run Heats Up, Sygnum Survey Reveals

 Bitcoin3 months ago
The Future of Bitcoin: Scaling, Institutional Adoption, and Strategic Reserves with Rich Rines
