
ETH
TRUMP Outperforms ETH’s 4 Year Growth in Minutes
Ethereum price today trades at $3,300 after dropping 10.16% over the past week. This lackluster performance from ETH has been a theme throughout 2024 and has not changed so far in 2025. This situation exacerbated after a new Solana meme coin announced on President-elect Donald Trump’s X page has outperformed Ethereum’s 4-year gains in just 90 minutes.
Ethereum Price Today Trades at $3,287.3, ETH is Down -2.38%
Ethereum (ETH) price today trades at $3,287.3 as of 7 AM. Although the token showed strength at the end of 2024, it has continued its lackluster performance streak. Despite this performance, whales continue to accumulate ETH at a discount. Over the past week, these investors have bought 330,000 ETH worth roughly $1 billion. From a daily high of $3,517.5 ETH price is down -2.38% on January 18.

*Ethereum price updated as of 7 AM.
TRUMP Coin Outperforms Ethereum’s 4-Year Gains in 90 Minutes
The TRUMP coin soared by 766% in just 1 hour and 31 minutes today, as seen below. Since its inception, the token has raked 8,110% and continues to rally higher. Ethereum, on the other hand, has managed to shoot up 420% in the last four years.
While some speculate that this could be the work of scammers who took control of Trump’s X account, others believe it is a promotion from the to-be 47th president of the United States of America. So far, no official comments have been made from Trump or his team. Still, many suggest TRUMP Solana meme coin was launched by Donald Trump.
Whales Buy 330,000 ETH Last Week
According to Santimen, Ethereum whales holding between 1,000 to 10,000 ETH have scooped up 330,000 tokens in the past week. At present, the value of these tokens is roughly $1 billion. Despite this buying spree, the price of ETH continues to linger at around $3,300, with no signs of a breakout rally.

On-chain metrics showcase a bullish outlook. Supporting it is the technical analysis of ETH, which also shows a similar scenario with a massive bottom reversal pattern forming on the weekly chart.
Ethereum Price Analysis
Ethereum price’s weekly chart shows a cup and handle setup, which is a bullish reversal pattern. This technical formation forecasts a 72% rally to $6,172, obtained by adding the cup’s depth to the neckline at $4,000.
However, for a decisive breakout, Ethereum price needs to overcome the $3,800 to $4,100 resistance zone. A weekly candlestick close above this zone that flips it into a support level will confirm a resolution of the cup and handle setup. In such a case, Ethereum price forecasts the next target at $6,000.
While Ethereum price performance has been lackluster, it hasn’t crashed and is holding its ground, showing resilience. On the other hand, many altcoins continue to crash with no bottom in sight. Investors should disregard the short-term noise and pay attention to the long-term outlook, which is promising, considering the crypto bull market has a long way to go before it tops. The growing fundamentals and on-chain metrics add credence to a better performance in the near future.
Source link


Reason to trust
![]()
Strict editorial policy that focuses on accuracy, relevance, and impartiality
Created by industry experts and meticulously reviewed
The highest standards in reporting and publishing
Strict editorial policy that focuses on accuracy, relevance, and impartiality
Morbi pretium leo et nisl aliquam mollis. Quisque arcu lorem, ultricies quis pellentesque nec, ullamcorper eu odio.
Ethereum, like the broader crypto market, has experienced a sharp drop in price in recent weeks. From a high of $3,352 at the start of 2025, Ether now trades around $1,800 and $1,900, reflecting a sharp drop to the world’s second-biggest crypto by market cap. Looking at Ether’s bigger picture, it’s down 47% from last year’s value.
Related Reading
If we go by the latest analyses and observations from commentators, Ether’s price correction will likely be extended. The altcoin is facing a huge bearish wave, with plenty of market factors undermining its price performance.
One significant factor is Standard Chartered’s recent decision to cut its price prediction by 60%, confirming market expectations.
News: Standard Chartered slashes ETH price target! 🚨
The bank cuts its 2025 ETH forecast from $10K to $4K, blaming Layer-2 networks like Base, which they say has drained $50B from Ethereum’s market value.#Ethereum #ETH #Crypto #Layer2 #Base #Blockchain
— Andres Meneses (@andreswifitv) March 17, 2025
Ethereum Faces A Descending Channel
Ethereum is currently in a price slump, and many experts expect a much deeper dive in the next few weeks. Ether’s price is currently floating above the $1,900 level as it continues its bearish price movements.
Analysts use the MACD indicator to verify and confirm the asset’s bearish sentiment. Also, the asset’s moving averages suggest a neutral trend and possible price consolidation.
Ethereum (ETH) remains in the correction zone today, trading around $1,874. The price continues to move in a descending channel, indicating a possible continuation of consolidation. Moving averages confirm the neutral trend: the price is holding below the 50-day and 200-day MA,… pic.twitter.com/R3vNqFBDkZ
— LVelarde (@0xvelarde) March 17, 2025
According to a crypto user named “LVelarde,” Ether’s price continues to follow the descending channel, suggesting price consolidation. The asset’s price is consolidating below its 5-day and 200-day moving averages, with traders looking for possible rejection or breakout. Since it fell below $2k, sentiments have been generally bearish, with many questioning its future price trends.
Standard Chartered Cuts Price Estimates For Ethereum
Even some of the biggest banks, like Standard Chartered Bank, are lowering their expectations of Ethereum. From a high of $10,000, the bank is reducing its price target to just $4,000, explaining that the Layer 2s are impacting its bottom line.
The bank added that changes and improvements to the blockchain affected its overall value, like its shift to the proof-of-stake and scaling roadmap.
Standard Chartered used Coinbase’s Base Layer 2 as an example, suggesting that the project has cost Ethereum $50 billion from its market cap. According to Geoff Kendrick, Standard Chartered analyst, Ethereum’s losses will continue as Base’s dominance in the industry continues.
Kendrick calls this the blockchain’s “midlife crisis”, adding that Ethereum’s chain has become a commodity with its Layer 2 framework.
Related Reading
Things Ethereum Can Do To Address Its Slide
According to Kendrick, Ethereum can address its downturn in two ways. First, it can leverage its security-based dominance in the context of the tokenization of real-world assets (RWA). If Ethereum focuses on security, it can maintain its 80% market share.
Second, it can charge taxes for its Layer 2s, but it’s highly unlikely. Kendrick expects Ethereum to continue its underperformance in the short term.
Featured image from Bloomberg, chart from TradingView
Source link

Reason to trust
![]()
Strict editorial policy that focuses on accuracy, relevance, and impartiality
Created by industry experts and meticulously reviewed
The highest standards in reporting and publishing
Strict editorial policy that focuses on accuracy, relevance, and impartiality
Morbi pretium leo et nisl aliquam mollis. Quisque arcu lorem, ultricies quis pellentesque nec, ullamcorper eu odio.
Ethereum is currently consolidating below the $2,000 mark, trading within a narrow range between $1,800 and $1,900 as market uncertainty persists. Bulls have lost control, and speculation about a potential continuation of the bear trend is growing among analysts and investors. With macroeconomic instability, rising trade war fears, and erratic policy decisions from US President Trump, both crypto and U.S. stock markets remain highly volatile, adding to Ethereum’s struggles.
Related Reading
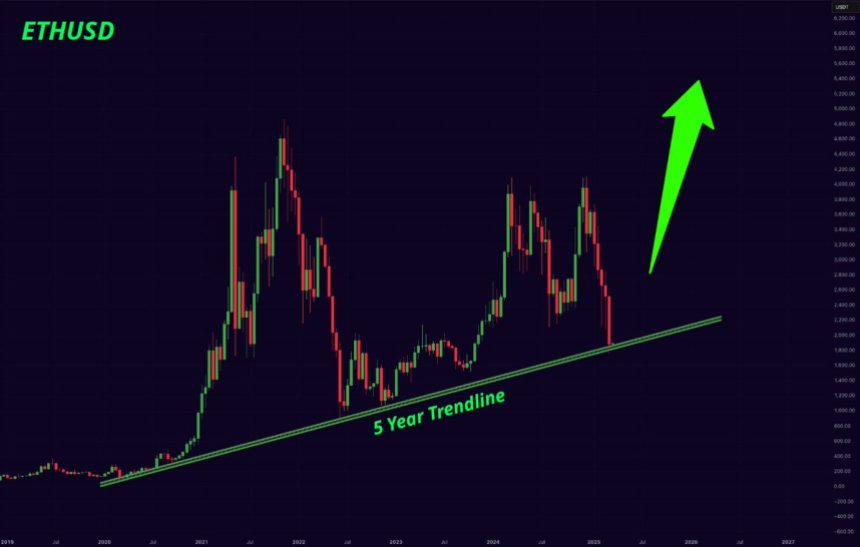
To highlight Ethereum’s fragile position, top analyst Mister Crypto shared a technical analysis revealing that ETH is currently testing a 5-year-long trendline, a crucial level that has historically acted as strong support during major corrections. If Ethereum fails to hold this trendline, the market could see a deeper decline, reinforcing bearish sentiment and potentially pushing ETH toward lower demand zones.
On the other hand, if Ethereum holds above this trendline, it could trigger a strong recovery, offering hope for bulls looking for a reversal. Over the coming days, Ethereum’s reaction at this level will determine its next major move, making this a pivotal moment for the second-largest cryptocurrency.
Ethereum Faces Crucial Test as It Trades Below Multi-Year Support
Ethereum has been under massive selling pressure, driven by macroeconomic uncertainty and trade war fears that have rattled both the crypto and U.S. stock markets. With risk assets struggling to find stability, ETH has lost key price levels and now trades below a critical multi-year support around $2,000, which could flip into strong resistance if bulls fail to reclaim it.
Related Reading
Analysts warn that Ethereum’s downtrend may continue as broader economic conditions show no signs of improvement. Investors remain cautious, with global trade tensions, inflation concerns, and U.S. regulatory uncertainties weighing on market sentiment. However, despite these bearish factors, some experts believe Ethereum could be preparing for a long-term recovery.
Mister Crypto’s technical analysis on X highlights that Ethereum is currently testing a 5-year-long support trendline, an even stronger level than the $2,000 demand zone. According to his insights, this trendline has historically held during major corrections and served as a key turning point for bullish reversals. If Ethereum maintains support above this level, it could trigger a significant recovery rally, pushing ETH back above $2,000 and beyond.
Over the coming weeks, Ethereum’s price reaction at this crucial trendline will determine whether a reversal is on the horizon or if the bearish trend will extend further.
ETH Bulls And Bears Battle For Control
Ethereum is now at a crucial crossroads, with bulls struggling to reclaim the $2,000 mark, while bears fail to push ETH below $1,800. This prolonged consolidation phase has left investors uncertain about the next major move for ETH.
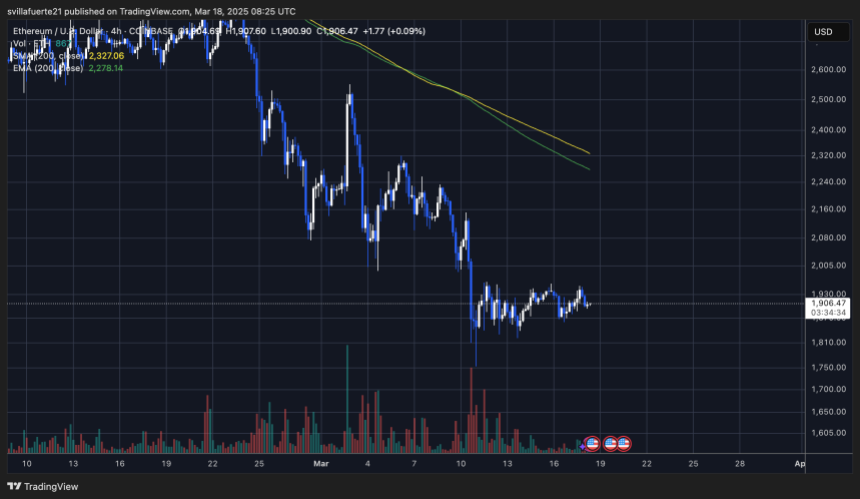
For a recovery rally to take shape, bulls must reclaim the $2,300 level, which aligns with the 4-hour 200 moving average (MA) and exponential moving average (EMA). Breaking above this level would signal a shift in momentum and pave the way for further upside toward key resistance zones.
However, failure to reclaim the $2,000 mark and hold above crucial moving averages could trigger another wave of selling pressure. A decisive drop below $1,800 would put Ethereum in dangerous territory, opening the door for a potential retest of lower demand zones around $1,600-$1,700.
Related Reading
With macroeconomic uncertainty and market-wide volatility still in play, ETH traders should watch for a breakout or breakdown from the current range, as the next few sessions will determine the short-term trend for Ethereum.
Featured image from Dall-E, chart from TradingView
Source link
ADA
Analyst Says Crypto Whales Loading Up on Ethereum, Accumulating $815,514,345 in ETH in Just Five Days

A crypto analyst says deep-pocketed investors are snapping up the top layer-1 platform Ethereum (ETH) amid the marketwide digital asset correction.
Trader Ali Martinez tells his 132,900 followers on the social media platform X that whales gobbled up more than $815.514 million worth of ETH in less than a week.
“Whales have bought more than 420,000 Ethereum ETH in [five days]!”

Martinez is also keeping a close watch on Ethereum’s In/Out of the Money Around Price (IOMAP) metric – which classifies crypto addresses as either profiting, breaking even, or losing money – to determine support and resistance levels for ETH.
According to Martinez, ETH is currently trading in a narrow range between stiff support and resistance zones.
“Ethereum ETH key levels to watch! On-chain data reveals $1,870 as the strongest support and $2,050 as its toughest resistance!”

At time of writing, ETH is trading for $1,941.
Turning to Bitcoin (BTC), the trader believes that the crypto king is poised to witness tactical rallies after breaching the horizontal resistance of an ascending triangle pattern.
“Bitcoin BTC is breaking out! The target is $90,000 as long as the $84,000 support holds.”
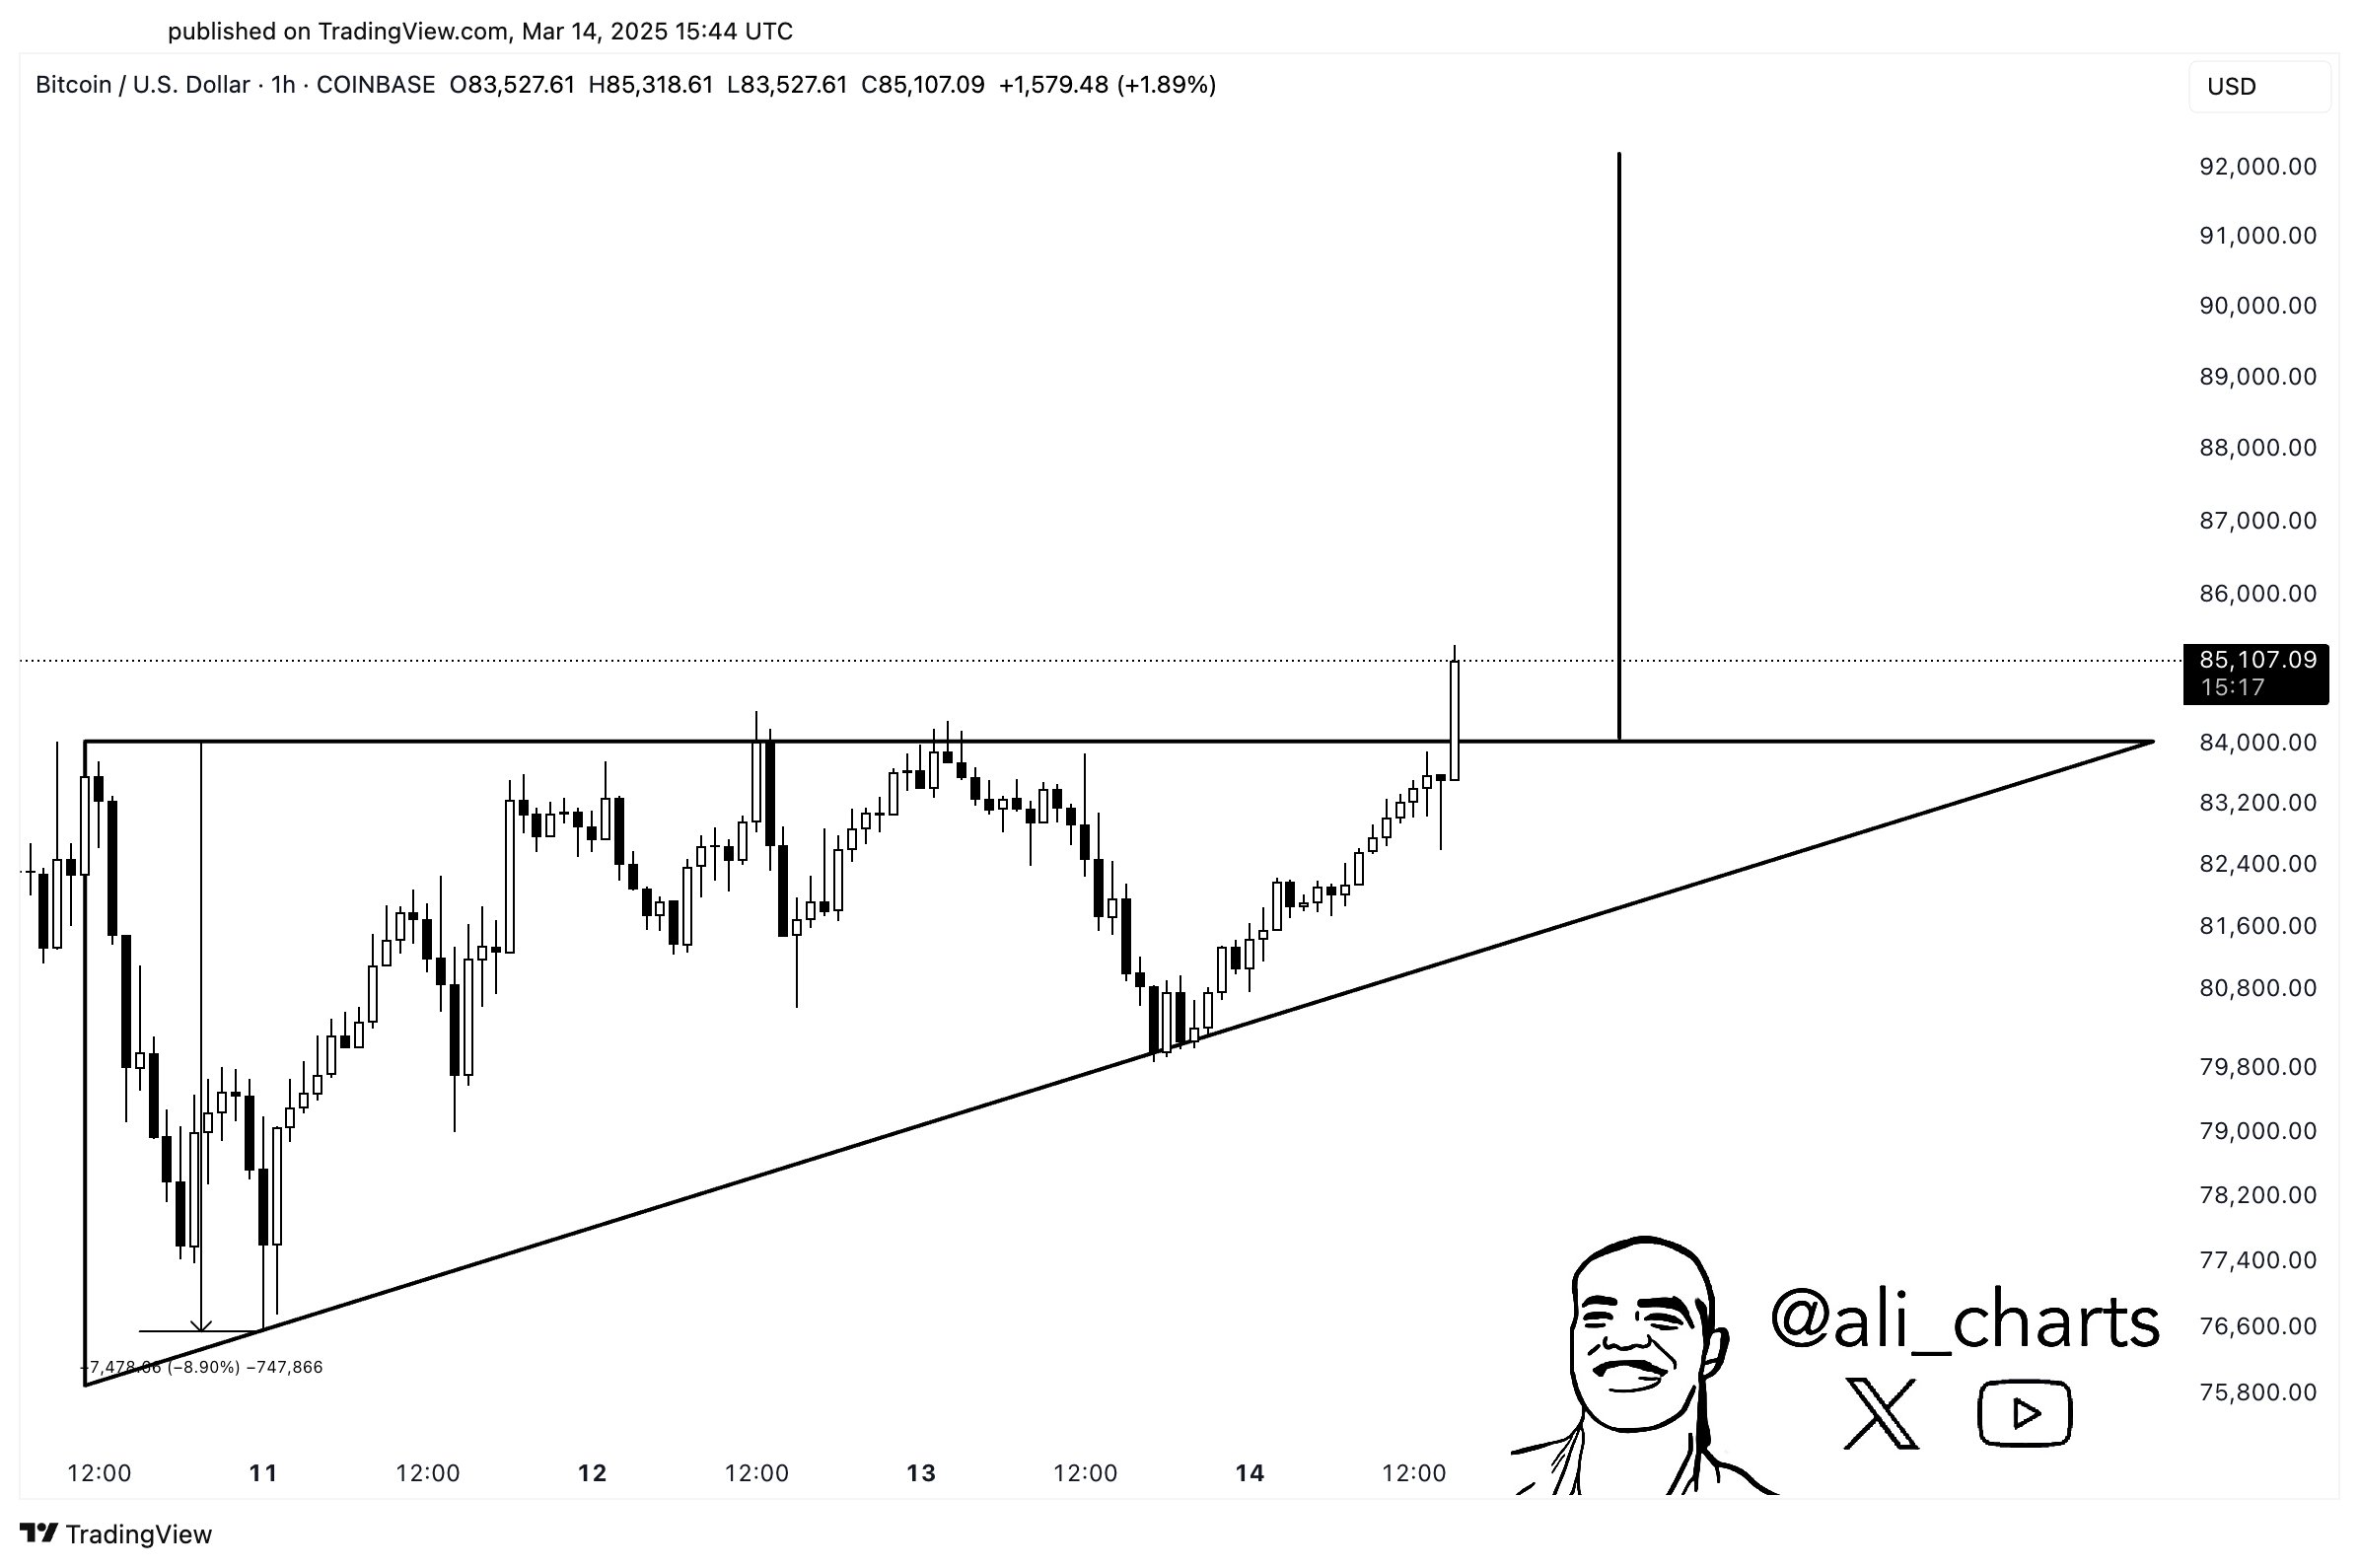
An ascending triangle pattern may be considered a bullish reversal structure if the asset soars above its horizontal resistance.
At time of writing, Bitcoin is trading for $84,288.
Turning to Ethereum rival Cardano, the analyst predicts rallies for ADA if the altcoin takes out the diagonal resistance of a triangle pattern at around $0.75.
“Cardano ADA is about to break free! Busting out of this triangle will trigger a 15% price move.”
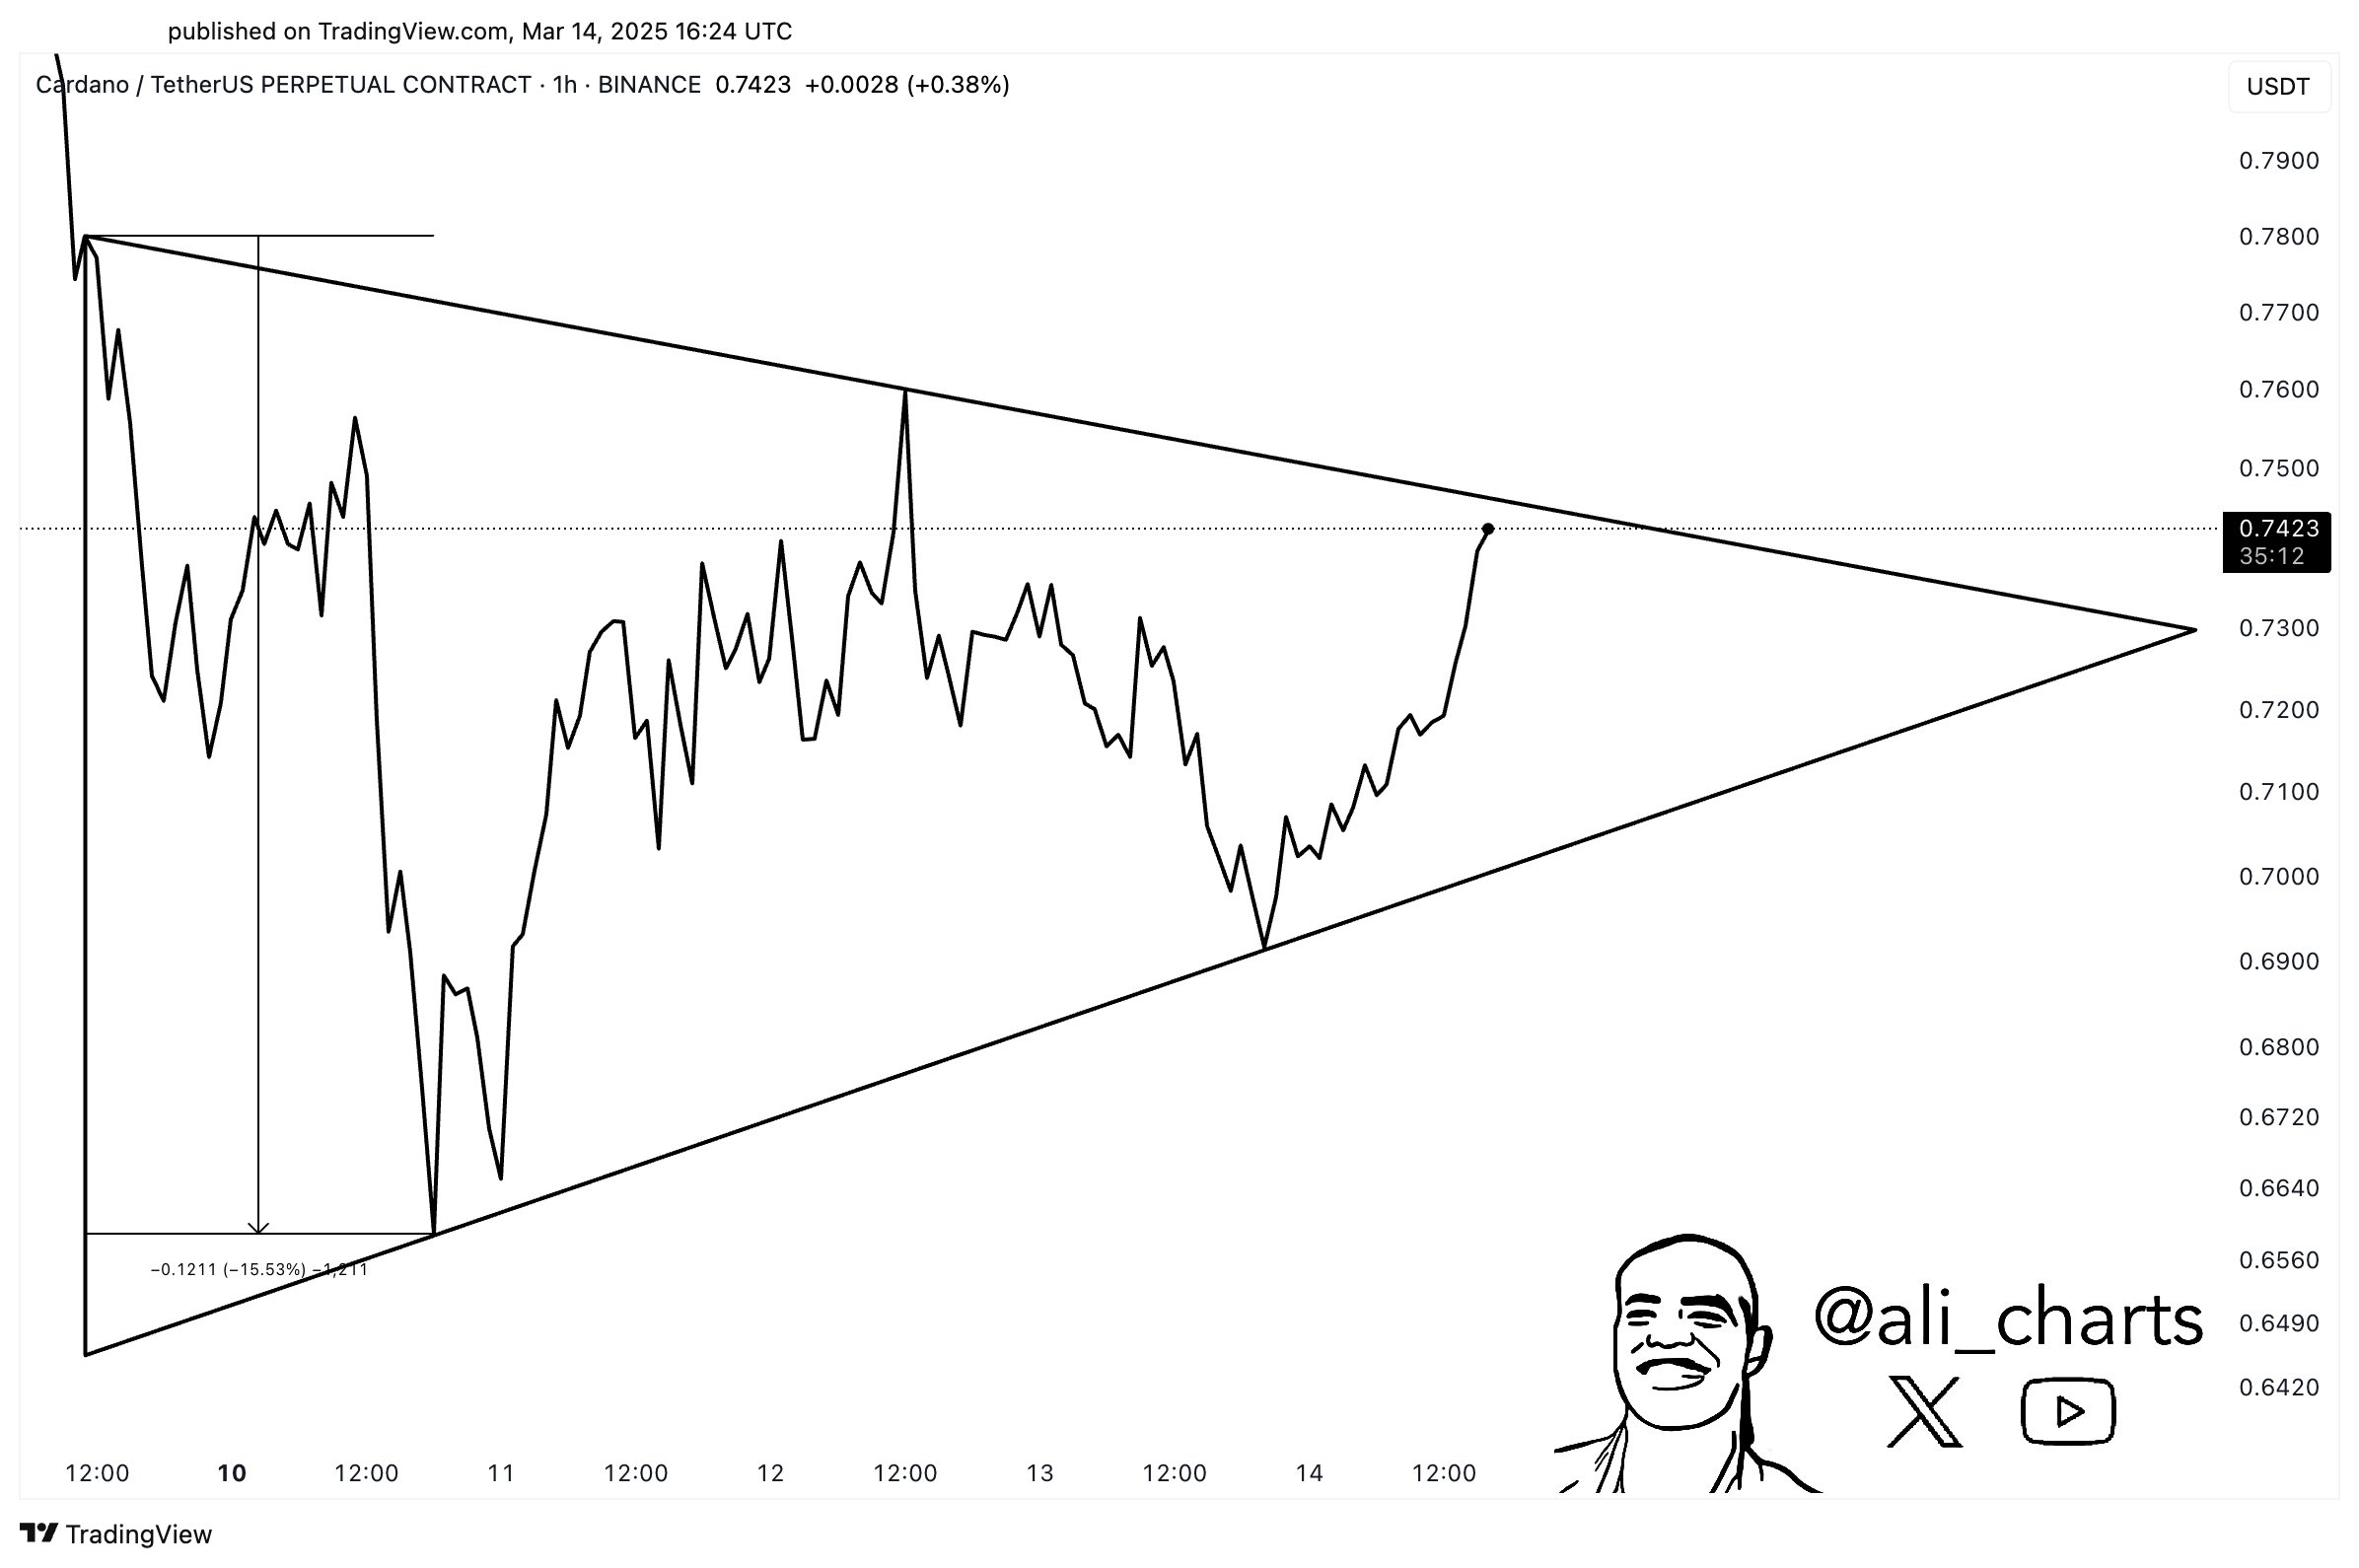
A triangle is typically viewed as a consolidation pattern as it signals a potential breakout in either direction. The asset is considered bullish if the price moves above the diagonal resistance and bearish if it tumbles below the diagonal trend line.
At time of writing, ADA is worth $0.744.
Follow us on X, Facebook and Telegram
Don’t Miss a Beat – Subscribe to get email alerts delivered directly to your inbox
Check Price Action
Surf The Daily Hodl Mix
 

Disclaimer: Opinions expressed at The Daily Hodl are not investment advice. Investors should do their due diligence before making any high-risk investments in Bitcoin, cryptocurrency or digital assets. Please be advised that your transfers and trades are at your own risk, and any losses you may incur are your responsibility. The Daily Hodl does not recommend the buying or selling of any cryptocurrencies or digital assets, nor is The Daily Hodl an investment advisor. Please note that The Daily Hodl participates in affiliate marketing.
Generated Image: Midjourney
Source link

Bitcoin’s Road To $1M? Expect A ‘Dip Then Rip,’ Bitwise CIO Says

How Bitcoin ETFs And Mining Innovations Are Reshaping BTC Price Cycles

Bitcoin Hoarder Metaplanet Issues Fresh Bonds To Increase Holdings to 3,200 BTC

Pi Network coin to $10? 4 catalysts that may make it possible

XRP Jumps as Ripple CEO Brad Garlinghouse Says SEC ‘Case Has Ended’

3 Voting Polls Show Why Ripple’s XRP Price Could Hit $10 Soon

Index Rises 3.4% as All Assets Trade Higher

Sophisticated crypto address poisoning scams drain $1.2M in March
Dogecoin Shark & Whale Population Rises—Price Turnaround Incoming?

ECB Prepping The Ground For Digital Euro Launch

One Indicator Could Soon Signal New Bitcoin Breakout, According to Crypto Analyst

BMT crypto soars nearly 30% a day after Binance listing

EOS Token Spikes 30% as Network Rebrands to ‘Vaulta’

Why Is Tron Price Up 7% Today?
Lessons from the Bybit Hack


 24/7 Cryptocurrency News4 months ago
Arthur Hayes, Murad’s Prediction For Meme Coins, AI & DeFi Coins For 2025

 Bitcoin2 months ago
Expert Sees Bitcoin Dipping To $50K While Bullish Signs Persist

 24/7 Cryptocurrency News2 months ago
Aptos Leverages Chainlink To Enhance Scalability and Data Access

 Bitcoin4 months ago
Bitcoin Could Rally to $80,000 on the Eve of US Elections

 Altcoins2 months ago
Sonic Now ‘Golden Standard’ of Layer-2s After Scaling Transactions to 16,000+ per Second, Says Andre Cronje

 Bitcoin4 months ago
Institutional Investors Go All In on Crypto as 57% Plan to Boost Allocations as Bull Run Heats Up, Sygnum Survey Reveals

 Opinion4 months ago
Crypto’s Big Trump Gamble Is Risky

 Price analysis4 months ago
Ripple-SEC Case Ends, But These 3 Rivals Could Jump 500x
