
Bitcoin
‘Very Dubious’ Speculation Suggests Bitcoin Could Follow Nasdaq ETF Rallies of 1999: Benjamin Cowen

Benjamin Cowen is saying that the price action of Bitcoin (BTC) could mirror that of the Nasdaq exchange-traded fund (ETF) Invesco QQQ during the first 13 months that followed its launch about 26 years ago.
In a new video, Cowen tells his 855,000 YouTube subscribers that the QQQ ETF hit a local top after going up by 150% in roughly one year following the launch of the ETF.
The QQQ ETF tracks the performance of the 100 largest non-financial firms listed on the Nasdaq stock exchange.
As the flagship digital asset approaches the first anniversary since the launch of the spot Bitcoin ETF, Cowen says the crypto king could replicate similar price action, though it’s unlikely to “play out the exact same way.”
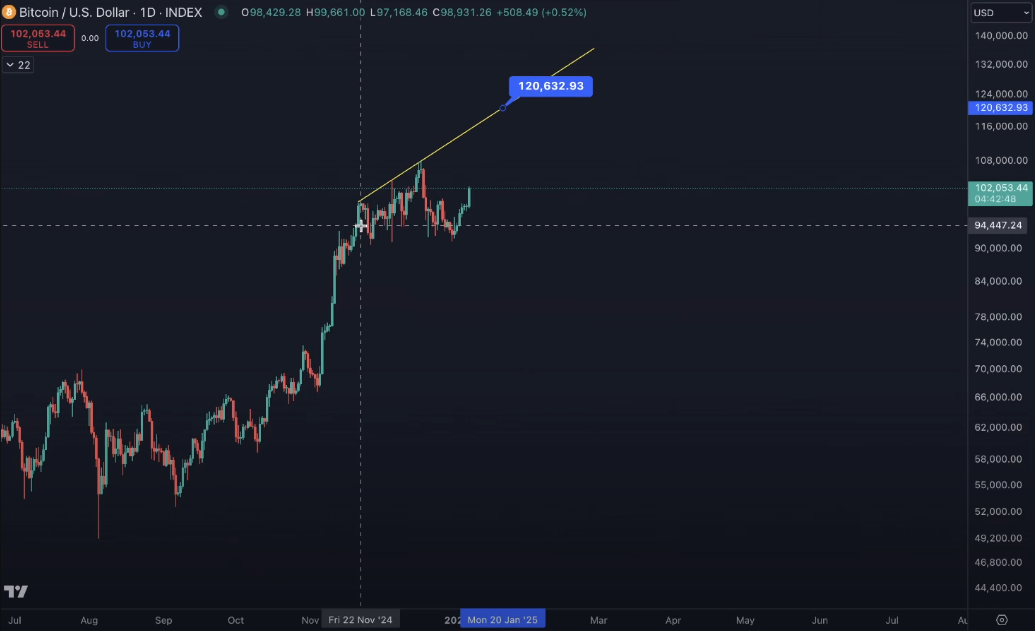
“In 1999 the QQQ ETF launched in March and it rallied from around $48 to $120. And that Rally from $48 to $120 took about 54 weeks – $48 to $120…
…if you look at Bitcoin’s ETF, it launched at around $48,000… if you look at the launch of the spot ETF for Bitcoin it wicked up to $48,000 instead of down to it like it did with the QQQ [ETF]. But interestingly enough, 54 weeks later is January 20th – Inauguration Day [of President-elect Donald Trump], which is interesting because 54 weeks after this launch of the QQQ, it was 54 weeks later the QQQ went from like $48 to $120.
Now look at this, if you go to Bitcoin on the daily time frame and you connect these highs here [$99,600, $104,100 and $108,200] and you just extend that out what’s fascinating is if you grab the sort of a price label and you go over to January 20th and go up to this trend line it would put you at $120,000 which is exactly what the QQQ did – it went from $48 to $120, 54 weeks later.”
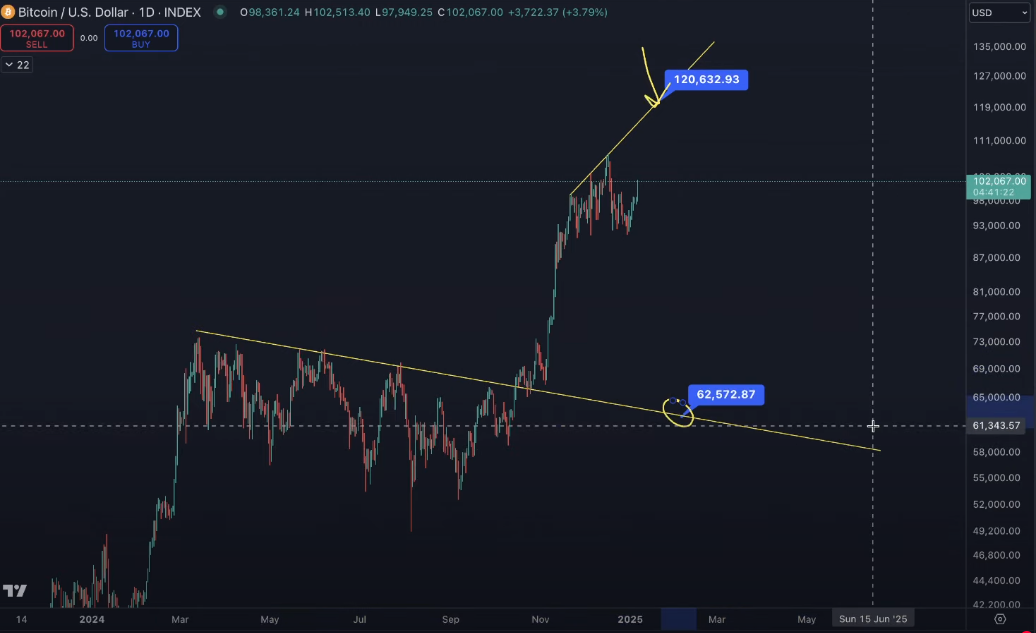
Cowen says that if Bitcoin’s price action closely follows that of the QQQ ETF in the first 13 months of its existence, a 48% drop is a possibility.
“Obviously this is very dubious and obviously, we know that QQQ got a large drop after that…
…what I would be interested in is if Bitcoin finds itself at $120,000 at some point in a few weeks, what is the reaction there? And one potential outcome… basically what happened with the QQQ is after it hit $120, it had a large drop down to $63, which is a pretty big drop.”
Bitcoin is trading at $101,484 at time of writing.
Don’t Miss a Beat – Subscribe to get email alerts delivered directly to your inbox
Check Price Action
Follow us on X, Facebook and Telegram
Surf The Daily Hodl Mix
 

Disclaimer: Opinions expressed at The Daily Hodl are not investment advice. Investors should do their due diligence before making any high-risk investments in Bitcoin, cryptocurrency or digital assets. Please be advised that your transfers and trades are at your own risk, and any losses you may incur are your responsibility. The Daily Hodl does not recommend the buying or selling of any cryptocurrencies or digital assets, nor is The Daily Hodl an investment advisor. Please note that The Daily Hodl participates in affiliate marketing.
Generated Image: Midjourney
Source link


Reason to trust
![]()
Strict editorial policy that focuses on accuracy, relevance, and impartiality
Created by industry experts and meticulously reviewed
The highest standards in reporting and publishing
Strict editorial policy that focuses on accuracy, relevance, and impartiality
Morbi pretium leo et nisl aliquam mollis. Quisque arcu lorem, ultricies quis pellentesque nec, ullamcorper eu odio.
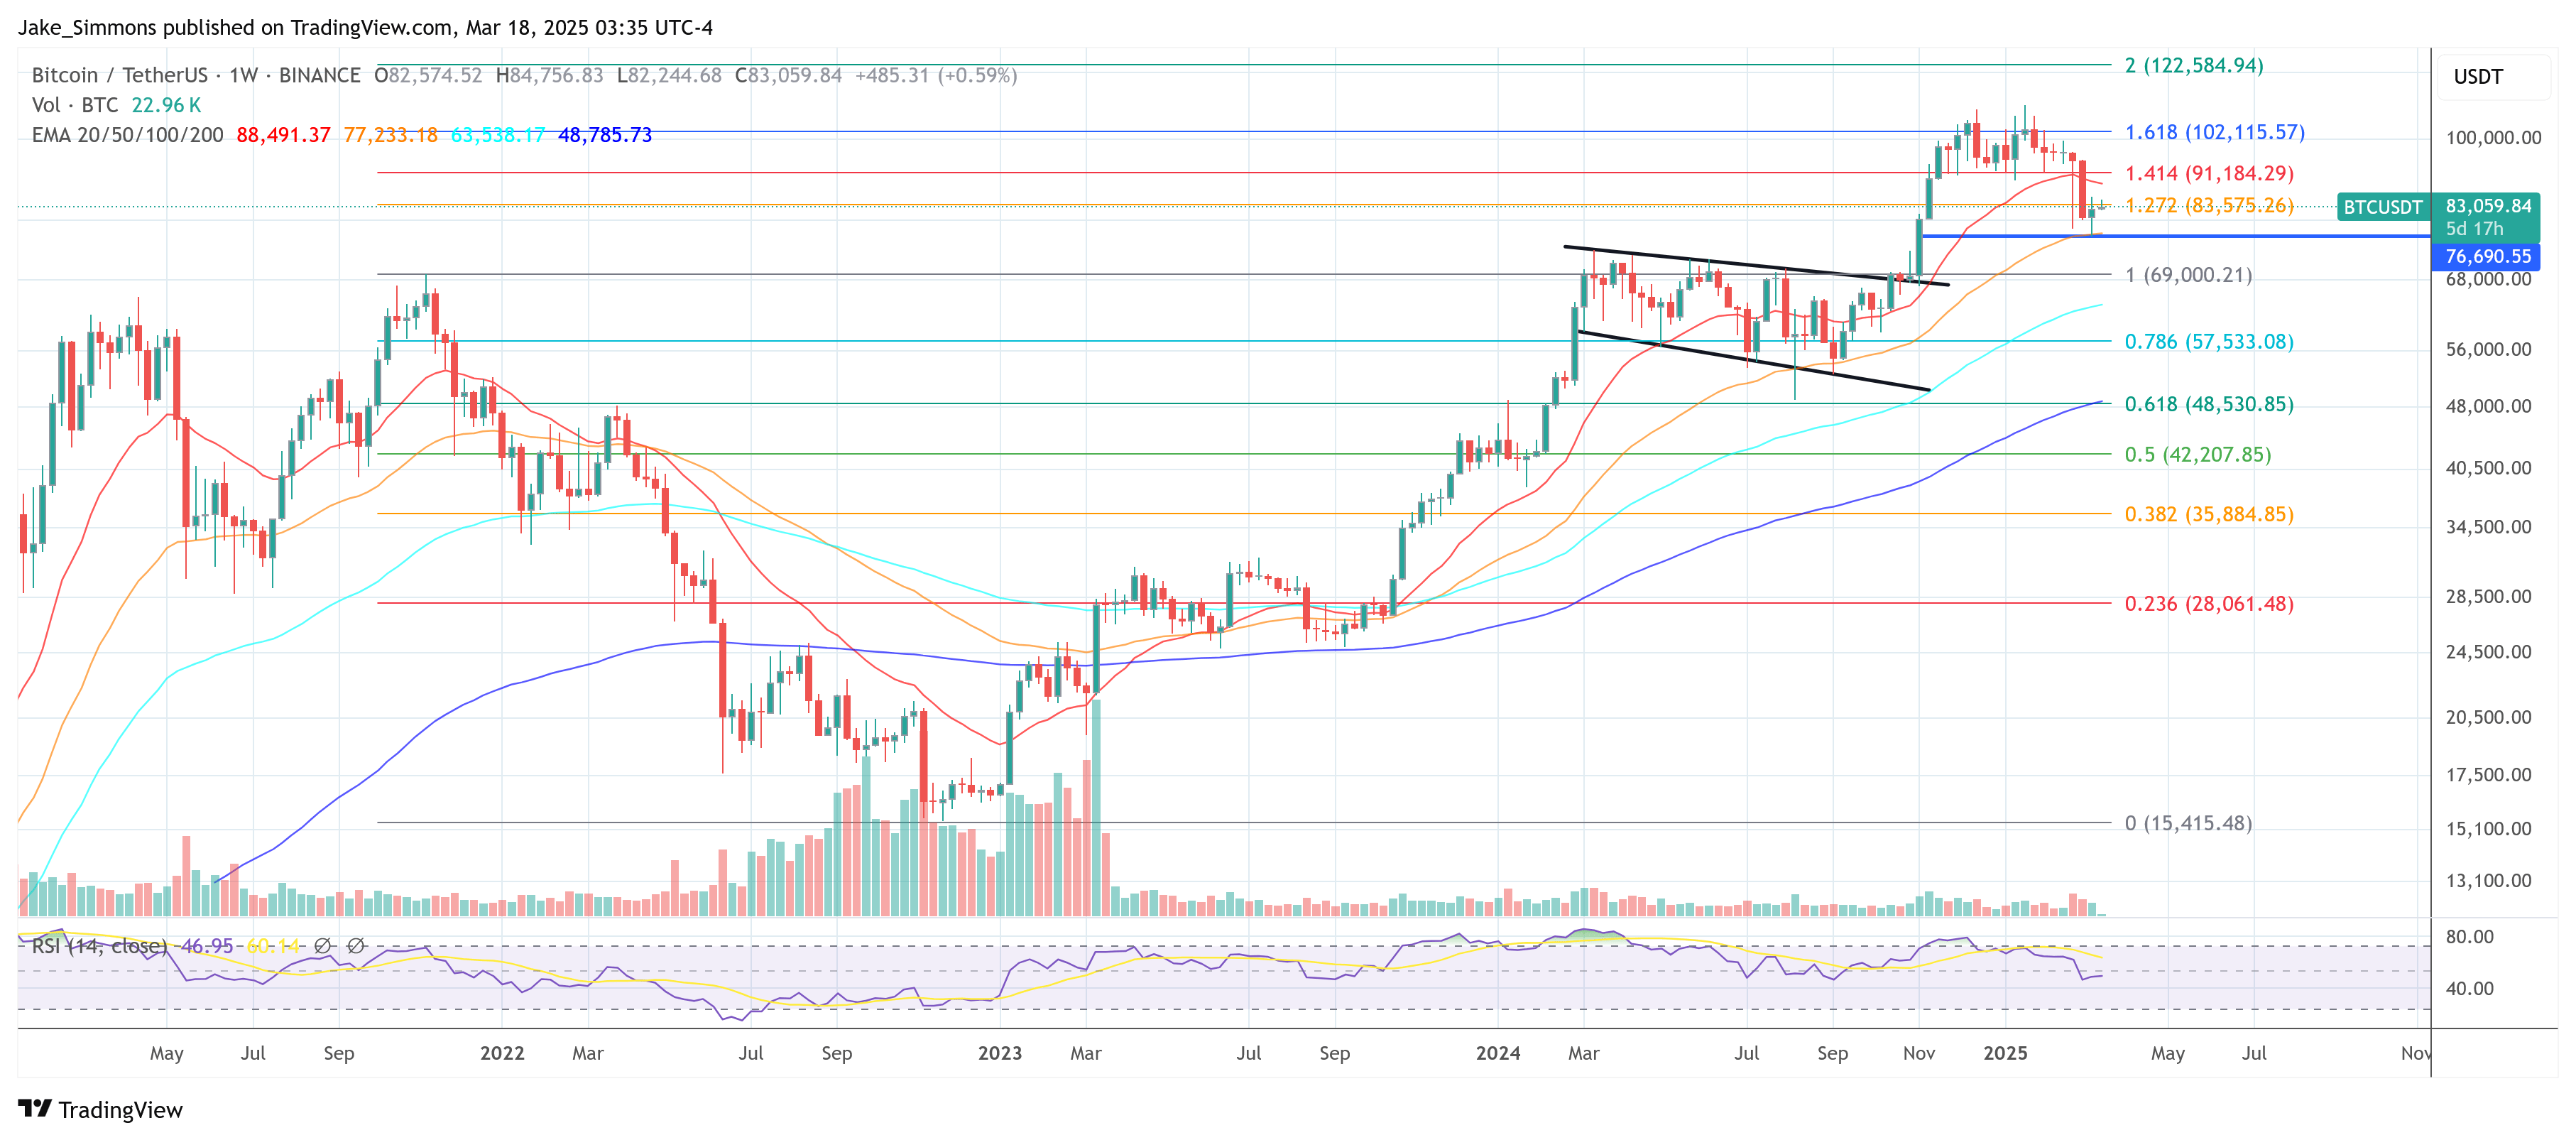
CryptoQuant CEO Ki Young Ju announced today that Bitcoin’s bull cycle “is over” and warned investors to brace for “6–12 months of bearish or sideways price action.” This development comes after the on-chain analytics veteran had previously urged caution but maintained a measured outlook on the market as recently as two weeks ago.
Is The Bitcoin Bull Run Over?
In a post shared today via X, Ki stated:“Bitcoin bull cycle is over, expecting 6–12 months of bearish or sideways price action.”
Related Reading
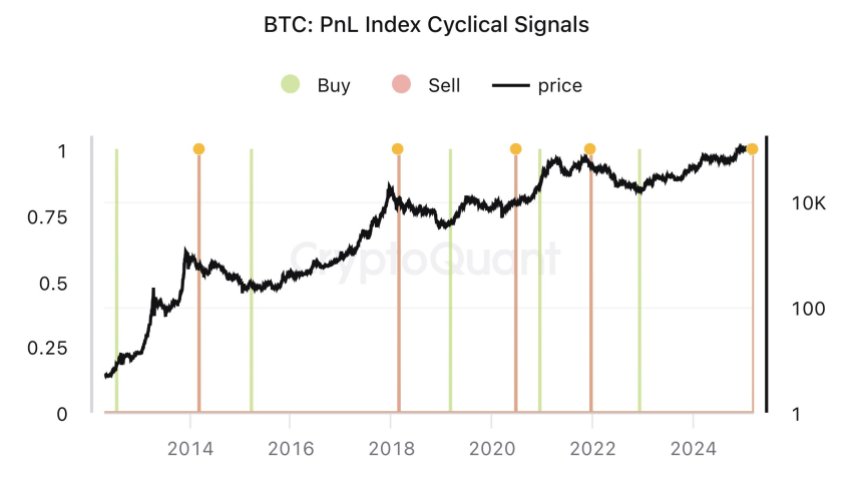
Along with the comment, the CEO highlighted the Bitcoin PnL Index Cyclical Signals—an index that aggregates multiple on-chain metrics, such as MVRV, SOPR, and NUPL, to pinpoint market tops, bottoms, and cyclical turning points in Bitcoin’s price. According to Ki, this indicator has historically offered reliable buy and sell signals.
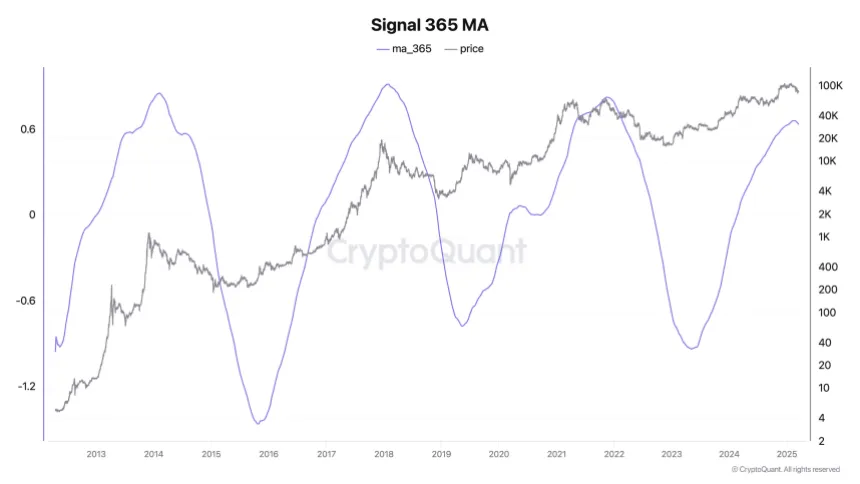
He further explained how an automated alert, previously sent to his subscribers, combined these metrics into a 365-day moving average. Once the trend in this 1-year moving average changes, it often signals a significant market inflection point. As proof, Ki also shared a chart: “This alert applies PCA to on-chain indicators like MVRV, SOPR, and NUPL to compute a 365-day moving average. This signal identifies inflection points where the trend of the 1-year moving average changes.”
Ki pointed to drying liquidity and fresh selling pressure by “new whales” who, he said, are unloading Bitcoin at lower prices. Notably, he revealed that CryptoQuant users who subscribed to his alerts received this signal before today’s public announcement. “With fresh liquidity drying up, new whales are selling Bitcoin at lower prices. Cryptoquant users who subscribed to my alerts received this signal a few days ago. I assume they’ve already adjusted their positions, so I’m posting this now.”
Related Reading
This latest declaration contrasts remarks from just four days ago, on March 14, when Ki struck a more cautious tone, stating: “Bitcoin demand seems stuck, but it’s too early to call it a bear market.”
At that time, he shared a chart of the Bitcoin Apparent Demand (30-day sum) indicator, which had turned slightly negative—an early signal that demand might be tapering off. Although Ki pointed out that demand could still rebound (as it has in past sideways phases), he acknowledged the possibility of Bitcoin teetering on the edge of a bear market.
The pivot in sentiment is especially notable given Ki’s stance from two weeks ago. In that earlier post, he opined that the “bull cycle is still intact,” crediting strong fundamentals and growing mining capacity: “There’s no significant on-chain activity, and key indicators are neutral, suggesting the bull cycle is still intact. Fundamentals remain strong, with more mining rigs coming online.”
However, he also cautioned that the market could turn if sentiment did not improve, particularly in the United States. With today’s announcement, the warning has evidently crystallized. Reflecting on the potential downside scenario, Ki said at the time: “If the cycle ends here, it’s an outcome no one wanted—not old whales, mining companies, TradFi, or even Trump. (FYI, the market doesn’t care about retail.)”
At press time, BTC traded at $83,059.
Featured image created with DALL.E, chart from TradingView.com
Source link
Bitcoin
Trader Predicts Crypto Rallies Amid Expectations of Fed Monetary Policy Shift – But There’s a Catch

A widely followed crypto analyst is predicting higher prices for crypto assets as he expects the Federal Reserve to end its anti-inflation monetary policies.
In a new thread, the pseudonymous crypto analyst Pentoshi tells his 861,300 followers on the social media platform X that we are close to seeing the end of quantitative tightening (QT), which are policies that reduce the Fed’s balance sheet and lowers the supply of money in circulation.
The trader cites data from the decentralized prediction platform Polymarket, which shows that 100% of users believe that the Fed will end QT by May of this year.
The cessation of QT is typically seen as bullish for risk assets like Bitcoin (BTC) and altcoins as the move signals the end of tight monetary conditions.
However, Pentoshi warns investors to be “cautiously optimistic” as both the S&P 500 and top crypto assets have seen growth over the last few years that appears unsustainable.
“I think we are getting close to [the] end of QT with Polymarket now pricing in odds as a sure thing whereas before they were much lower odds. As previously stated, it does seem Trump would end up forcing it. I don’t think QT automatically means it’s easy mode.
I think that mode is clearly gone overall in the way people think about it (2017/2021). While prices are much lower, I think it’s best to be cautiously optimistic. Many things are down significantly and there hopefully will be some decent mean reversion. Markets in general have rallied hard. And assets were likely a bit overvalued before.
SPX going 25% back to back years was going to have low growth or negative this year as it wasn’t a sustainable pace. BTC went from $16,000 to $108,000, SOL [from] $8 to $300. Cautiously optimistic. [Be] patient for any time capitulation, as often, following big trends, we eventually get longer sideways periods and less volatility as the market finds balance.”
While Pentoshi is flipping tactically bullish on stocks and crypto, he warns investors that any rally will likely be short-lived.
“I think any up currently will be a lower high. People underestimate the time aspect.”
At time of writing, Bitcoin is trading for $83,248.
Follow us on X, Facebook and Telegram
Don’t Miss a Beat – Subscribe to get email alerts delivered directly to your inbox
Check Price Action
Surf The Daily Hodl Mix
 
Disclaimer: Opinions expressed at The Daily Hodl are not investment advice. Investors should do their due diligence before making any high-risk investments in Bitcoin, cryptocurrency or digital assets. Please be advised that your transfers and trades are at your own risk, and any losses you may incur are your responsibility. The Daily Hodl does not recommend the buying or selling of any cryptocurrencies or digital assets, nor is The Daily Hodl an investment advisor. Please note that The Daily Hodl participates in affiliate marketing.
Generated Image: Midjourney
Source link
The price of Bitcoin (BTC) is undergoing bullish consolidation at the moment after the intense selloff in the broader market cooled off. The current outlook shows relief for a coin that dropped as low as $76,624.25 in the past week. Per the historical trend of BTC prices, this consolidation might be a buildup to a massive rally for the top coin.
Bitcoin Price and Potential $200,000 Play
When writing, the BTC price changed hands for $83,927.24, up by 1.38% in 24 hours. The coin has jumped from a low of $82,017.90 to a high of $84,725.32, a show of brewing breakout.
Market analyst Rekt Capital analyzed whether this current price is a short-term relief. He spotlighted a trend from June 2021, when the price of Bitcoin was consolidating between the 21-week EMA and the 50-week EMA. The consolidation came just after a crash.
About a week ago, the BTC price crashed, triggering millions in liquidation across the market. Following this price slump, the coin is consolidating between the same EMA showcased by Rekt Capital.
In June 2021, Bitcoin prices increased from $33,000 to $42,000. This gives an average price of $37,500. From here, the coin jumped by over 123.95% to its current price of $83,927.24. If history repeats, Bitcoin Bitcoin may soar to almost $187,280 or approximately $200,000.
BTC Price and Accumulation Trend
According to market data from Glassnode, Bitcoin currently has a high of 0.1. According to the market analytics platform, this figure indicates sustained buying pressure despite the market selloff.
Rather than steer clear of the market, Glassnode hinted that the coin’s distribution remains dominant overall. Other onchain indications also point to reboot from BTC proponents. IntoTheBlock data points to a 5.34% surge in large transactions to $34.7 billion.
This whale transaction is important as it shows a trend shift among market players that can impact prices. It is also complemented by the 24% surge in BTC trading volume of crypto exchanges, a sign of sustained positive sentiment.
What Next for the Crypto Market?
The growth or fall in the price of Bitcoin has a way of impacting the broader market. In an earlier cryptocurrency price prediction, the impact of Trump and Putin’s peace deal over Ukraine was considered. Experts are convinced the broader market may ignite a bullish rally if the conversations turn positive.
Although spot Bitcoin ETF market has been showcasing outflows over the past week, the coin is positioned to be the biggest beneficiary in this shift. While the Rekt Capital historic forecast teases $200,000, experts like Cathie Wood predict deflationary boom for the market, riding on massive BTC adoption rate by institutions and governments.
Godfrey Benjamin
Benjamin Godfrey is a blockchain enthusiast and journalists who relish writing about the real life applications of blockchain technology and innovations to drive general acceptance and worldwide integration of the emerging technology. His desires to educate people about cryptocurrencies inspires his contributions to renowned blockchain based media and sites. Benjamin Godfrey is a lover of sports and agriculture.
Disclaimer: The presented content may include the personal opinion of the author and is subject to market condition. Do your market research before investing in cryptocurrencies. The author or the publication does not hold any responsibility for your personal financial loss.
Source link
CryptoQuant CEO Sounds The Alarm

South Korea Dismisses Establishing Strategic Bitcoin Reserve

TokenPicks Launches Reward System to Incentivize Crypto Education

Ethereum leadership now eyes Solana-style growth, Dragonfly’s Qureshi says

SEC’s Uyeda Signals Possible Revisions to Crypto Custody Rule

Mubarak Meme Coin Trader Turns $232 Into $1.1 Million, Here’s How

Solana Protected Gender Identity Before Panning It in Anti-Queer Ad

Musk says he found ‘magic money computers’ printing money ‘out of thin air’

XRP To Triple Digits? Analyst Confident In $100 Price Goal

What Are They And What Do They Do?

Trader Predicts Crypto Rallies Amid Expectations of Fed Monetary Policy Shift – But There’s a Catch

Solana’s 5th birthday highlights explosive growth and trading activity: Mercuryo

Trump, Associates Net $390 Million Payday From World Liberty Token Sale

Bitcoin Price Eyes $200,000 Breakout If This History Aligns

Gold-Backed Tokens Outperform as ‘Bond King’ Gundlach Sees Precious Metal Hit $4,000


 24/7 Cryptocurrency News4 months ago
Arthur Hayes, Murad’s Prediction For Meme Coins, AI & DeFi Coins For 2025

 Bitcoin2 months ago
Expert Sees Bitcoin Dipping To $50K While Bullish Signs Persist

 24/7 Cryptocurrency News2 months ago
Aptos Leverages Chainlink To Enhance Scalability and Data Access

 Bitcoin4 months ago
Bitcoin Could Rally to $80,000 on the Eve of US Elections

 Altcoins2 months ago
Sonic Now ‘Golden Standard’ of Layer-2s After Scaling Transactions to 16,000+ per Second, Says Andre Cronje

 Bitcoin4 months ago
Institutional Investors Go All In on Crypto as 57% Plan to Boost Allocations as Bull Run Heats Up, Sygnum Survey Reveals

 Opinion4 months ago
Crypto’s Big Trump Gamble Is Risky

 Price analysis4 months ago
Ripple-SEC Case Ends, But These 3 Rivals Could Jump 500x

✓ Share: