
Ethereum
Wayfinder spikes 180%, MIM pumps 150%, Ethereum struggles

Despite Ethereum’s continued struggle to maintain the $1,600 price level, several altcoins posted triple-digit gains.
Wayfinder (PROMPT), Magic Internet Money (MIM), and Bitcoin Wizards (WZRD) are leading the charge in the past 24 hours.
Wayfinder has risen by 179.2% in the last 24 hours and trades at $0.5043 from a low of $0.1798. The token currently has a market cap of $113 million.
The impressive rally follows several key developments for the project. Wayfinder recently completed an airdrop, distributing 40% of the total PROMPT supply to eligible participants.
This wide distribution was complemented by listings on multiple major exchanges like Bitget, KuCoin, OKX, Hyperliquid, HTX, Gate.io, etc.

Social media visibility has also played a role in PROMPT’s price surge as the token has also been trending on X.
Second on CoinGecko’s top crypto gainers list is MAGIC•INTERNET•MONEY (MIM). MIM has gained 147% over the past 24 hours to $0.003587 from a low of $0.00145.
MIM’s price surge appears directly connected to the project’s recently announced token migration. The team behind MIM has implemented a migration plan allowing holders of Bitcoin Wizards (WZRD) tokens to claim MIM until April 15.
This migration announcement has driven increased trading activity for both tokens.
Bitcoin Wizards has jumped 127.5% in the last 24 hours and has reached $2.50 from $1.09. The token has maintained a strong surge over longer timeframes as well, with 100% growth over the past week and 96% over the last month.

Created by the same team behind Mavensbot, WZRD’s performance is closely tied to the ongoing token migration.
Both tokens have been trending on social media platforms as users discuss the migration process.
While these smaller tokens rally, Ethereum (ETH) continues to face pressure and struggles to maintain price stability in the past few weeks, even as Bitcoin (BTC) has shown some stability around $83,000.
Source link


Reason to trust
![]()
Strict editorial policy that focuses on accuracy, relevance, and impartiality
Created by industry experts and meticulously reviewed
The highest standards in reporting and publishing
Strict editorial policy that focuses on accuracy, relevance, and impartiality
Morbi pretium leo et nisl aliquam mollis. Quisque arcu lorem, ultricies quis pellentesque nec, ullamcorper eu odio.
Ethereum price started a fresh decline from the $1,690 zone. ETH is now consolidating and might decline further below the $1,580 support zone.
- Ethereum started a fresh decline after it failed to clear $1,700 and $1,720.
- The price is trading below $1,620 and the 100-hourly Simple Moving Average.
- There was a break below a new connecting bullish trend line with support at $1,625 on the hourly chart of ETH/USD (data feed via Kraken).
- The pair could start a fresh increase if it clears the $1,640 resistance zone.
Ethereum Price Faces Rejection
Ethereum price formed a base above $1,550 and started a fresh increase, like Bitcoin. ETH gained pace for a move above the $1,600 and $1,620 resistance levels.
The bulls even pumped the price above the $1,650 zone. A high was formed at $1,690 and the price recently corrected gains. There was a move below the $1,640 support zone. Besides, there was a break below a new connecting bullish trend line with support at $1,625 on the hourly chart of ETH/USD.
The price tested the 50% Fib retracement level of the upward move from the $1,472 swing low to the $1,690 high. Ethereum price is now trading below $1,625 and the 100-hourly Simple Moving Average.
On the upside, the price seems to be facing hurdles near the $1,620 level. The next key resistance is near the $1,640 level. The first major resistance is near the $1,650 level. A clear move above the $1,650 resistance might send the price toward the $1,690 resistance.

An upside break above the $1,690 resistance might call for more gains in the coming sessions. In the stated case, Ether could rise toward the $1,750 resistance zone or even $1,800 in the near term.
More Losses In ETH?
If Ethereum fails to clear the $1,640 resistance, it could start another decline. Initial support on the downside is near the $1,580 level. The first major support sits near the $1,555 zone and the 61.8% Fib retracement level of the upward move from the $1,472 swing low to the $1,690 high.
A clear move below the $1,555 support might push the price toward the $1,525 support. Any more losses might send the price toward the $1,450 support level in the near term. The next key support sits at $1,420.
Technical Indicators
Hourly MACD – The MACD for ETH/USD is gaining momentum in the bearish zone.
Hourly RSI – The RSI for ETH/USD is now below the 50 zone.
Major Support Level – $1,580
Major Resistance Level – $1,640
Source link
Reason to trust
![]()
Strict editorial policy that focuses on accuracy, relevance, and impartiality
Created by industry experts and meticulously reviewed
The highest standards in reporting and publishing
Strict editorial policy that focuses on accuracy, relevance, and impartiality
Morbi pretium leo et nisl aliquam mollis. Quisque arcu lorem, ultricies quis pellentesque nec, ullamcorper eu odio.
Ethereum might be on track to facing renewed pressure, according to an interesting technical outlook. Despite short bursts of recovery attempts, the broader market structure is still trying to flip in favor of bulls, but price movement shows that the bears are still in control. Notably, a recent technical analysis posted by crypto analyst Youriverse on the TradingView platform highlights a potential sharp drop in the price of Ethereum towards $1,400 if the current downward trend continues.
Strong Rejection From Key Fibonacci Zone Hints At Persistent Resistance
Technical analysis shows that the Ethereum price chart is currently characterized by a noticeable Fair Value Gap (FVG) on the 4-hour timeframe. This interesting gap was left behind after a steep 10% drop last Sunday, marking a strong area of seller dominance.
Related Reading
This gap represents a zone of clear imbalance where selling activity outweighs buying pressure and has influenced Ethereum’s price action throughout the past seven days. Earlier last week, Ethereum retraced into this gap, reaching the midpoint, but was met with swift rejection. This swift rejection showed the intense selling pressure present within this Fair Value Gap.
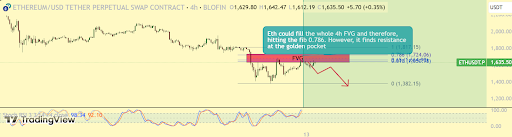
Interestingly, the Ethereum price has returned to this Fair Value Gap again, and another rejection here could send it back to a bottom below $1,400. Furthermore, Ethereum is trading within an area identified as the “golden pocket” of the Fibonacci extension indicator, which is drawn from the $1,383 bottom on April 9. Unless price action breaks decisively above this level and heads toward the next Fib level of 0.786 at $1,724, there is still a risk of a significant rejection that could lead to further downside below $1,400.
Stochastic RSI Weakness Suggests Possible Downturn Ahead For Ethereum
In addition to the Fair Value Gap and Ethereum’s struggle within the golden pocket of the Fibonacci retracement zone, the Stochastic RSI is now introducing another layer of bearish pressure to the current outlook. This momentum oscillator, which measures the relative strength of recent price movements, is approaching the overbought region on the daily timeframe.
Related Reading
Ethereum’s approach of overbought zone with the Stochastic RSI is due to inflows that have pushed the crypto’s price from the $1,383 bottom on April 9. Now that the Stochastic RSI is moving into the overbought zone, it adds to the bearish outlook that it could reject at the Fair Value Gap and start a new downside correction very soon.
So far, the Ethereum price was rejected at $1,650 in the past 24 hours, which further supports the bearish continuation thesis. If the selling pressure builds again, as suggested by both the weakening RSI and persistent resistance at the Fair Value Gap, the analyst warns of a breakdown that could drag the price to as low as $1,400, or even lower.
At the time of writing, Ethereum is trading at $1,627.
Featured image from Unsplash, chart from Tradingview.com
Source link


Cybersecurity researchers have shared details of a malware campaign targeting Ethereum, XRP, and Solana.
The attack mainly targets Atomic and Exodus wallet users through compromised node package manager (NPM) packages.
It then redirects transactions to attacker-controlled addresses without the wallet owner’s knowledge.
The attack begins when developers unknowingly install trojanized npm packages in their projects. Researchers identified “pdf-to-office” as a compromised package that appears legitimate but contains hidden malicious code.
Once installed, the package scans the system for installed cryptocurrency wallets and injects malicious code that intercepts transactions.
‘Escalation in targeting’
“This latest campaign represents an escalation in the ongoing targeting of cryptocurrency users through software supply chain attacks,” researchers noted in their report.
The malware can redirect transactions across multiple cryptocurrencies, including Ethereum (ETH), Tron-based USDT, XRP (XRP), and Solana (SOL).
ReversingLabs identified the campaign through their analysis of suspicious npm packages and detected multiple indicators of malicious behavior including suspicious URL connections and code patterns matching previously identified threats. Their technical examination reveals a multi-stage attack that uses advanced obfuscation techniques to evade detection.
The infection process begins when the malicious package executes its payload targeting wallet software installed on the system. The code specifically searches for application files in certain paths.
Once located, the malware extracts the application archive. This process is executed through code that creates temporary directories, extracts the application files, injects the malicious code, and then repacks everything to appear normal.
The malware modifies transaction handling code to replace legitimate wallet addresses with attacker-controlled ones using base64 encoding.
For example, when a user attempts to send ETH, the code replaces the recipient address with an attacker’s address decoded from a base64 string.
The impact of this malware can be tragic because transactions appear normal in the wallet interface while funds are being sent to attackers.
Users have no visual indication that their transactions have been compromised until they verify the blockchain transaction and discover funds went to an unexpected address.
Source link

AVAX Falls 2.1% as Nearly All Assets Trade Lower

What is a VTuber, and how do you become one in 2025?

Top Expert’s Update Sets $10 Target

How Academia Interacts With The Bitcoin Ecosystem

AB DAO and Bitget Launch Dual Reward Campaign, Distributing $2.6M Worth of $AB Globally

AI crypto tokens at risk as Nvidia faces restrictions on China exports

Coinbase Urges Australia to Vote for Crypto Progress in May

How High Would Pi Network Price Go If Pi Coin Adopts Transparency to Avoid Mantra Pitfalls

XRP’s ‘Rising Wedge’ Breakdown Puts Focus on $1.6 Price Support

China selling seized crypto to top up coffers as economy slows: Report

Ethereum Price Dips Again—Time to Panic or Opportunity to Buy?

The Inverse Of Clown World”

Bitcoin Indicator Flashing Bullish for First Time in 18 Weeks, Says Analyst Who Called May 2021 Crypto Collapse

3iQ and Figment to launch North America’s first Solana staking ETF

Bitcoin Miners Are Selling More BTC to Make Ends Meet: CryptoQuant


 24/7 Cryptocurrency News5 months ago
Arthur Hayes, Murad’s Prediction For Meme Coins, AI & DeFi Coins For 2025

 Bitcoin3 months ago
Expert Sees Bitcoin Dipping To $50K While Bullish Signs Persist

 24/7 Cryptocurrency News3 months ago
Aptos Leverages Chainlink To Enhance Scalability and Data Access

 Bitcoin5 months ago
Bitcoin Could Rally to $80,000 on the Eve of US Elections

 Opinion5 months ago
Crypto’s Big Trump Gamble Is Risky

 Altcoins3 months ago
Sonic Now ‘Golden Standard’ of Layer-2s After Scaling Transactions to 16,000+ per Second, Says Andre Cronje

 Bitcoin5 months ago
Institutional Investors Go All In on Crypto as 57% Plan to Boost Allocations as Bull Run Heats Up, Sygnum Survey Reveals

 Price analysis5 months ago
Ripple-SEC Case Ends, But These 3 Rivals Could Jump 500x
