Bitcoin
What Bitcoin Price History Predicts for February 2025
Published
3 months agoon
By
admin
As the Bitcoin market steps into 2025, investors are keenly analyzing seasonal trends and historical data to predict what February might hold. With Bitcoin’s cyclical nature often tied to its halving events, historical insights provide a valuable roadmap for navigating future performance. By examining historical data—including Bitcoin’s average monthly returns and its post-halving February performance—we aim to provide a clear picture of what February 2025 might look like.

Understanding Bitcoin’s Seasonality
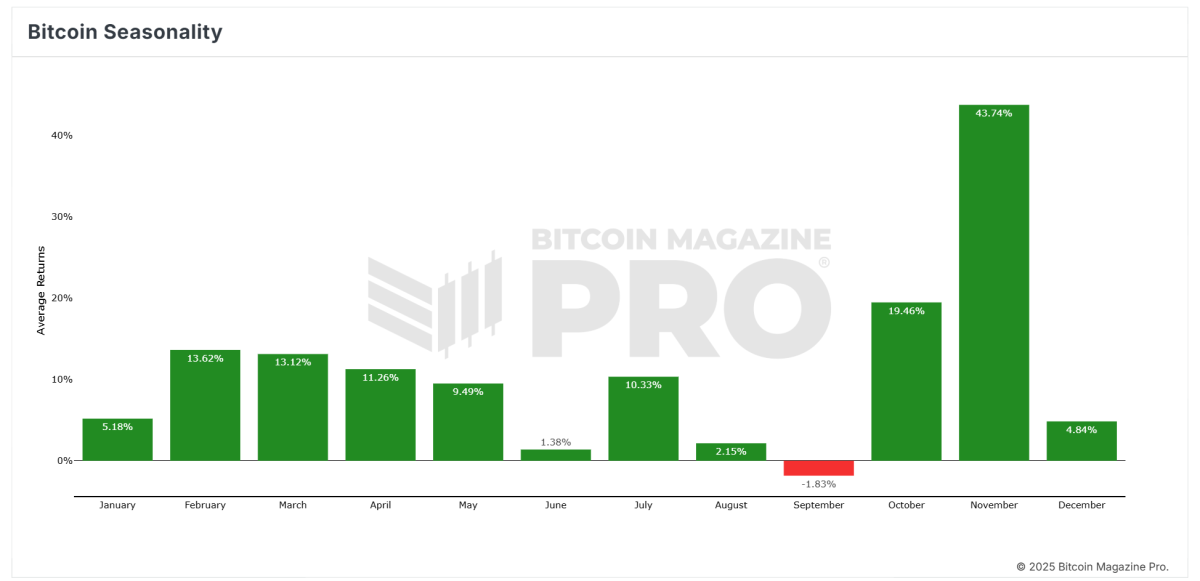
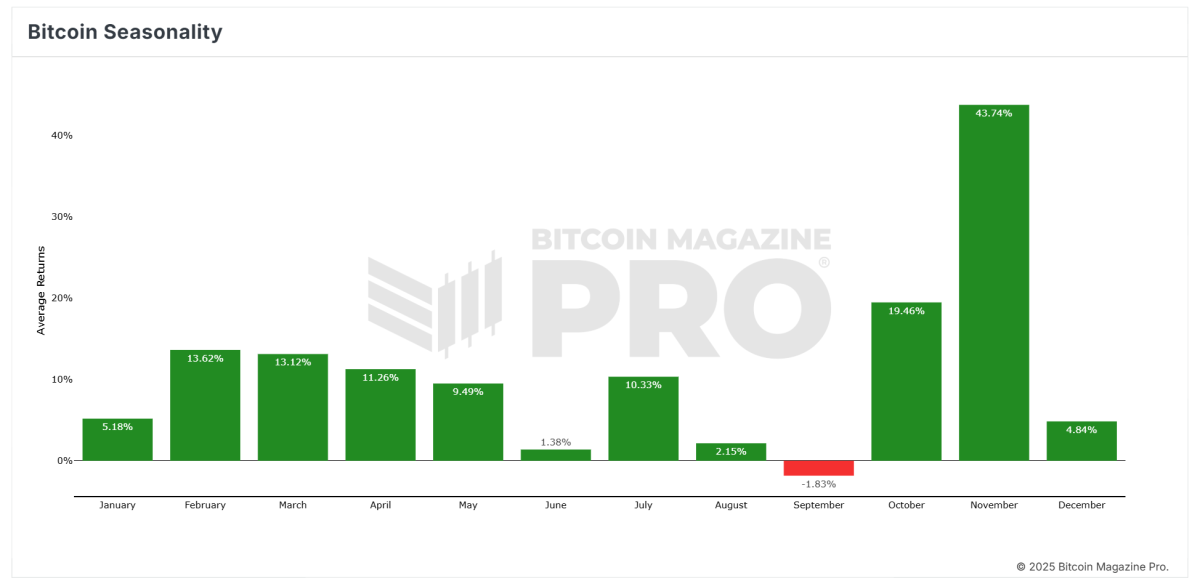
The first chart, “Bitcoin Seasonality,” highlights average monthly returns from 2010 to the latest monthly close. The data underscores Bitcoin’s best-performing months and its cyclical tendencies. February has historically shown an average return of 13.62%, ranking it as one of the stronger months for Bitcoin performance.
Notably, November stands out with the highest average return at 43.74%, followed by October at 19.46%. Conversely, September has historically been the weakest month with an average return of -1.83%. February’s solid average places it in the upper tier of Bitcoin’s seasonality, offering investors hope for positive returns in early 2025.

Historical Performance of February in Post-Halving Years
A deeper dive into Bitcoin’s historical February returns reveals fascinating insights for years that follow a halving event. Bitcoin’s halving mechanism—which occurs roughly every four years—reduces block rewards by half, creating a supply shock that has historically driven price increases. February’s performance in these post-halving years has consistently been positive:
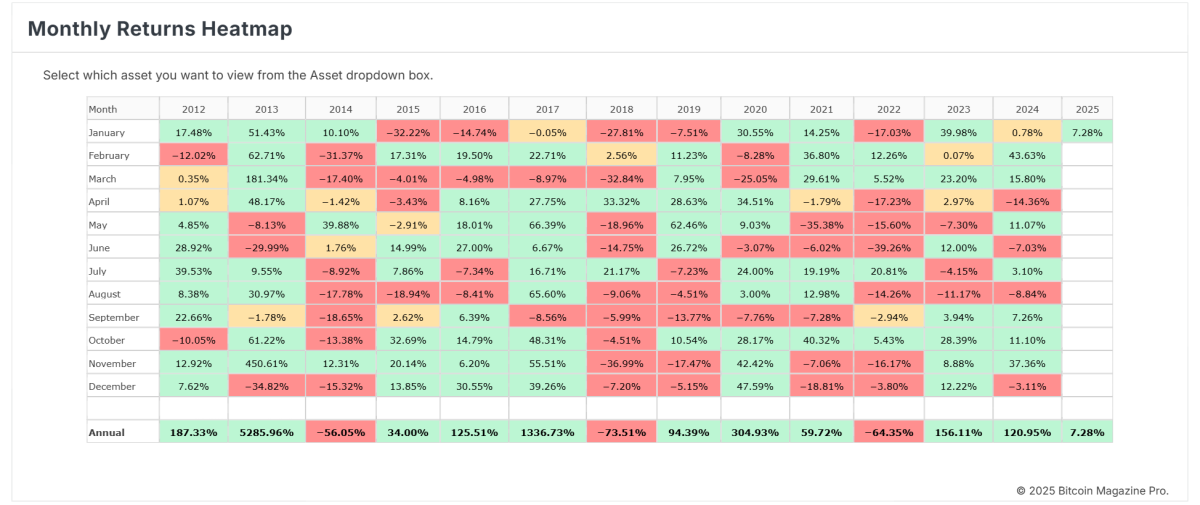
- 2013 (Post-2012 Halving): 62.71%
- 2017 (Post-2016 Halving): 22.71%
- 2021 (Post-2020 Halving): 36.80%
The average return across these three years is an impressive 40.74%. Each of these Februarys reflects the bullish momentum that often follows halving events, driven by reduced Bitcoin supply issuance and increased market demand.
Related: We’re Repeating The 2017 Bitcoin Bull Cycle
January 2025’s Performance Sets the Stage
While February 2025 is yet to unfold, the year began with a modest 7.28% return to date in January, as shown in the “Monthly Returns Heatmap.” January’s positive performance hints at a continuation of bullish sentiment in the early months of 2025, aligning with historical post-halving patterns. If February 2025 follows the trajectory of past post-halving years, it could see returns in the range of 22% to 63%, with an average expectation around 40%.
What Drives February’s Strong Post-Halving Performance?
Several factors contribute to February’s historical strength in post-halving years:
- Supply Shock: The halving reduces new Bitcoin supply entering circulation, increasing scarcity and driving price appreciation.
- Market Momentum: Investors often respond to the halving event with increased enthusiasm, pushing prices higher in the months following the event.
- Institutional Interest: In recent cycles, institutional adoption has accelerated post-halving, adding significant capital inflows to the market.
Key Takeaways for February 2025
Investors should approach February 2025 with cautious optimism. Historical and seasonal data suggest the month has strong potential for positive returns, particularly in the context of Bitcoin’s post-halving cycles. With an average return of 40.74% in past post-halving Februarys, investors might expect similar performance this year, barring any significant macroeconomic or regulatory headwinds.
Conclusion
Bitcoin’s history provides a valuable lens through which to view its future performance. February 2025 is shaping up to be another positive month, driven by the same post-halving dynamics that have historically fueled impressive gains. Combining historical data performance with a positive regulatory environment, the incoming pro-Bitcoin administration, and the news that The Financial Accounting Standards Board (FASB) has issued a new guideline (ASU 2023-08) fundamentally changing how Bitcoin is accounted for (Why Hundreds of Companies Will Buy Bitcoin in 2025), 2025 is shaping up to be a transformative year for Bitcoin. As always, investors should combine these insights with broader market analysis and remain prepared for Bitcoin’s inherent volatility.
Related: Why Hundreds of Companies Will Buy Bitcoin in 2025
By leveraging the lessons of history and the patterns of seasonality, Bitcoin investors can make informed decisions as the market navigates this pivotal year.
To explore live data and stay informed on the latest analysis, visit bitcoinmagazinepro.com.
Disclaimer: This article is for informational purposes only and should not be considered financial advice. Always do your own research before making any investment decisions.
Source link
You may like


Tariff Carnage Starting to Fulfill BTC’s ‘Store of Value’ Promise


The cost of innovation — Regulations are Web3’s greatest asset


Best Crypto to Buy as Derivatives Exchange CME Set to Launch XRP Futures


Metaplanet Buys Additional ¥1.92 Billion Worth Of Bitcoin


Here Are Four Signs the Stock Market Has Bottomed, According to Fundstrat’s Tom Lee


Bitcoin dips below $94,000 as ETFs record $3b weekly inflow
Bitcoin
Tariff Carnage Starting to Fulfill BTC’s ‘Store of Value’ Promise
Published
2 hours agoon
April 27, 2025By
admin
April has been a month of extreme volatility and tumultuous times for traders.
From conflicting headlines about President Donald Trump’s tariffs against other nations to total confusion about which assets to seek shelter in, it has been one for the record books.
Amid all the confusion, when traditional “haven assets” failed to act as safe places to park money, one bright spot emerged that might have surprised some market participants: bitcoin.
“Historically, cash (the US dollar), bonds (US Treasuries), the Swiss Franc, and gold have fulfilled that role [safe haven], with bitcoin edging in on some of that territory,” said NYDIG Research in a note.

NYDIG’s data showed that while gold and Swiss Franc had been consistent safe-haven winners, since ‘Liberation Day’—when President Trump announced sweeping tariff hikes on April 2, kicking off extreme volatility in the market—bitcoin has been added to the list.
“Bitcoin has acted less like a liquid levered version of levered US equity beta and more like the non-sovereign issued store of value that it is,” NYDIG wrote.
Zooming out, it seems that as the “sell America” trade gains momentum, investors are taking notice of bitcoin and the original promise of the biggest cryptocurrency.
“Though the connection is still tentative, bitcoin appears to be fulfilling its original promise as a non-sovereign store of value, designed to thrive in times like these,” NYDIG added.
Read more: Gold and Bonds’ Safe Haven Allure May be Fading With Bitcoin Emergence
Source link
Bitcoin
Bitcoin Continues To Flow Out Of Major Exchanges — Supply Squeeze Soon?
Published
12 hours agoon
April 27, 2025By
admin
Reason to trust

Strict editorial policy that focuses on accuracy, relevance, and impartiality
Created by industry experts and meticulously reviewed
The highest standards in reporting and publishing
Strict editorial policy that focuses on accuracy, relevance, and impartiality
Morbi pretium leo et nisl aliquam mollis. Quisque arcu lorem, ultricies quis pellentesque nec, ullamcorper eu odio.
It was quite the coincidence that the cryptocurrency market jolted back to life after Easter Sunday, with Bitcoin leading the way with more than a double-digit gain. While the price of BTC continues to hold above the critical $94,000 level, the premier cryptocurrency seems to be losing some momentum.
Unsurprisingly, investors appear to be increasingly confident in the promise of this recent rally, as significant amounts of BTC continue to make their way off major centralized exchanges over the past few days. Here’s how much investors have moved in the past few days.
Over 35,000 BTC Move Out Of Coinbase And Binance
In a Quicktake post on the CryptoQuant platform, crypto analyst João Wedson revealed that Binance, the world’s largest cryptocurrency exchange by trading volume, has seen increased activity over the past few days. The exchange netflow data shows that huge amounts of Bitcoin have been withdrawn from the platform in recent days.
Related Reading
According to CryptoQuant data, a total of 27,750 BTC (worth $2.63 billion at current price) was moved out of Binance on Friday, April 25. This latest round of withdrawals represents the third-largest net outflow in the centralized exchange’s history.
The movement of significant crypto amounts from exchanges, which offer services like selling to non-custodial wallets, suggests a potential shift in investor sentiment and strategy. Large exchange outflows often signal increased confidence of holders in the long-term potential of an asset.
Wedson noted that the recent outflows do not guarantee a price rally for Bitcoin, but they do signal strong institutional activity, which is often a precursor for major volatility. Citing China’s crypto ban in 2021, the crypto analyst highlighted how massive exchange outflows didn’t prevent the dump.

At the same time, Wedson mentioned that the continuous Bitcoin outflows over several days, like during the FTX collapse, preceded a price bottom and the eventual market recovery. Ultimately, the online pundit hinted at paying close attention to the overall trend of the exchange netflow rather than a single-day activity.
Similarly, more than 7,000 BTC (worth approximately $66.5 million) have made their way out of the Coinbase exchange. According to the CryptoQuant analyst Amr Taha, this negative exchange netflow could be an indicator of increased institutional activity, as Coinbase is known as the primary crypto vendor for US-based institutions.
Taha said:
These large outflows typically suggest accumulation by institutions or large investors, potentially signaling bullish sentiment.
The analyst outlined that if the dwindling exchange reserves correlate with an increased spot demand or ETF inflows, a supply squeeze could be on the horizon, potentially pushing the price to the upside.
Bitcoin Price At A Glance
As of this writing, the price of BTC sits just beneath $95,200, reflecting an almost 2% increase in the past 24 hours.
Related Reading
Featured image from iStock, chart from TradingView
Source link
Bitcoin
Bitcoin Perpetual Swaps Signal Short Bias Amid Price Rebound – Details
Published
20 hours agoon
April 26, 2025By
admin
The Bitcoin market saw another rebound in the past week as prices leaped by over 12% to hit a local peak of $95,600. Amid the ongoing market euphoria, prominent blockchain analytics company Glassnode has shared some important developments in the Bitcoin derivative markets.
Bitcoin Short Bets Rise Despite Price Rally, Setting Stage For Volatility
Despite a bullish trading week, derivative traders are approaching the Bitcoin market with skepticism, as evidenced by a build-up of leveraged short positions.
In a recent X post on April 25, Glassnode reported that Open Interest (OI) in Bitcoin perpetual swaps climbed to 218,000 BTC, marking a 15.6% increase from early March. In line with market activity, this rise in Open Interest aligns with increased leverage, introducing the potential for market volatility via liquidations or stop-outs.
Generally, a rise in Open Interest amidst a price rally is expected to signal long-term market confidence. However, Glassnode’s findings have revealed an opposite scenario. Despite Bitcoin’s bullish strides in the past week, short market positions appear to be dominating the perpetual futures markets.
This concerning development is indicated by a decline in the average funding rate, which has now slipped into negative territory to sit around -0.023%. The perpetual funding rate is a periodic payment between long and short traders aimed at keeping the contract price in line with the underlying spot price.
A negative funding rate indicates short traders pay long traders as Bitcoin’s perpetual contract price is trading below the spot price. This is caused by a higher number of short positions as traders are largely bearish about Bitcoin, even despite recent gains.
Furthermore, the 7-day moving average (7DMA) of long-side funding premiums has dropped to $88,000 per hour, reinforcing this short-dominant sentiment. This downtrend indicates a waning demand for long positions, as traders exhibit a short bias.
However, Glassnode presents a bullish note stating that the present combination of rising leverage and short positions paves the way for a potential short squeeze, where an unexpected upward price move forces short-sellers to close their positions, thereby driving prices even higher.
Bitcoin Price Overview
At the time of writing, Bitcoin trades at $94,629 following a 1.01% retracement from its local peak price on April 25. Despite creeping developments in the perpetual futures market, the BTC market remains highly bullish, indicated by gains of 1.02%, 11.12%, and 8.32% in the last one, seven, and thirty days, respectively. With a market cap of $1.88 trillion, the premier cryptocurrency ranks as the largest digital asset and fifth-largest asset in the world.
Related Reading: Ethereum To Hit $5k Before Its 10th Birthday, Justin Sun Says
Source link

Tariff Carnage Starting to Fulfill BTC’s ‘Store of Value’ Promise

The cost of innovation — Regulations are Web3’s greatest asset

Best Crypto to Buy as Derivatives Exchange CME Set to Launch XRP Futures

Metaplanet Buys Additional ¥1.92 Billion Worth Of Bitcoin

Here Are Four Signs the Stock Market Has Bottomed, According to Fundstrat’s Tom Lee

Bitcoin dips below $94,000 as ETFs record $3b weekly inflow

Bitcoin Post-Halving Price Performance Is the Worst on Record. Why?

Expert Predicts Start Date For Pi Network Price Pump

GameFi Tokens Show Signs of Life After Gala Games, White House Tie-Up

Bitcoin trades at ‘40% discount’ as spot BTC ETF buying soars to $3B in one week

Bitcoin Continues To Flow Out Of Major Exchanges — Supply Squeeze Soon?

BlackRock’s Bitcoin ETF Sees $643 Million Inflows

DePIN Altcoin Outpaces Crypto Market and Skyrockets by Nearly 44% Following High-Profile Exchange Listing

Solaxy, BTC bull token, and Pepeto gaining momentum as leading 2025 presale tokens

Australian Radio Station Used AI DJ For Months Before Being Discovered

Arthur Hayes, Murad’s Prediction For Meme Coins, AI & DeFi Coins For 2025

Expert Sees Bitcoin Dipping To $50K While Bullish Signs Persist

3 Voting Polls Show Why Ripple’s XRP Price Could Hit $10 Soon

Aptos Leverages Chainlink To Enhance Scalability and Data Access

Bitcoin Could Rally to $80,000 on the Eve of US Elections

Crypto’s Big Trump Gamble Is Risky

Sonic Now ‘Golden Standard’ of Layer-2s After Scaling Transactions to 16,000+ per Second, Says Andre Cronje

Institutional Investors Go All In on Crypto as 57% Plan to Boost Allocations as Bull Run Heats Up, Sygnum Survey Reveals

The Future of Bitcoin: Scaling, Institutional Adoption, and Strategic Reserves with Rich Rines

Ripple-SEC Case Ends, But These 3 Rivals Could Jump 500x

Has The Bitcoin Price Already Peaked?

A16z-backed Espresso announces mainnet launch of core product

Xmas Altcoin Rally Insights by BNM Agent I

Blockchain groups challenge new broker reporting rule

I’m Grateful for Trump’s Embrace of Bitcoin
Trending

 24/7 Cryptocurrency News6 months ago
Arthur Hayes, Murad’s Prediction For Meme Coins, AI & DeFi Coins For 2025

 Bitcoin3 months ago
Expert Sees Bitcoin Dipping To $50K While Bullish Signs Persist

 Ripple Price1 month ago
3 Voting Polls Show Why Ripple’s XRP Price Could Hit $10 Soon

 24/7 Cryptocurrency News4 months ago
Aptos Leverages Chainlink To Enhance Scalability and Data Access

 Bitcoin6 months ago
Bitcoin Could Rally to $80,000 on the Eve of US Elections

 Opinion6 months ago
Crypto’s Big Trump Gamble Is Risky

 Altcoins3 months ago
Sonic Now ‘Golden Standard’ of Layer-2s After Scaling Transactions to 16,000+ per Second, Says Andre Cronje

 Bitcoin5 months ago
Institutional Investors Go All In on Crypto as 57% Plan to Boost Allocations as Bull Run Heats Up, Sygnum Survey Reveals


