
analysis
Will December Surpass November’s Record-Breaking Bitcoin Price Increase?

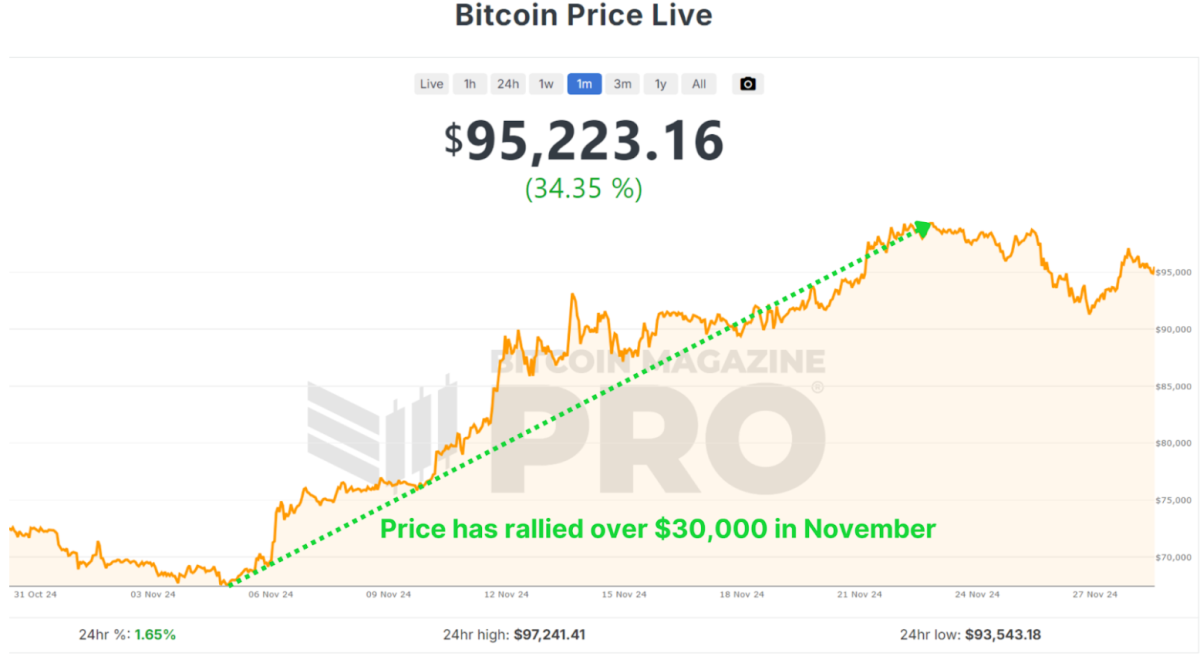
Bitcoin is closing out one of its most remarkable months in history, surging over $30,000 in November and marking a renewed bullish sentiment in the market. As we look ahead to December and beyond, investors are eager to understand whether Bitcoin’s momentum can sustain itself into 2025. With macroeconomic conditions, historical trends, and on-chain data aligning in Bitcoin’s favor, let’s analyze what’s happening and what it could mean for the future.
November’s Record-Breaking Performance
November 2024 wasn’t just any month for Bitcoin; it was historic. Bitcoin’s price rose from around $67,000 to nearly $100,000, an approximate 50% peak-to-trough increase, making it the best-performing month ever in terms of dollar increase. This rally rewarded long-term holders who endured months of consolidation after Bitcoin’s all-time high of $74,000 earlier in the year.

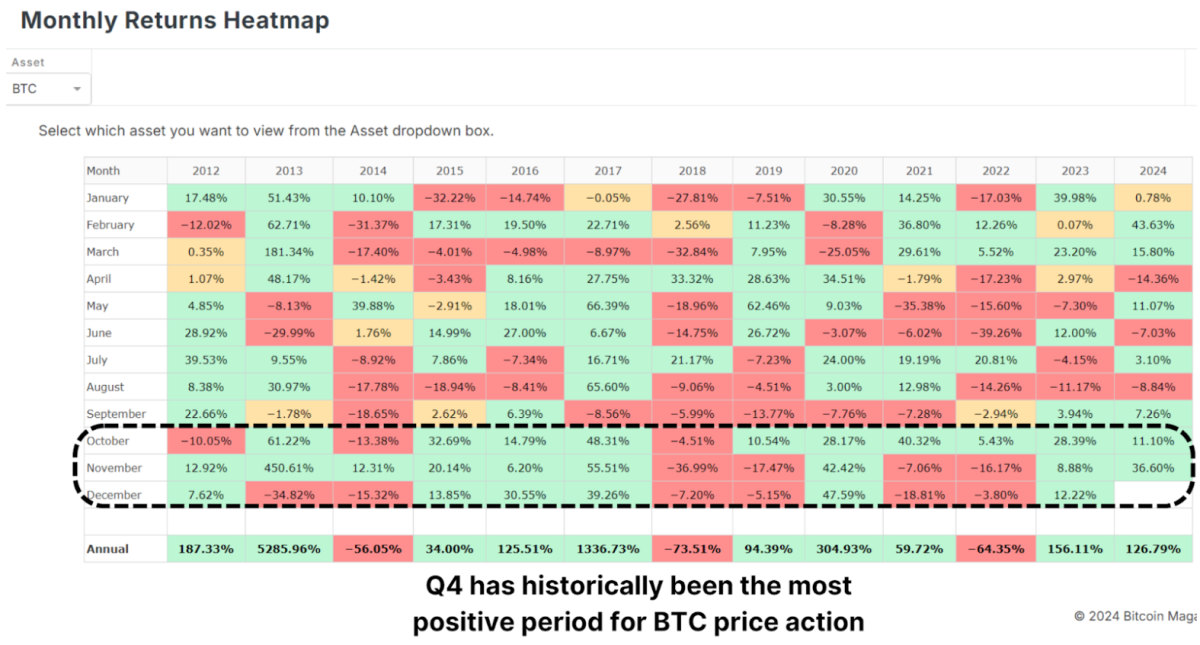
Historically, Q4 is Bitcoin’s strongest quarter, and November has often been a standout month. December, which has also performed well in past bull cycles, presents a promising outlook. But as with any rally, some short-term cooling might be expected.
The Role of the Dollar and Global Liquidity
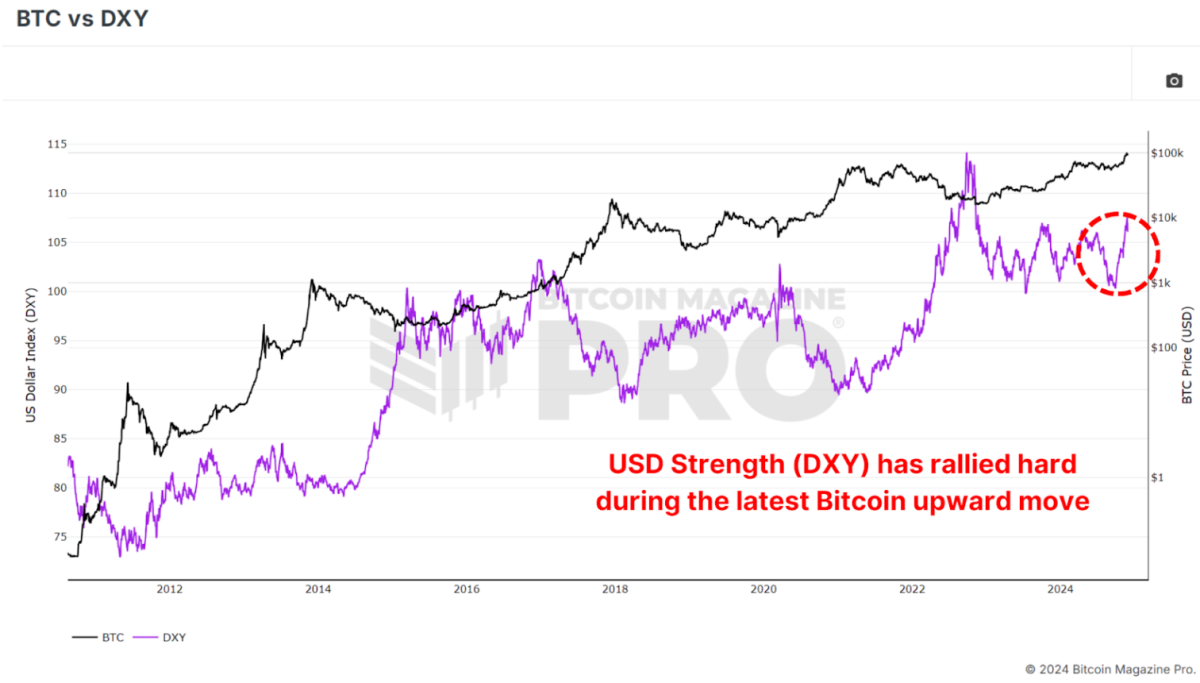
Interestingly, Bitcoin’s rise occurred against the backdrop of a strengthening U.S. Dollar Strength Index (DXY), a scenario that typically sees Bitcoin underperforming. Historically, Bitcoin and the DXY have maintained an inverse relationship: when the dollar strengthens, Bitcoin weakens, and vice versa.
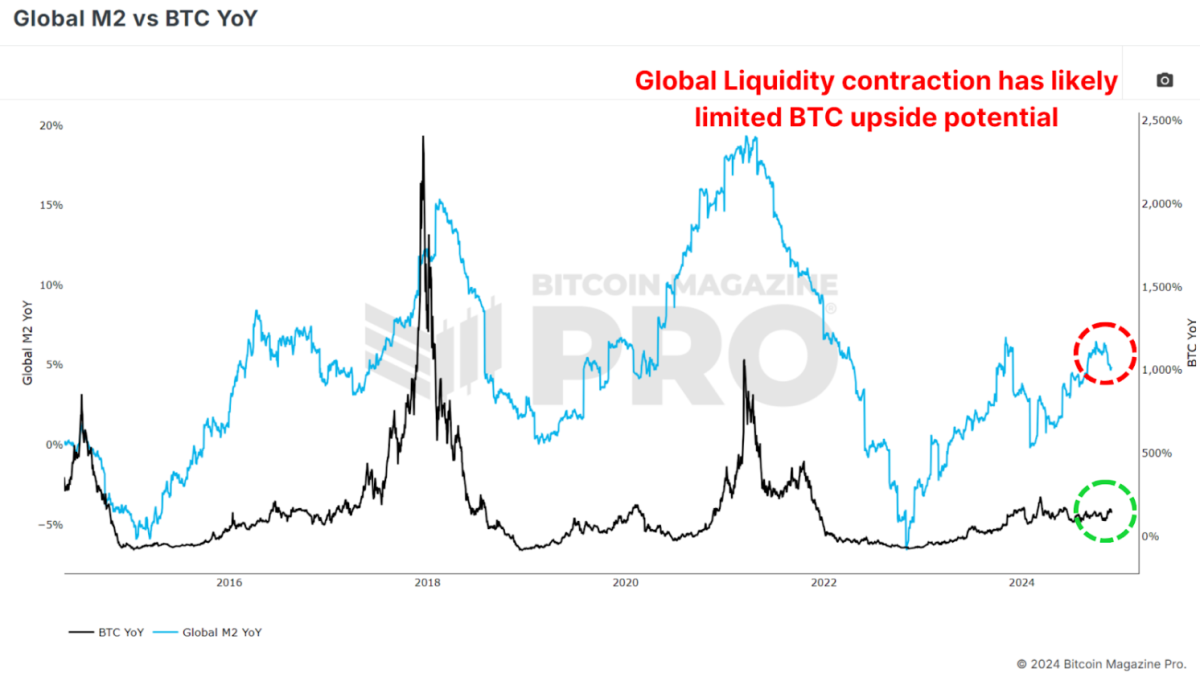
Similarly, the Global M2 money supply, another key metric, has shown a slight contraction recently. Bitcoin has historically correlated positively with global liquidity; thus, its current performance defies expectations. If liquidity conditions improve in the coming months, this could act as a powerful tailwind for Bitcoin’s price.
Parallels to Past Bull Cycles
Bitcoin’s current trajectory is strikingly similar to past bull markets, particularly the 2016–2017 cycle. That cycle began with gradual price increases before breaking key resistance levels and entering an exponential growth phase.
In 2017, Bitcoin’s price broke out from a key technical level of around $1,000, leading to a parabolic rally that peaked at $20,000, a 20x increase. Similarly, the 2020-2021 cycle saw Bitcoin rise from $20,000 to nearly $70,000 after breaking above the crucial YoY Performance threshold.
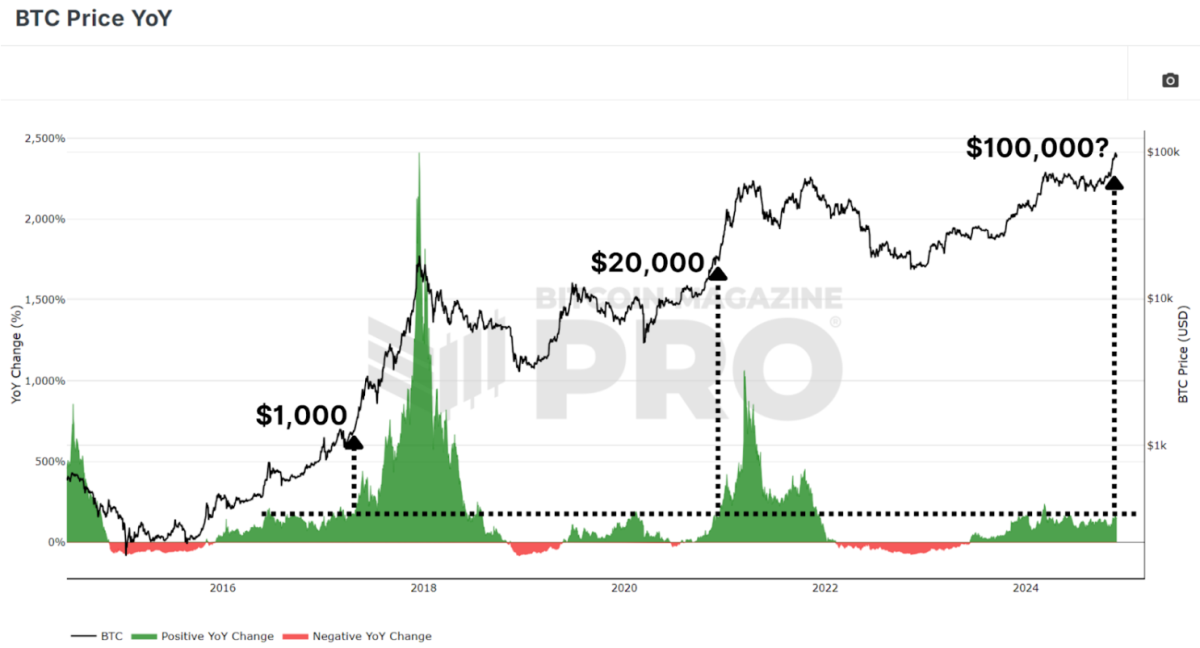
If Bitcoin can break out decisively from this historic level and above the key $100,000 resistance, we may witness a repeat of these explosive price movements as BTC enters its exponential phase of bullish price action.
Institutional Adoption and Accumulation
A key factor underpinning Bitcoin’s strength is the continued accumulation by institutions. Bitcoin ETFs are adding billions of dollars worth of BTC to their holdings, and corporations like MicroStrategy have doubled down on their Bitcoin strategy, now holding close to 400,000 BTC. Even with BTC rallying to new all-time highs, ‘smart money’ is scrambling to accumulate as much as possible to ensure they’re not left behind.
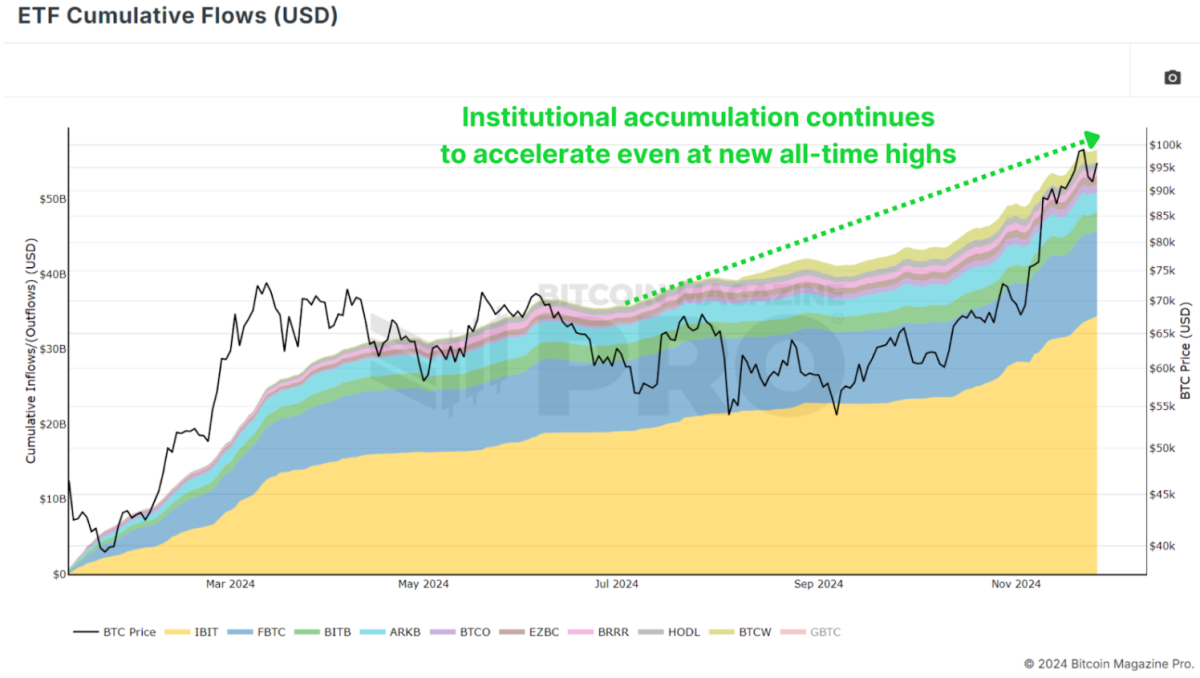
This institutional demand indicates growing confidence in Bitcoin as a long-term store of value, even in volatile market conditions. Such accumulation also tightens the available supply, creating upward pressure on prices as demand increases.
Conclusion
While December has historically been a strong month for Bitcoin, short-term volatility could temper gains as the market digests November’s sharp rally. Although given the aggressive accumulation we’re witnessing from institutional participants anything is possible.
Longer-term, however, the outlook remains exceptionally bullish. The obvious level to watch is $100,000 as the next major milestone, which, if breached, could pave the way for a much larger rally in 2025. Bitcoin is entering one of its most exciting phases yet, with the stars seemingly aligning across macroeconomic, technical, and on-chain metrics.
For a more in-depth look into this topic, check out a recent YouTube video here: The BIGGEST Bitcoin Month EVER – So What Happens Next?
 Black Friday: Our Biggest Ever Sale
The BEST saving of the year is here. Get 40% Off all our annual plans.

- Unlock +100 Bitcoin charts.
- Access Indicator alerts – so you never miss a thing.
- Private TradingView indicators of your favorite Bitcoin charts.
- Members-only Reports and Insights.
- Many new charts and features coming soon.
All for just $15/month with the Black Friday deal. This is our biggest sale all year.
UPGRADE YOUR BITCOIN INVESTING NOW
Don’t miss out!  https://www.bitcoinmagazinepro.com/subscribe/
Source link


Bitcoin (BTC) fell to a four-month low of $74,500 on April 7, and data suggests that the price may not have bottomed yet.
Investors dumped risk assets after US President Donald Trump doubled down on his plan to impose global tariffs over the weekend, triggering a $9.5 trillion wipeout in global equity markets.

BTC/USD vs. TOTAL crypto market cap, S&P 500, and MSCI World index one-year performance. Source: TradingView
Growing calls for a US recession have spooked risk investors while leaving crypto market participants wondering how low can the Bitcoin price go in the near future.
Bitcoin eyes decline toward “Saylor’s average entry“ level
Bitcoin is currently testing a critical technical level—the 50-week exponential moving average (50-week EMA)—which has historically acted as a dividing line between bull and bear phases.
According to market analyst Ted Pillows and numerous other chartists, Bitcoin must reclaim the EMA, currently near $77,500, to avoid a deeper correction.

BTC/USD weekly price chart. Source: TradingView/Ted Pillows
If BTC fails to close back above it, Pillows warns of a potential decline toward the $69,000–$70,000 range, which aligns with the 2021 cycle highs. A further drop to $67,000, the average entry-level of Strategy’s Michael Saylor, also remains a possibility.

Source: @ChrisTradesXYZ
Bitcoin “max pain” target is near $69,000
Bitcoin appeared to have found short-term support at around $74,000, which corresponds to a notable cost-basis cluster where over 50,000 BTC are held.
Glassnode’s UTXO realized price distribution (URPD) heatmap shows this is the first major cost-basis cluster below $80,000. These holders raised their average buy price until March 10, then stopped moving coins—showing confidence, not panic.

Bitcoin URPD heatmap. Source: Glassnode
Investors hold around 175,000 BTC in the $74,000–$70,000 range, creating a strong buffer zone. The largest cluster sits at $71,600, with 41,000 BTC concentrated there, making it the likely next support if $74,000 breaks.
Related: Black Monday 2.0? 5 things to know in Bitcoin this week
Meanwhile, Glassnode’s Short-Term Holder (STH) realized price bands place the current average STH cost basis at $89,000, with the -1 standard deviation band at $69,000.

Bitcoin STH onchain cost basis bands. Source: Glassnode
This level has acted as a historical “max pain” zone for short-term investors during pullbacks in previous bull cycles, suggesting the $69,000 level is a floor where weak hands capitulate and long-term investors often step in.
A $50,000 Bitcoin price target cannot be ruled out
Historical patterns reveal Bitcoin entering a prolonged bear market after breaking decisively below the 50-week EMA support. In most cases, such corrections have led the price toward the 200-week EMA, as shown in red circular areas below.

BTC/USD weekly price chart. Source: TradingView
If the fractal analysis plays out as intended, Bitcoin’s price target in the event of a 50-week EMA breakdown appears to be around $50,000, aligning with the 200-week EMA’s current positioning.
This article does not contain investment advice or recommendations. Every investment and trading move involves risk, and readers should conduct their own research when making a decision.
Bitcoin (BTC) price has been consolidating within a roughly $5,500 range since March 9 as the $84,000 level represents stiff overhead resistance. Data from Cointelegraph Markets Pro and Bitstamp shows BTC price oscillating between $78,599 and $84,000, as shown in the chart below. BTC/USD daily chart. Source: Cointelegraph/TradingView Key reasons why Bitcoin price remains flat today include: Trump’s trade war tensions causing uncertainty in the market. Weakening demand for Bitcoin and neutral funding rates. BTC price remains pinned below the 200-day SMA. Bitcoin’s price stagnation is partially due to the broader economic and geopolitical factors that are currently at play. What to know: Trump’s new policies, such as his proposed trade tariffs on Mexico and Canada, have unnerved the market. Investors, wary of inflation concerns and a potential tariff war, are avoiding risk assets like Bitcoin. As Cointelegraph recently reported, Bitcoin’s rally post-Trump’s November election has lost steam amid a weakening global economy. This has resulted in weaker demand for Bitcoin, according to Glassnode. For instance, the cost basis of 1w–1m short-term holders flattened out above that of the longer-term holders (1m–3m) in Q1, “marking an early sign of weakening demand in the immediate term.” Related: Bitcoin price drops 2% as falling inflation boosts US trade war fears Bitcoin’s drop below the $95,000 level saw the 1w–1m cost basis slide below the 1m–3m cost basis, “confirming a transition into net capital outflows.” Glassnode noted: “This reversal indicates that macro uncertainty has spooked demand, reducing new inflows… and suggests that new buyers are now hesitant to absorb sell-side pressure, reinforcing the shift from post-ATH euphoria into a more cautious market environment.” Bitcoin STH capital flow. Source: Glassnode Until the current trend changes due to macroeconomic tailwinds, such as Fed rate cuts, Bitcoin could struggle to break out of the current range, leaving it vulnerable to pullbacks toward $70,000. Another clear signal of Bitcoin’s stagnation is in the perpetual futures funding rates. BTC funding rates, which reflect the cost of holding long or short positions in crypto futures, are hovering close to 0%, indicating increasing indecisiveness among traders. Bitcoin perpetual futures funding rates across all exchanges. Source: Glassnode Without speculative fuel, Bitcoin is struggling to move in either direction, leaving its price stuck in a tight range as traders wait for the next catalyst. Bitcoin also trades below key resistance areas, as shown in the chart below: On March 9, BTC fell below the 200-day simple moving average (SMA) at $83,736. This trendline has stifled the latest efforts for a sustained recovery. BTC/USD daily chart. Source: Cointelegraph/TradingView Popular crypto analyst Daan Crypto Trades says that the 200-day SMA at around $83,700 and the 200-day EMA at $86,000 are key levels as they are “solid indicators of the mid/long term trend and overall strength of the market.” In other words, failure to produce a decisive close above the 200-day SMA and flipping it into a new support level could lead to a longer consolidation period for Bitcoin price. This article does not contain investment advice or recommendations. Every investment and trading move involves risk, and readers should conduct their own research when making a decision. On Friday, cryptocurrency exchange Bybit was allegedly hacked by North Korea’s Lazarus group, which drained nearly $1.4 billion in ether (ETH) from the exchange. Following the hack, Arthur Hayes, BitMEX co-founder and claiming to be a major ether (ETH) holder, wrote a post on X to Ethereum co-founder Vitalik Buterin on whether he will “advocate to roll back the chain to help @Bybit_Official.” Meanwhile, in an X spaces session, Bybit’s CEO Ben Zhou revealed that his team had also reached out to the Ethereum Foundation to see if it was something the network would consider, noting that such a decision should be based on what the network’s community wants. Hayes’s post immediately provoked a fierce reaction from the Ethereum community, which was firm in its belief that it wouldn’t happen. Some even questioned whether the BitMEX founder was joking. CoinDesk reached out to Hayes over X to clarify his comments. Ethereum members, like the core developer teams, are vastly against “rolling back” the network because it would override core elements of decentralization. If Buterin decided on his own that it would happen, then that would be seen as the end of Ethereum’s ethos, which heavily involves various developer teams and other community members when it comes to the health and state of the blockchain. “Rolling back the chain would give ETH no purpose. What’s the point if you can just change rules,” said user @the_weso in a post on X. Some outside the Ethereum community pointed to the 2016 DAO hack as an example when $60 million in ETH was stolen. The network went forward with a hard fork, splitting the old network into two, and the new chain continued on as Ethereum. That hard fork was not a “rollback,” though; it was known as an “irregular state transition.” Ethereum technically can’t “roll back” the network because it relies on an account model, where accounts hold users’ ETH. At the time of the hack, developers upgraded their nodes to a new client or software. Those who didn’t upgrade their nodes were still on the old chain, which became known as Ethereum Classic. When the nodes upgraded to the new software, the stolen ETH could move from one Ethereum account address to the next. “The ‘irregular state change’ that they implemented at the time of the DAO hard fork was this: they airlifted all the ETH in the DAO smart contracts out to a refund contract that would send you 1 ETH for every 100 DAO tokens you sent in,” wrote Laura Shin of Unchained in a post on X. Arthur Hayes, Murad’s Prediction For Meme Coins, AI & DeFi Coins For 2025 Expert Sees Bitcoin Dipping To $50K While Bullish Signs Persist Aptos Leverages Chainlink To Enhance Scalability and Data Access Bitcoin Could Rally to $80,000 on the Eve of US Elections Crypto’s Big Trump Gamble Is Risky Sonic Now ‘Golden Standard’ of Layer-2s After Scaling Transactions to 16,000+ per Second, Says Andre Cronje Institutional Investors Go All In on Crypto as 57% Plan to Boost Allocations as Bull Run Heats Up, Sygnum Survey Reveals Ripple-SEC Case Ends, But These 3 Rivals Could Jump 500x
Source link 
Broader economic uncertainty, weakening demand
Bitcoin price faces stiff resistance on the upside
Source link 

Source link 
Apple Delists 14 Crypto Apps in South Korea Including KuCoin and MEXC Exchanges Amid Regulatory Crackdown

Athens Exchange Group eyes first onchain order book via Sui

Futureverse Acquires Candy Digital, Taps DC Comics and Netflix IP to Boost Metaverse Strategy
![]()
Court Grants Ripple And SEC’s Joint Motion To Suspend Appeal

AVAX Falls 2.1% as Nearly All Assets Trade Lower

What is a VTuber, and how do you become one in 2025?

Top Expert’s Update Sets $10 Target

How Academia Interacts With The Bitcoin Ecosystem

AB DAO and Bitget Launch Dual Reward Campaign, Distributing $2.6M Worth of $AB Globally

AI crypto tokens at risk as Nvidia faces restrictions on China exports

Coinbase Urges Australia to Vote for Crypto Progress in May

How High Would Pi Network Price Go If Pi Coin Adopts Transparency to Avoid Mantra Pitfalls

XRP’s ‘Rising Wedge’ Breakdown Puts Focus on $1.6 Price Support

China selling seized crypto to top up coffers as economy slows: Report

Ethereum Price Dips Again—Time to Panic or Opportunity to Buy?

Arthur Hayes, Murad’s Prediction For Meme Coins, AI & DeFi Coins For 2025

Expert Sees Bitcoin Dipping To $50K While Bullish Signs Persist

Aptos Leverages Chainlink To Enhance Scalability and Data Access

Bitcoin Could Rally to $80,000 on the Eve of US Elections

Crypto’s Big Trump Gamble Is Risky

Sonic Now ‘Golden Standard’ of Layer-2s After Scaling Transactions to 16,000+ per Second, Says Andre Cronje

Institutional Investors Go All In on Crypto as 57% Plan to Boost Allocations as Bull Run Heats Up, Sygnum Survey Reveals

Ripple-SEC Case Ends, But These 3 Rivals Could Jump 500x

3 Voting Polls Show Why Ripple’s XRP Price Could Hit $10 Soon

Has The Bitcoin Price Already Peaked?

A16z-backed Espresso announces mainnet launch of core product

The Future of Bitcoin: Scaling, Institutional Adoption, and Strategic Reserves with Rich Rines

Xmas Altcoin Rally Insights by BNM Agent I

Blockchain groups challenge new broker reporting rule

I’m Grateful for Trump’s Embrace of Bitcoin


