
ETH Price
Will Ethereum Price Reach $5,000 In First 3 Months of 2025?

For Ethereum (ETH) price to hit $5,000, it would need to rally approximately 46% from $3,415.4, where ETH currently trades. Considering that ETH shot up 71% in just 30 days starting on November 5, there is a high chance Ethereum price will hit $5,000 in the first three months of 2025.
Ethereum is up 2.46% in the past 24 hours and will likely continue this bullish outlook.

Can Ethereum Hit $5,000 in First Three Months of 2025?
As mentioned above, Ethereum price can hit $5,000 in the first three months of 2025. ETH’s historical returns show that the first quarter has yielded an average return of 82.72% in the past eight years. Therefore, if history were to repeat, then 82.72% from the current price of $3,415.4, Ethereum would be trading at roughly $6,276.

Let’s explore what technical analysis has to say about Ethereum price in the short term.
ETH Technical Analysis
From a price action perspective, Ethereum is stuck between the $3,600 and $3,000 barriers. Only a swift breakout relative to these levels will confirm the trend. To make matters worse, ETH’s value has been stuck inside a symmetrical triangle for the past two weeks.
The recent uptick in Bitcoin’s price has revived optimism after weeks of consolidation. Many top altcoins have bounced up double digits. As a result, investors are bullish and expect Ethereum to follow suit.
Ethereum Price Targets
Although the symmetrical triangle breakout direction is uncertain, let’s assume a bullish one, considering the recent recovery. A decisive daily candlestick close above the triangle’s upper limit forecasts a 12% move to $3,800. This target is the result of adding the symmetrical triangle’s 12% height to the breakout point of $3,445.
Concluding Thoughts
With a fresh start to 2025, the outlook shows promise, especially for Ethereum and altcoins. With historical returns averaging 82.72% in the first quarter of the past eight years, it is highly likely that Ethereum will unpause the consolidation and kickstart an uptrend. ETH is already up 3% on the day, and technical analysis indicate a bullish future. All of these signs suggests that Ethereum price will easily tackle the $4,000 hurdle and reach $5,000, a key psychological level, in the first three months of 2025.
Source link


Reason to trust
![]()
Strict editorial policy that focuses on accuracy, relevance, and impartiality
Created by industry experts and meticulously reviewed
The highest standards in reporting and publishing
Strict editorial policy that focuses on accuracy, relevance, and impartiality
Morbi pretium leo et nisl aliquam mollis. Quisque arcu lorem, ultricies quis pellentesque nec, ullamcorper eu odio.
The Ethereum price action is raising red flags among analysts, with technical indicators pointing toward a potential crash to the $2,000 level. Despite experiencing a significant uptick recently following Bitcoin’s price surge, concerns continue to grow that a deeper correction may be unfolding.
Ethereum Price Crash To $2,000 Imminent
Based on a new report by Master Ananda, a TradingView crypto analyst, the Ethereum market is flashing warning signs as its price struggles below the critical resistance zone. At press time, Ethereum is trading at approximately $2,605 after being rejected from a local high of around $2,788.
Related Reading
Ethereum’s 4-hour chart presented by Master Ananda shows that the top altcoin has likely completed a short-term top, and now a corrective move is in play. The analysis hints at a looming price crash, with technical forecasts suggesting a retracement toward the $2,000 level or lower before the next bullish impulse.
The analyst’s bearish continuation thesis appears to be a high-probability setup, with Ethereum expected to revisit lower Fibonacci retracement levels. Notably, the chart reveals a subtle bearish divergence forming as the price pushed slightly higher in May but with diminishing momentum. This, in turn, created a rising resistance line while volume and price action failed to confirm new highs.
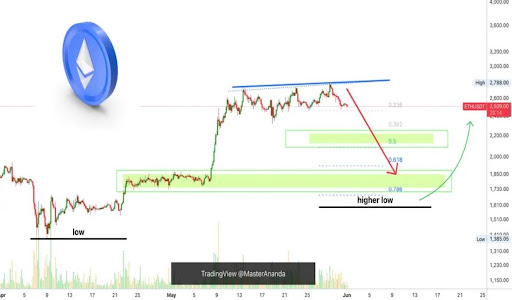
Noticeably, Ethereum’s price has since broken below the 0.230 Fibonacci level, signaling the possible start of a broader correction phase. The next probable support areas lie at $2,280 (0.382 Fib), $2,085 (0.5 Fib), and most significantly, the $1,900 price point at the 0.618 Fib Retracement level.
The highlighted green zones in Master Ananda’s chart represent potential support and buying areas, which point to the $1,900 to $1,735 (0.618-0.786 Fib) range as the most likely zone for a higher low to form. The previous major low occurred on April 7, and the expectation is that this correction will end above that level. Until then, a short-term correction remains the most likely scenario, and traders are warned to take caution as the chart further highlights a possibly more resounding crash to $1,385.
ETH Trade Strategy: Buy The Dip And Go Long
While sharing his bearish thesis for Ethereum, Master Ananda also provided a clear strategy for investors and traders. He advised long-term holders to wait patiently for the projected drop and assess the support reaction before looking for clear reversal signals.
Related Reading
Buying into support zones like $1,900 or even as low as $1,736 could provide optimal entry points for long-term positions. While bears may still attempt to short the market, Master Ananda assures that the downside remains limited.
The analyst emphasizes the importance of planning and avoiding impulsive trading by creating ideal entry and exit points while respecting the prevailing market trend. With Ethereum’s bullish outlook still intact, this projected price crash could become an opportunity for many traders instead of a threat.
Featured image from Getty Images, chart from Tradingview.com
Source link

Reason to trust
![]()
Strict editorial policy that focuses on accuracy, relevance, and impartiality
Created by industry experts and meticulously reviewed
The highest standards in reporting and publishing
Strict editorial policy that focuses on accuracy, relevance, and impartiality
Morbi pretium leo et nisl aliquam mollis. Quisque arcu lorem, ultricies quis pellentesque nec, ullamcorper eu odio.
According to a fresh analysis by a crypto analyst, the Ethereum price has broken out of a months-long downtrend, reigniting bullish sentiment across the market. With volume rising and key resistance levels expected to turn into support, Ethereum is set to complete its bullish structure, aiming for a potential break toward $3,000.
Ethereum Price Targets $3,000 Breakout
The Ethereum price action on the 4-hour chart has reportedly flipped bullish, following a sharp breakout above a long-standing descending trendline that capped its movements since late 2024. As a result, a pseudonymous TradingView crypto analyst identified as ‘Orihadad66’ has predicted that Ethereum could soon see a surge to $3,000.
Related Reading
The analyst explains that Ethereum’s recent shift from bearish to bullish wasn’t a subtle move, as a high-volume candle had pierced through both the trendline and the $2,100 – $2,150 resistance zone, confirming a clearer shift in market structure. This breakout is significant, as it marks the first time Ethereum has invalidated the broader bearish pattern that dominated the early part of 2025.
The $2,100 – $2,150 area now acts as a potential support zone for its price, and a successful retest would solidify it as a launchpad for further upside. Orihadad66 has confirmed that the immediate bullish target for Ethereum lies between the $2,500 – $2,550 price range. Historically, this region has been a key liquidity zone where previous price rejections frequently occurred. This makes the zone a potential profit-taking area as ETH consolidates post-breakout.
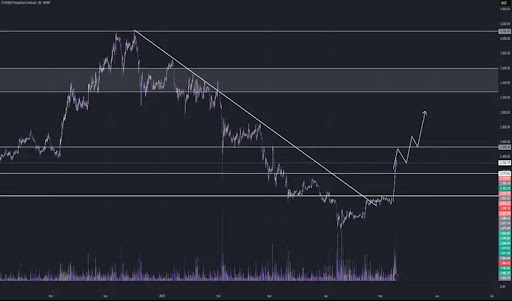
Technical projections suggest that Ethereum may briefly pull back toward the $2,350 – $2,400 range to form a potential higher low. If this pullback holds, bulls could drive the next leg up toward $2,800 – $3,000 — a confluence zone that includes both a supply barrier and psychological resistance.
Furthermore, the TradingView analyst has predicted that a clean break above $3,000 could open the door to the $3,300 – $3,600 supply block, potentially triggering a larger bullish trend reversal. With Ethereum currently trading at $2,544, a surge to $3,000 or even $3,600 would represent a 17.9% and 41.5% increase, respectively.
Bullish Thesis At Risk Below $2,100
While the analysis published by Orihadad66 has highlighted Ethereum’s almost completed bullish structure and potential breakout target, the setup also comes with a clear invalidation level. The TradingView analyst has warned that a 4-hour candle close below the $2,100 support zone or a breakdown beneath the reclaimed descending trendline would signal weakness, potentially nullifying the bullish thesis.
Related Reading
Such a move would suggest that the recent breakout was a false one, possibly a liquidity grab that could open the door to increased selling pressure. The analyst has suggested that traders should monitor price action around the $2,100 level. Until this invalidation point is reached, the analyst’s projected breakout, retest, and continuation scenario remains the dominant roadmap.
Featured image from Pixabay, chart from Tradingview.com
Source link

Reason to trust
![]()
Strict editorial policy that focuses on accuracy, relevance, and impartiality
Created by industry experts and meticulously reviewed
The highest standards in reporting and publishing
Strict editorial policy that focuses on accuracy, relevance, and impartiality
Morbi pretium leo et nisl aliquam mollis. Quisque arcu lorem, ultricies quis pellentesque nec, ullamcorper eu odio.
Ethereum’s price action may have struggled to gain traction in recent weeks, but an interesting long-term macro indicator is showing signs of early recovery beneath the surface. Particularly, a macro trend oscillator created by a crypto analyst known as Decode on social media platform X has begun to exhibit signs of a turnaround after an unusually prolonged stretch of bearish run. If confirmed, this would mark the beginning of a new phase of strength for the second-largest cryptocurrency by market cap.
Shallow Red Bars Begin Turning On Ethereum’s Multi-Timeframe Trend Analysis
The oscillator’s monthly chart, overlaid with Ethereum’s price data on the monthly candlestick timeframe, clearly shows how deep and sustained the recent bearish momentum has been. The red histogram bars reflecting macro weakness persisted well beyond typical durations, highlighting the broader economic drag that has weighed on the crypto market.
Related Reading
Interestingly, January of this year briefly hinted at a return to bullish territory, but the green print turned out to be a false start and quickly faded as the cryptocurrency kicked off another downturn. However, the magnitude of recent red bars is notably shallower compared to downturns in 2023 and 2024.
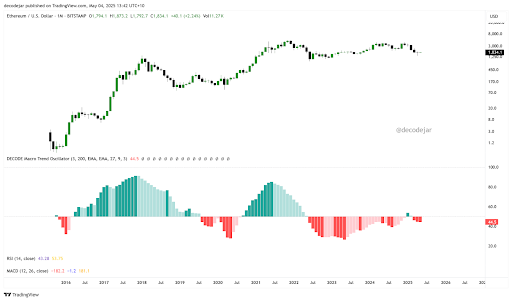
This subtle shift is more apparent on the lower timeframes, particularly the 3-day chart, which shows a clean rejection from the negative territory and the formation of a small green bar before the current pullback. The analyst, Decode, interprets this as a possible early-stage turnaround. Once the oscillator turns green in a sustained fashion, a rapid upward move in Ethereum and broader crypto prices is likely to follow, following similar transitions in the past.
Green Phase Will Dominate Soon
Looking beyond crypto, Decode’s oscillator also tracks the S&P 500 and broader macro trends, where the same pattern holds: green phases are not only more prolonged but also steeper and more robust. This asymmetric distribution of momentum across time reflects the true bias of assets toward expansion over contraction. Decode noted that this is not merely an indicator with arbitrary thresholds but a fully integrated macroeconomic index built from 17 metrics. These include equities, bonds, commodities, currency flows, central bank liquidity (M2), and even sentiment data.
Related Reading
Translating this into Ethereum, this gradual shift toward the green zone is seen as a signal of incoming price strength. Although Ethereum has yet to fully recover from its recent correction to $1,400, the subtle but consistent improvement in Decode’s macro trend oscillator hints that the cryptocurrency may be entering into a fresh uptrend. Right now, the focus is on green bars printing consistently again, especially across multiple timeframes.
At the time of writing, Ethereum is trading at $1,830. The last 24 hours have been marked by a brief break below $1,800 before bouncing at $1,785. This move caused liquidations of approximately $35.92 million in ETH positions, with long positions accounting for $28.38 million of that amount.
Featured image from Getty Images, chart from Tradingview.com
Source link
Dems Say They’re Blocked From Info on Verge of Crypto Market Structure Bill Hearings

Dow gains 214 points, markets end higher as strong labor data eases tariff concerns
Ethereum Price Headed For Crash To $2,000 With Current Price Action
Tokenized funds hit $5.7B, scaling fast — Moody’s
Authorities Warn of Phony Text Messages Phishing for Sensitive Information, Telling Victims Their Bank Account Is at Risk
Tether invests in Chilean crypto exchange Orionx

MARA Hits Record-High Bitcoin Production in May
Retail investors no longer FOMO into BTC, altcoins
AVAX Rises 3.8% on Strong Volume, Breaking Key Resistance Levels

K33 begins Bitcoin buying with 10 BTC purchase for treasury strategy
Why $107,500 And $103,500 Are The Levels To Watch
Pakistan Proposes New Crypto Regulations
Japanese Bitcoin Hoarder Metplanet Adds $115,600,000 Worth of BTC As Stock Surpasses 263% Gains on the Year
Bitcoin traders anticipate decline, watch $100K
Ethereum Foundation Restructures R&D Division, Plans ‘Rethink’ on Design and Development


 24/7 Cryptocurrency News7 months ago
Arthur Hayes, Murad’s Prediction For Meme Coins, AI & DeFi Coins For 2025

 Markets3 months ago
Pi Network coin to $10? 4 catalysts that may make it possible

 Ripple Price3 months ago
3 Voting Polls Show Why Ripple’s XRP Price Could Hit $10 Soon

 Bitcoin5 months ago
Expert Sees Bitcoin Dipping To $50K While Bullish Signs Persist

 24/7 Cryptocurrency News5 months ago
Aptos Leverages Chainlink To Enhance Scalability and Data Access

 Bitcoin7 months ago
Bitcoin Could Rally to $80,000 on the Eve of US Elections

 Opinion7 months ago
Crypto’s Big Trump Gamble Is Risky

 Bitcoin4 months ago
The Future of Bitcoin: Scaling, Institutional Adoption, and Strategic Reserves with Rich Rines
