
24/7 Cryptocurrency News
Will This Sell Signal Trigger ETH Crash?
Despite the recent Bitcoin crash, Ethereum (ETH) price trades today at $3,493.0 as of 2 PM. Surprisingly, ETH performance during the recent crash is much better than most altcoins, but this sell signal could cause issues and potentially trigger a crash for ETH. Regardless, Ether prices today hit a daily high of $3,501.2 after 4.53% move on November 27.
Will Ethereum Price Today Crash Again?
While many altcoins gave away gains to the market due to Bitcoin’s extended crash, Ethereum price remains steadfast, indicating strength. Depending on how BTC fares during Wednesday’s New York trading session, the value of ETH could drop lower or climb higher. As mentioned above, a sell signal flashes on the daily chart and could threaten the strength. Read more to find out.
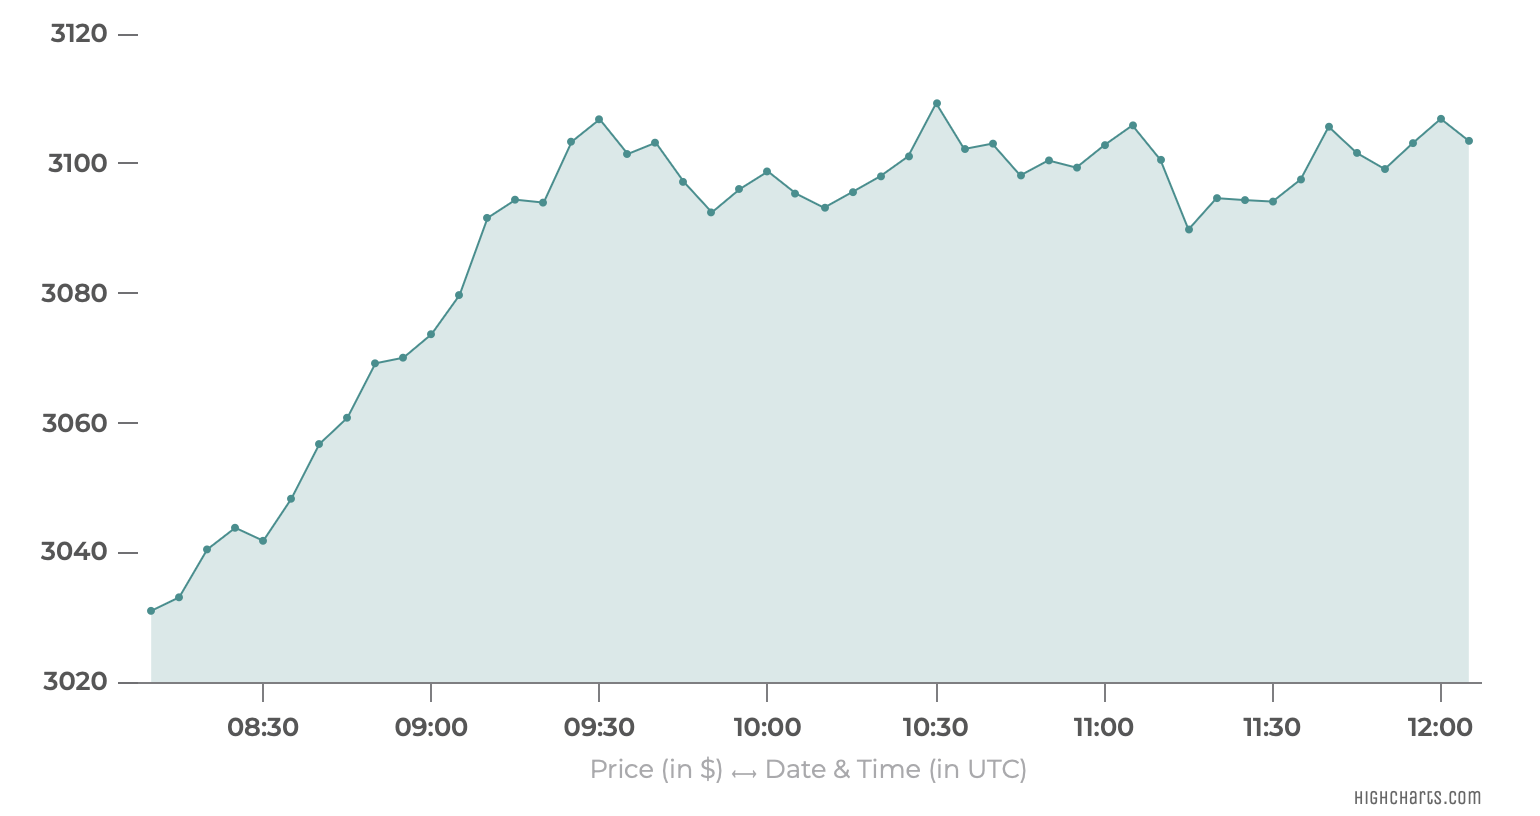
Ethereum Price Chart Today

*Ethereum price updated as of 2 PM.
Ethereum’s innovative smart contract technology has made it a standout altcoin since its inception in 2015. Continuous major network upgrades ensure Ethereum stays ahead in smart contract innovation. The latest upgrade, Cancun, launched on March 13, 2024.
Ethereum Price Outlook
ETH’s year-to-date (YTD) performance continues to increase and currently sits at 33%. This recent slump in Bitcoin price has affected the YTD gains, which have dropped from 50% since November 11. As of November 27, 2024, if you invested $10,000 in ETH on January 1, 2024, your portfolio, after 317 days, would be up roughly $3,317. Ethereum’s market capitalization stands at $420.7 billion.
Ethereum: The Second-Largest Crypto By Market Cap

Ethereum ranks second in market capitalization, valued at $420.7 billion, after Bitcoin’s $1.73 trillion. Together, BTC & ETH’s market capitalization constitutes 83% of the total crypto market cap.
Since its all-time high of $571 billion in November 2021, Ethereum’s value decreased by half in October, but has spiked recently due to Bitcoin’s new ATH. Still, Ethereum maintains a strong lead over other popular cryptocurrencies:
- Solana (SOL): $98.8 billion
- Ripple (XRP): $89.8 billion
- BNB (BNB): $91.0 billion
Despite this recent downtick and recovery, the 24-hour trading volume of Ethereum is $41.7 billion.
Ethereum’s Crypto Trading Volume Soars
The 24-hour trading volume of Ethereum is $41.7 billion. Binance is the largest contributor to this trading volume – about 11% is contributed by spot trading and nearly 40% from futures trading. Exchanges like OKX, Bitget, and ByBit follow Binance.
Ethereum Upgrades to Proof-of-Stake Technology
The London hard fork is a significant Ethereum blockchain upgrade. It changed the network from Proof-of-Work (PoW) to Proof-of-Stake (PoS). Ethereum co-founder Vitalik Buterin recently shared his thoughts on X (formerly Twitter). He explained how Proof-of-Stake (PoS) is more decentralized than Proof-of-Work (PoW).
Notable Ethereum Blockchain Upgrades in 5 Years
Here are some key upgrades in the past five years that shaped Ethereum as the second-largest crypto by market capitalization.
Cancun-Deneb (“Dencun”): This upgrade aimed to improve Ethereum’s scalability, security, and usability, setting the stage for further enhancements.
2023:
2022:
2021:
London: Implemented the highly anticipated EIP-1559, which reformed the transaction fee market, making it more efficient and user-friendly.
2020:
How ETH Gas Affects Ethereum Price
The blockchain upgrades Ethereum receives aim to solve the trilemma of blockchain, i.e., balancing decentralization, security, and scalability. The switch to Proof-of-Stake (PoS) enhanced these aspects. Ethereum’s transaction fees (gas fees) plummeted post-upgrade, drawing more investors. Gas fees are like taxes, measured in Gwei, required for secure transactions.
As of November 27, the gas fee for a transaction on the ETH network as of 2 PM is 14 Gwei.
When Ethereum’s on-chain value grows, presenting opportunities, investors flock, driving gas fees up. This typically occurs during market upswings, peaking at all-time highs.
Ethereum Price Forecast For Next 7 Days
| Date | Price | Change |
|---|---|---|
| November 27, 2024 | 3410.43 | 2.79% |
| November 28, 2024 | 3403.94 | 2.6% |
| November 29, 2024 | 3413.78 | 2.89% |
| November 30, 2024 | 3435.93 | 3.56% |
| December 01, 2024 | 3474.45 | 4.72% |
| December 02, 2024 | 3482.86 | 4.97% |
| December 03, 2024 | 3473.99 | 4.71% |
| December 04, 2024 | 3485.11 | 5.04% |
| December 05, 2024 | 3477.47 | 4.81% |
| December 06, 2024 | 3468.89 | 4.55% |
| December 07, 2024 | 3476.50 | 4.78% |
| December 08, 2024 | 3474.76 | 4.73% |
| December 09, 2024 | 3462.27 | 4.35% |
| December 10, 2024 | 3444.43 | 3.82% |
| December 11, 2024 | 3446.50 | 3.88% |
| December 12, 2024 | 3432.37 | 3.45% |
| December 13, 2024 | 3443.70 | 3.79% |
| December 14, 2024 | 3463.18 | 4.38% |
| December 15, 2024 | 3466.48 | 4.48% |
| December 16, 2024 | 3469.00 | 4.56% |
| December 17, 2024 | 3483.34 | 4.99% |
| December 18, 2024 | 3525.58 | 6.26% |
| December 19, 2024 | 3521.45 | 6.14% |
| December 20, 2024 | 3530.18 | 6.4% |
| December 21, 2024 | 3523.20 | 6.19% |
| December 22, 2024 | 3501.58 | 5.54% |
| December 23, 2024 | 3492.83 | 5.28% |
| December 24, 2024 | 3490.18 | 5.2% |
| December 25, 2024 | 3469.13 | 4.56% |
| December 26, 2024 | 3494.83 | 5.34% |
Based on CoinGagpe’s Ethereum price predictions, investors can expect ETH to trade at around $3,373 in the next week. This is a considerate prediction and is in line with the lackluster performance seen since the start of 2024.
How High Can Ethereum Price Go Between 2025 & 2029
| January | $3,449.20 | $3,701.16 | $3,575.19 | 48.3% |
| February | $3,371.25 | $3,872.14 | $3,621.70 | 50.2% |
| March | $3,293.30 | $4,043.13 | $3,668.22 | 52.1% |
| April | $3,215.35 | $4,214.11 | $3,714.73 | 54.1% |
| May | $3,137.40 | $4,385.09 | $3,761.25 | 56% |
| June | $3,059.45 | $4,556.07 | $3,807.76 | 57.9% |
| July | $2,981.49 | $4,727.05 | $3,854.28 | 59.9% |
| August | $2,903.54 | $4,898.03 | $3,900.79 | 61.8% |
| September | $2,825.59 | $5,069.02 | $3,947.31 | 63.7% |
| October | $2,747.64 | $5,240 | $3,993.82 | 65.6% |
| November | $2,669.69 | $5,410.98 | $4,040.34 | 67.6% |
| December | $2,591.74 | $5,581.96 | $4,086.85 | 69.5% |
| All Time | $3,020.47 | $4,641.56 | $3,831.02 | 58.9% |
| January | $2,811.26 | $5,564.71 | $4,269.20 | 77.1% |
| February | $3,030.78 | $5,547.47 | $4,451.54 | 84.6% |
| March | $3,250.31 | $5,530.22 | $4,633.89 | 92.2% |
| April | $3,469.83 | $5,512.97 | $4,816.23 | 99.8% |
| May | $3,689.35 | $5,495.73 | $4,998.58 | 107.3% |
| June | $3,908.87 | $5,478.48 | $5,180.93 | 114.9% |
| July | $4,128.39 | $5,461.23 | $5,363.27 | 122.5% |
| August | $4,347.91 | $5,443.99 | $5,545.62 | 130% |
| September | $4,567.44 | $5,426.74 | $5,727.96 | 137.6% |
| October | $4,786.96 | $5,409.49 | $5,910.31 | 145.1% |
| November | $5,006.48 | $5,392.25 | $6,092.65 | 152.7% |
| December | $5,226 | $5,375 | $6,275 | 160.3% |
| All Time | $4,018.63 | $5,469.86 | $5,272.10 | 118.7% |
| January | $5,417.25 | $5,571.75 | $6,513.75 | 170.2% |
| February | $5,608.50 | $5,768.50 | $6,752.50 | 180.1% |
| March | $5,799.75 | $5,965.25 | $6,991.25 | 190% |
| April | $5,991 | $6,162 | $7,230 | 199.9% |
| May | $6,182.25 | $6,358.75 | $7,468.75 | 209.8% |
| June | $6,373.50 | $6,555.50 | $7,707.50 | 219.7% |
| July | $6,564.75 | $6,752.25 | $7,946.25 | 229.6% |
| August | $6,756 | $6,949 | $8,185 | 239.5% |
| September | $6,947.25 | $7,145.75 | $8,423.75 | 249.4% |
| October | $7,138.50 | $7,342.50 | $8,662.50 | 259.3% |
| November | $7,329.75 | $7,539.25 | $8,901.25 | 269.2% |
| December | $7,521 | $7,736 | $9,140 | 279.1% |
| All Time | $6,469.13 | $6,653.88 | $7,826.88 | 224.6% |
| January | $7,771.92 | $8,001.25 | $9,467.83 | 292.7% |
| February | $8,022.83 | $8,266.50 | $9,795.67 | 306.3% |
| March | $8,273.75 | $8,531.75 | $10,123.50 | 319.9% |
| April | $8,524.67 | $8,797 | $10,451.33 | 333.5% |
| May | $8,775.58 | $9,062.25 | $10,779.17 | 347.1% |
| June | $9,026.50 | $9,327.50 | $11,107 | 360.7% |
| July | $9,277.42 | $9,592.75 | $11,434.83 | 374.3% |
| August | $9,528.33 | $9,858 | $11,762.67 | 387.9% |
| September | $9,779.25 | $10,123.25 | $12,090.50 | 401.5% |
| October | $10,030.17 | $10,388.50 | $12,418.33 | 415.1% |
| November | $10,281.08 | $10,653.75 | $12,746.17 | 428.7% |
| December | $10,532 | $10,919 | $13,074 | 442.3% |
| All Time | $9,151.96 | $9,460.13 | $11,270.92 | 367.5% |
| January | $10,940 | $11,331.17 | $13,534.75 | 461.4% |
| February | $11,348 | $11,743.33 | $13,995.50 | 480.5% |
| March | $11,756 | $12,155.50 | $14,456.25 | 499.6% |
| April | $12,164 | $12,567.67 | $14,917 | 518.7% |
| May | $12,572 | $12,979.83 | $15,377.75 | 537.8% |
| June | $12,980 | $13,392 | $15,838.50 | 556.9% |
| July | $13,388 | $13,804.17 | $16,299.25 | 576% |
| August | $13,796 | $14,216.33 | $16,760 | 595.1% |
| September | $14,204 | $14,628.50 | $17,220.75 | 614.3% |
| October | $14,612 | $15,040.67 | $17,681.50 | 633.4% |
| November | $15,020 | $15,452.83 | $18,142.25 | 652.5% |
| December | $15,428 | $15,865 | $18,603 | 671.6% |
| All Time | $13,184 | $13,598.08 | $16,068.88 | 566.5% |
In the next year, Ethereum price could still be hovering in the current range. Based on the prediction data, ETH’s trade range extends from $3,001.19 to $4,651.84. This outlook is based on the previous data. However, if ETH breaks the trend, it could go much higher.
The long-term outlook extending from 2025 to 2029, Ethereum price could hit a high of $18,603 with the lowest point being $3,000.
Ethereum Price Forecast Between 2030 & 2050
2030
2031
2032
2033
2040
2050
| January | $16,092.58 | $16,559.25 | $19,264.08 | 699% |
| February | $16,757.17 | $17,253.50 | $19,925.17 | 726.4% |
| March | $17,421.75 | $17,947.75 | $20,586.25 | 753.8% |
| April | $18,086.33 | $18,642 | $21,247.33 | 781.3% |
| May | $18,750.92 | $19,336.25 | $21,908.42 | 808.7% |
| June | $19,415.50 | $20,030.50 | $22,569.50 | 836.1% |
| July | $20,080.08 | $20,724.75 | $23,230.58 | 863.5% |
| August | $20,744.67 | $21,419 | $23,891.67 | 890.9% |
| September | $21,409.25 | $22,113.25 | $24,552.75 | 918.4% |
| October | $22,073.83 | $22,807.50 | $25,213.83 | 945.8% |
| November | $22,738.42 | $23,501.75 | $25,874.92 | 973.2% |
| December | $23,403 | $24,196 | $26,536 | 1000.6% |
| All Time | $19,747.79 | $20,377.63 | $22,900.04 | 849.8% |
| January | $24,169.83 | $24,997.58 | $27,711.08 | 1049.4% |
| February | $24,936.67 | $25,799.17 | $28,886.17 | 1098.1% |
| March | $25,703.50 | $26,600.75 | $30,061.25 | 1146.8% |
| April | $26,470.33 | $27,402.33 | $31,236.33 | 1195.6% |
| May | $27,237.17 | $28,203.92 | $32,411.42 | 1244.3% |
| June | $28,004 | $29,005.50 | $33,586.50 | 1293.1% |
| July | $28,770.83 | $29,807.08 | $34,761.58 | 1341.8% |
| August | $29,537.67 | $30,608.67 | $35,936.67 | 1390.5% |
| September | $30,304.50 | $31,410.25 | $37,111.75 | 1439.3% |
| October | $31,071.33 | $32,211.83 | $38,286.83 | 1488% |
| November | $31,838.17 | $33,013.42 | $39,461.92 | 1536.7% |
| December | $32,605 | $33,815 | $40,637 | 1585.5% |
| All Time | $28,387.42 | $29,406.29 | $34,174.04 | 1317.4% |
| January | $33,881.25 | $35,131.33 | $42,063 | 1644.6% |
| February | $35,157.50 | $36,447.67 | $43,489 | 1703.8% |
| March | $36,433.75 | $37,764 | $44,915 | 1762.9% |
| April | $37,710 | $39,080.33 | $46,341 | 1822.1% |
| May | $38,986.25 | $40,396.67 | $47,767 | 1881.2% |
| June | $40,262.50 | $41,713 | $49,193 | 1940.4% |
| July | $41,538.75 | $43,029.33 | $50,619 | 1999.5% |
| August | $42,815 | $44,345.67 | $52,045 | 2058.6% |
| September | $44,091.25 | $45,662 | $53,471 | 2117.8% |
| October | $45,367.50 | $46,978.33 | $54,897 | 2176.9% |
| November | $46,643.75 | $48,294.67 | $56,323 | 2236.1% |
| December | $47,920 | $49,611 | $57,749 | 2295.2% |
| All Time | $40,900.63 | $42,371.17 | $49,906 | 1969.9% |
| January | $49,768.50 | $51,484 | $59,820.33 | 2381.1% |
| February | $51,617 | $53,357 | $61,891.67 | 2467.1% |
| March | $53,465.50 | $55,230 | $63,963 | 2553% |
| April | $55,314 | $57,103 | $66,034.33 | 2638.9% |
| May | $57,162.50 | $58,976 | $68,105.67 | 2724.8% |
| June | $59,011 | $60,849 | $70,177 | 2810.7% |
| July | $60,859.50 | $62,722 | $72,248.33 | 2896.6% |
| August | $62,708 | $64,595 | $74,319.67 | 2982.5% |
| September | $64,556.50 | $66,468 | $76,391 | 3068.4% |
| October | $66,405 | $68,341 | $78,462.33 | 3154.3% |
| November | $68,253.50 | $70,214 | $80,533.67 | 3240.3% |
| December | $70,102 | $72,087 | $82,605 | 3326.2% |
| All Time | $59,935.25 | $61,785.50 | $71,212.67 | 2853.7% |
| January | $72,550.17 | $75,090.58 | $85,513 | 3446.8% |
| February | $74,998.33 | $78,094.17 | $88,421 | 3567.4% |
| March | $77,446.50 | $81,097.75 | $91,329 | 3688% |
| April | $79,894.67 | $84,101.33 | $94,237 | 3808.6% |
| May | $82,342.83 | $87,104.92 | $97,145 | 3929.2% |
| June | $84,791 | $90,108.50 | $100,053 | 4049.9% |
| July | $87,239.17 | $93,112.08 | $102,961 | 4170.5% |
| August | $89,687.33 | $96,115.67 | $105,869 | 4291.1% |
| September | $92,135.50 | $99,119.25 | $108,777 | 4411.7% |
| October | $94,583.67 | $102,122.83 | $111,685 | 4532.3% |
| November | $97,031.83 | $105,126.42 | $114,593 | 4652.9% |
| December | $99,480 | $108,130 | $117,501 | 4773.5% |
| All Time | $86,015.08 | $91,610.29 | $101,507 | 4110.2% |
| January | $102,603.75 | $110,953.42 | $120,084.17 | 4880.7% |
| February | $105,727.50 | $113,776.83 | $122,667.33 | 4987.8% |
| March | $108,851.25 | $116,600.25 | $125,250.50 | 5095% |
| April | $111,975 | $119,423.67 | $127,833.67 | 5202.1% |
| May | $115,098.75 | $122,247.08 | $130,416.83 | 5309.2% |
| June | $118,222.50 | $125,070.50 | $133,000 | 5416.4% |
| July | $121,346.25 | $127,893.92 | $135,583.17 | 5523.5% |
| August | $124,470 | $130,717.33 | $138,166.33 | 5630.7% |
| September | $127,593.75 | $133,540.75 | $140,749.50 | 5737.8% |
| October | $130,717.50 | $136,364.17 | $143,332.67 | 5844.9% |
| November | $133,841.25 | $139,187.58 | $145,915.83 | 5952.1% |
| December | $136,965 | $142,011 | $148,499 | 6059.2% |
| All Time | $119,784.38 | $126,482.21 | $134,291.58 | 5470% |
Between 2023 and 2050, Ethereum’s price will most likely follow the bullish outlook and aim for the six-digit territory. The lowest price point is $16,092.58, and the highest price of Ether is $145,915.83.
ETH’s Sell Signal Hints at Ethereum Price Crash
The daily Ethereum price chart shows a clear sell signal that hints at an incoming correction. This sell signal is in the form of a bearish divergence noted between the price and the Relative Strength Index (RSI). A bearish divergence is formed when price produces higher high while RSI produces lower highs, denoting a lack of momentum backing up the up trending price. The result of this non-conformity is a correction.
Considering that Ethereum price currently faces both the declining trend line and horizontal resistance level as a blockade, a short-term correction is likely. If Bitcoin drops, ETH could follow suit and trigger a 17% crash to $2,886. This key support level is a good place for accumulation before Ether triggers its next leg up.
The following bounce from $2,886 needs to overcome the $3,500 hurdle to climb to $4,000, a key psychological level.

On the other hand, if Bitcoin’s price fails to drop lower and trigger a reversal, then ETH will look stronger than other altcoins. It could break above $3,500 and preemptively catalyze a run to $4,000. This move will invalidate the short-term correction thesis.
Source link


Confusion spread across the crypto community after rumors suggested that ProShares would launch XRP ETFs on April 30. However, Bloomberg ETF analyst James Seyffart confirmed that there is no official launch date yet. The false reports were based on an old regulatory filing, leading to widespread misinformation online.
ProShares Clarifies XRP ETF Launch Plans
According to Bloomberg ETF analyst James Seyffar reports on ProShares would launch XRP ETFs on about an April 30 launch were inaccurate. He added that, although no official date is set, a launch is expected in the short to medium term.
Concurrently, a spokesperson for ProShares also commented, saying, “ProShares does not have any ETF launches scheduled for Wednesday, April 30. We have no further news to share at this time.” This statement further confirmed that there are no immediate plans to introduce the XRP ETFs this week.
The rumors originated from a regulatory filing dated April 15, which some media outlets misrepresented as a new development. These errors led to incorrect reporting and social media sharing before verification.
Futures-Based XRP ETFs Expected, Not Spot Products
Nate Geraci, President of The ETF Store, had earlier discussed the nature of the upcoming ProShares XRP ETFs. He explained that the new products are not spot ETFs and will not hold XRP directly.
Instead, the planned ETFs will offer exposure to XRP through futures contracts. According to Geraci, the ETFs will include leveraged and inverse options, giving investors different ways to gain exposure to XRP price movements.
He also mentioned that Teucrium launched a 2x Long XRP ETF (XXRP) earlier this month. This product uses swap agreements and seeks to provide twice the daily return of XRP. As of now, the XXRP fund manages around $42.79 million in assets under management.
SEC Scrutiny Remains Over ETF Applications
The Securities and Exchange Commission (SEC) has yet to approve any spot XRP ETF applications, unlike in Brazil. Firms such as Grayscale, Bitwise, and Franklin Templeton are still awaiting a decision from the regulator.
Geraci raised concerns about why the SEC has allowed futures-based XRP ETFs while being cautious about spot products. Futures ETFs face fewer regulatory hurdles compared to spot ETFs, which are subject to more detailed risk reviews.
Concurrently, Bloomberg noted that the SEC has been reviewing applications carefully and has not yet indicated when or if approvals will be granted. The new US SEC Chair Paul Atkins is expected to play a crucial role in reviewing these applications later this year.
Kelvin Munene Murithi
Kelvin is a distinguished writer with expertise in crypto and finance, holding a Bachelor’s degree in Actuarial Science. Known for his incisive analysis and insightful content, he possesses a strong command of English and excels in conducting thorough research and delivering timely cryptocurrency market updates.
Disclaimer: The presented content may include the personal opinion of the author and is subject to market condition. Do your market research before investing in cryptocurrencies. The author or the publication does not hold any responsibility for your personal financial loss.
Source link

The ongoing Trump-China trade war has the netizens in complete turmoil, as the US Recession odds rise in 2025. Although there have been concerns around this topic, the Chief Economist at Apollo Global Management has fueled the fear. Recently, he claimed that an economic slump is to hit America in 2025 amid the tariff situation. Let’s discuss what he has to say.
Apollo Claims US Recession is Absolute in Summer 2025
In a recent CNBC’s Squawk on the Street interview, Apollo Economist, Torsten Slok, has claimed that the US Recession could absolutely form in 2025, if the tariff conditions remain the same.
“It’s all conditioned on tariffs staying in place at these levels, and if they stay at these levels, we will absolutely have a recession in 2025,” Slok.
The US government under Trump’s leadership has ignited a trade war, especially with China, placing a 145% tariff on imported goods from there. Although Trump granted a 90-day pause on reciprocal tariffs, the failure of new updates on the situation increases the odds of further turmoil.
Slok has pointed out the same, claiming that if the Trump-Chain trade war stays put, the gross domestic product (GDP) could drop by 4%. More importantly, he predicted a 90% probability of a two-quarter economic contraction. An Apollo report clearly mentioned their prediction of a US recession in the Summer of 2025.

Experts have been calling for the Fed to cut the interest rate to reduce the impact. Even Donald Trump criticised Jerome Powell for the delay, but there’s still no update. Amid this, the odds of unchanged rate cuts and economic slump are increasing.

US Recession News: Business and Supply Chain at Risk Amid Trump-China Trade War
The US recession odds have increased significantly due to the US-China trade war. The Polymarket report shows 56% probability, and it was 66% at the beginning of the month. Even JP Morgan has increased recession odds to 60%, and the same is true for other analytics firms.

The impact of this tariff influenced the stock, bonds, gold, and even crypto market performance. However, now the impact is also visible in the supply chain.
Bloomberg reported that the cargo shipments have decreased by 60%. Although they noted that America has not felt the impact yet, Giant retailers (Walmart, Target) predict COVID-like shortages, layoffs, and a severe impact on the retail industry.
The Apollo economist has revealed similar insights, claiming that smaller businesses are more vulnerable and are more likely to experience bankruptcies and layoffs. The upcoming Jobless claims could bring a better picture of the labor market, witnessing the Trump tariff effect.
Frequently Asked Questions (FAQs)
Torsten Slock, Chief Economist at Apollo Global Management, predicted that the US will face a recession in 2025 due to the effect of the Trump-China trade war.
The 60% drop in cargo shipments led to giant retailers predicting a COVID-like shortage.
The odds of the Fed’s interest rate cut are low, according to Polymarket reports.
Pooja Khardia
With a deep-seated passion for reading and five years of experience in content writing, Pooja is now focused on crafting trending content about cryptocurrency market.
As a dedicated crypto journalist, Pooja is constantly seeking out trending topics and informative statistics to create compelling pieces for crypto enthusiasts. Staying abreast of the latest trends and advancements in the field is an integral part of her daily routine, fueling a commitment to delivering timely and insightful coverage
Disclaimer: The presented content may include the personal opinion of the author and is subject to market condition. Do your market research before investing in cryptocurrencies. The author or the publication does not hold any responsibility for your personal financial loss.
Source link

The Ethereum-to-Bitcoin ratio has fallen to its lowest level in five years after a dismal Ethereum price performance. As investors try to wrap their heads around the grim metric, Taproot Wizards co-founder Eric Wall has explained the reason behind the steep drop.
Eric Wall Highlights Reasons For ETH/BTC Ratio Collapse
Taproot Wizards co-founder Eric Wall has identified a raft of reasons behind the decline of the ETH/BTC ratio in 2025. The cryptocurrency expert revealed the factors behind the falling ETH/BTC ratio in an X post, hinging the bulk of the blame on Ethereum’s recent price performance.
The ETH/BTC ratio slumped to a five-year low after Ethereum bucked the trend of following Bitcoin on a rally after the halving event. While Bitcoin price rose to cross the $100K mark, Ethereum price has tumbled below $2,000 to reach lows of $1,400.
For Wall, one factor affecting the ETH/BTC ratio appears to be Ethereum’s position in a competitive landscape. Since its launch, several blockchains have cropped up to snag market share from the largest altcoin, offering cheaper fees and faster processing times.
The cryptocurrency expert argues that the absence of a Saylor-like buyer for ETH is playing its role in the decline of the ETH/BTC ratio. Michael Saylor’s BTC purchases have contributed to the asset’s performance, but Wall argues that Ethereum does not have a consistent buyer.
Wall adds that Bitcoin and gold have evolved into wartime assets in the current macroeconomic climate, while ETH is considered a “peacetime asset.” Gold has surged to new highs, sparking optimism that Bitcoin will follow in the same path for a similar rally, while the Ethereum price continues its unimpressive run.
The Merge Is Not Responsible For The Ratio Decline
Eric Wall notes that Ethereum’s Merge event is not responsible for the ETH/BTC slump, contrary to popular sentiment. Ethereum migrated from Proof-of-Work to Proof-of-Stake in 2022, with the ETH/BTC ratio tanking since the Merge.
“The ETHBTC ratio did not go down because of The Merge,” said Eric Wall.
However, pseudonymous cryptocurrency analyst Beanie argues that the Merge is the primary reason for the price decline. Rebuffing the speculation, Wall opines that Ethereum’s layer 2 tokens triggered network fragmentation after botching the “asset value capture narrative,” affecting the ETH/BTC ratio.
“Ethereum also stagnated into a depressingly small number of defi primitives relative to what past expectations were,” added Wall.
Ethereum is flashing signs of brilliance after ETH trading volume spiked to $17.5 billion in less than a day. ETH prices are exchanging hands at nearly 1,800 after an impressive 12% rally that saw it outperform SOL and XRP
Aliyu Pokima
Aliyu Pokima is a seasoned cryptocurrency and emerging technologies journalist with a knack for covering needle-moving stories in the space. Aliyu delivers breaking news stories, regulatory updates, and insightful analysis with depth and precision. When he’s not poring over charts or following leads, Aliyu enjoys playing the bass guitar, lifting weights and running marathons.
Disclaimer: The presented content may include the personal opinion of the author and is subject to market condition. Do your market research before investing in cryptocurrencies. The author or the publication does not hold any responsibility for your personal financial loss.
Source link

From Booze to Barbells: Exercise May Offset Risks of College Partying

Ethereum Foundation shuffles leadership, splits board and management

Bitcoin Price (BTC) Retakes $95K Level After Early U.S. Decline

A New Risk For The Industry?

Justin Sun Bets Big On JUST Token, Sees 100x Potential

Worldcoin price prediction | What’s next for WLD price?

Bitcoin Is About To Begin Outperforming Gold, Says InvestAnswers – Here’s His Timeline

Bloomberg Analyst Confirms No Set Launch Date for ProShares XRP ETFs

What is Base? The Ethereum Layer-2 Network Launched by Coinbase

Loopscale hacker in talks to return stolen crypto

Bitcoin (BTC) Yield Platform Coming From Coinbase (COIN), Aspen Digital

The Emerging Market For State Services Via Citizen X

XRP Price Shoots For 20% Surge To $2.51 Amid Pullback To Breakout Zone

Stocks edge higher ahead of big earnings week

Here’s How Bitcoin Could Boost Demand for US Treasuries, According to Macro Guru Luke Gromen


 24/7 Cryptocurrency News6 months ago
Arthur Hayes, Murad’s Prediction For Meme Coins, AI & DeFi Coins For 2025

 Bitcoin3 months ago
Expert Sees Bitcoin Dipping To $50K While Bullish Signs Persist

 Ripple Price1 month ago
3 Voting Polls Show Why Ripple’s XRP Price Could Hit $10 Soon

 24/7 Cryptocurrency News4 months ago
Aptos Leverages Chainlink To Enhance Scalability and Data Access

 Bitcoin6 months ago
Bitcoin Could Rally to $80,000 on the Eve of US Elections

 Opinion6 months ago
Crypto’s Big Trump Gamble Is Risky

 Bitcoin6 months ago
Institutional Investors Go All In on Crypto as 57% Plan to Boost Allocations as Bull Run Heats Up, Sygnum Survey Reveals

 Bitcoin3 months ago
The Future of Bitcoin: Scaling, Institutional Adoption, and Strategic Reserves with Rich Rines

✓ Share: