
Altcoin
XRP $15 Breakout? Not A Far-Fetched Idea—Analysis
Reason to trust
![]()
Strict editorial policy that focuses on accuracy, relevance, and impartiality
Created by industry experts and meticulously reviewed
The highest standards in reporting and publishing
Strict editorial policy that focuses on accuracy, relevance, and impartiality
Morbi pretium leo et nisl aliquam mollis. Quisque arcu lorem, ultricies quis pellentesque nec, ullamcorper eu odio.
After dropping to less than $2 last March 11th, Ripple’s XRP springs back to life and it’s currently trading between $2.30 and $2.40. And with the US Securities and Exchange Commission vs Ripple case nearing its resolution, the market can expect more price volatility for this digital asset.
Related Reading
Within this context, market analyst Ali Martinez boldly claims that Ripple’s native coin still have the legs to hit a two-digit figure this cycle, using an extensive symmetrical triangle formation as a solid basis.
Martinez’s view runs opposite the bearish statements from other commentators. XRP has been on a slide lately, affected by the broader crypto fall, dipping by around 25% from its $3.40 high achieved mid-January.
XRP Gradually Builds Its Symmetrical Triangle
Like most cryptos, XRP continues to have a highly volatile market performance. The token attempted a recovery early this month but met resistance, leading to a steep decline on March 11th. Interestingly, a few commentators remain bullish on the altcoin, including Martinez, who sees the token on track to reach $15.
This is why $XRP can still reach $15! pic.twitter.com/vkIiR0rnpU
— Ali (@ali_charts) March 14, 2025
In his latest commentary, shared via a Twitter/X posting, Martinez highlighted the seven-year symmetrical triangle formed by this asset, which dates back to January 2018, when it dropped from its $3.80 high.
Even before Martinez shared this observation, several commentators reported the triangle’s formation, suggesting that a breakout could lead to a price run.
The Ascending Trendline
According to Martinez, XRP formed its lower highs in January 2018, extending the descending trendline on top. As the crypto witnessed higher lows during this time frame, it extended its ascending trendline below, creating a symmetrical triangle.
Interestingly, XRP exited the symmetrical triangle structure following the November US elections. Ripple’s native token surged by 280% for the month, marking the biggest 30-day increase for the asset in seven years.

Along with surprising traders, this breakout inspired fresh hope among XRP enthusiasts. While some experts noted that past breakouts do not automatically ensure continuous rallies, many saw this spike as evidence of possible long-term strength.
Still, the dramatic price fluctuation sparked conversations on XRP’s future, particularly in light of further government changes and more general market movements.
Ripple’s XRP is currently trading at $2.37, which is 2% up in the last seven days.
Related Reading
XRP Currently Retesting A Breakout
After two months of upside, Ripple’s XRP is on a downturn, reflecting the broader crypto market sentiment. According to Martinez, XRP’s price is currently retesting the triangle chart breakout. He also suggested that even if XRP slips below $2, it’s still on track for a breakout, as long as it stays above $1. Armed with the charts, Martinez believes that XRP hitting $15 is not a far-out idea.
Featured image from StormGain, chart from TradingView
Source link


Cardano (ADA) has shown major structural developments as it re-enters a multi-year trading range. The recent price action suggests acceptance back within this long-term structure, with indicators pointing toward a potential move to the lower support region.
Cardano (ADA) has re-entered a significant trading range that has contained its price action for over three years. After a breakout in late 2024 that lacked volume strength, the asset has failed to sustain its highs and is now showing signs of weakness. For traders, this shift back into the range carries major implications for ADA’s medium- to long-term price trajectory.
Key points covered
- ADA has closed multiple candles back within a multi-year trading range, signaling true acceptance
- The 2024 breakout lacked volume confirmation, indicating a potential climactic top
- A move towards the lower support region is increasingly likely as ADA seeks true market value

After more than 912 days of trading within a well-defined range since 2022, ADA finally broke out in December 2024, setting a new high. However, this breakout lacked the critical component of follow-through volume. A sharp drop in volume immediately after the breakout signaled weakening momentum, suggesting a climactic top rather than a sustainable bullish trend.
Price action has since fallen back below the range high and closed multiple candles beneath it, a clear sign of acceptance back within the range. This is significant from a structural standpoint. Rather than consolidating above and building new support, ADA is now signaling a potential return to its value zone, likely toward the lower bound of the long-term range.
The volume profile reinforces this theory. The expansion to the December highs was not matched by sustained buyer interest. Instead, volume sharply tapered off, indicating that the breakout may have been speculative and not backed by conviction. In such cases, price often returns to equilibrium levels to reassess fair market value.
What to expect in the coming price action
With ADA now firmly back inside the long-term range, a slow grind toward the lower support region is increasingly probable. Traders should exercise patience, avoiding premature entries until there is either a confirmed trend reversal or a test of the lower boundary. The real opportunity may lie in ADA’s eventual consolidation and structure near the bottom of this historical range.
Source link
Altcoin
Solana Price Eyes Breakout Toward $143 As Inverse Head & Shoulders Pattern Takes Shape On 4-hour Chart
Reason to trust
![]()
Strict editorial policy that focuses on accuracy, relevance, and impartiality
Created by industry experts and meticulously reviewed
The highest standards in reporting and publishing
Strict editorial policy that focuses on accuracy, relevance, and impartiality
Morbi pretium leo et nisl aliquam mollis. Quisque arcu lorem, ultricies quis pellentesque nec, ullamcorper eu odio.
Solana appears to be gearing up for a major technical breakout, with recent price action building up an interesting chart formation. A familiar bullish pattern has formed, and if validated, it could drive the price to a level not seen in recent weeks. This new development was highlighted by popular analyst Titan of Crypto on social media platform X.
Pattern Breakout Sets $143 In Sight
Like every other large market-cap cryptocurrency, Solana has experienced an extended period of price crashes since late February. In the case of Solana, this price crash has been drawing out since January, when it reached an all-time high of $293 during the euphoria surrounding the Official Trump meme coin. Since then, Solana has corrected massively, even reaching a low of $97 on April 7.
Related Reading
The price action before and after this $97 low has created an interesting formation on the 4-hour candlestick timeframe chart. As crypto analyst Titan of Crypto noted, this formation is enough to send Solana back up to $143.
At the heart of the latest bullish outlook is a clearly defined inverse head and shoulders structure, which is known for its reliability in signaling a reversal from a downtrend to a bullish breakout. The left shoulder of the pattern began forming in early April as Solana attempted to rebound from sub-$110 levels. The subsequent drop to the $96 bottom on April 7 formed the head of the structure. From there, a recovery started as buyers cautiously stepped back in, giving rise to the right shoulder.
The breakout of the neckline resistance has taken place in the past 24 hours. With this in mind, Titan of Crypto predicted that $143 becomes the next logical destination based on the measured move from the head to the neckline.
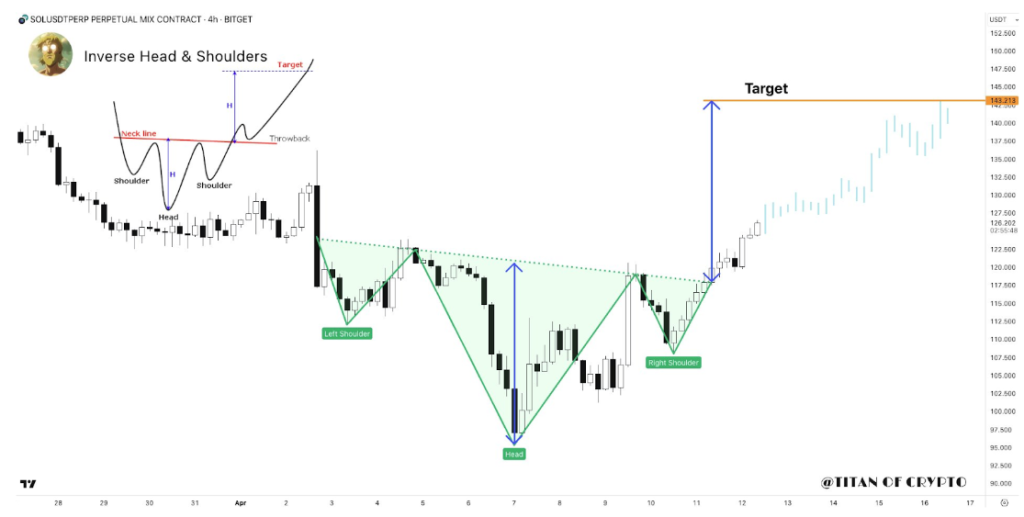
Image From X: Titan of Crypto
Momentum Strengthens With Structure Confirmation
Looking at the chart shared by the analyst, the momentum behind Solana’s price movement appears to be gaining strength. Trading volume is an important metric in evaluating the strength of a breakout, and the volume accompanying the recent breakout above the neckline seemingly confirms it.
Particularly, Solana has seen a 5.3% increase in its price during the past 24 hours, with trading volume surging by 3.76% within this timeframe to $4.21 billion.
Although it is common to see a throwback or minor consolidation just above the neckline, the projected path suggests continued upside as long as price action holds above that key breakout zone.
Related Reading
At the time of writing, Solana is trading at $129, 10% away from reaching this inverse head-and-shoulder target. A move to $143 would not only represent a meaningful recovery from April’s lows but could also improve the confidence in Solana’s price trajectory moving into Q2. The next outlook is what happens after it reaches this target of $143, which will depend on the general market sentiment.
Featured image from The Information, chart from TradingView
Source link
Reason to trust
![]()
Strict editorial policy that focuses on accuracy, relevance, and impartiality
Created by industry experts and meticulously reviewed
The highest standards in reporting and publishing
Strict editorial policy that focuses on accuracy, relevance, and impartiality
Morbi pretium leo et nisl aliquam mollis. Quisque arcu lorem, ultricies quis pellentesque nec, ullamcorper eu odio.
Crypto analyst El Crypto has raised the possibility of an altcoin season happening soon. The analyst alluded to Bitcoin’s dominance rising to a major rejection zone, which could be bullish for altcoins.
Altcoin Season May Be Imminent As Dominance Hits Major Rejection Zone
In an X post, El Crypto suggested that the altcoin season may be imminent as Bitcoin’s dominance hits a major resistance zone. He revealed that BTC’s dominance again touched a zone that has led to rejection every time in the last one and a half years. He added that the Stochastic Relative Strength Index (RSI) is also in the overbought area, while a bearish cross has now happened again.
Related Reading
Based on this, the analyst remarked that the market looks to be in for some fun, hinting at an altcoin season. Crypto analyst CryptoElites also affirmed that Bitcoin’s dominance has reached its peak. He further affirmed that next up is a massive altcoin rally, which will usher in the alt season.
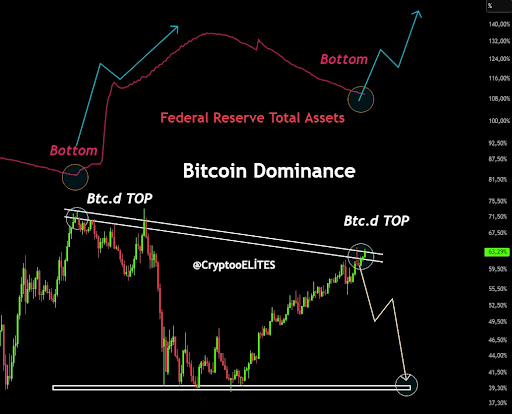
In another X post, the crypto analyst alluded to the USDT and USDC dominance ratio. He claimed that the market was at a critical trend reaction point right now. CryptoElites then mentioned that if the stablecoins’ dominance breaks down, then the altcoin season will officially begin.
Crypto analyst Kevin Capital also looked to provide a bullish outlook towards the altcoin season. In an X post, he highlighted the global liquidity index overlaid with the Dogecoin price. In line with this, he remarked that it might be time for market participants to start paying attention to this.
So far, altcoins have been mirroring Bitcoin’s price action, suffering a similar downtrend amid the trade war. However, if the altcoin season were to kick into full gear, these altcoins could easily decouple from the flagship crypto and outperform. Ethereum is known to lead this altcoin season, but that may not be the case this time, as ETH has underperformed throughout this cycle.
Still Bitcoin Season For Now
Blockchain Center data shows that it is still Bitcoin season for now, as the flagship crypto continues to outperform most altcoins. In the past 90 days, only seven out of the top 50 coins have outperformed the flagship crypto. These coins include Mantra, GateToken, Monero, LEO, Tron, and FastToken.
Related Reading
For it to be altcoin season, 75% of the top 50 coins would need to outperform Bitcoin over the last 90 days. Although almost all coins have witnessed declines within this timeframe, BTC has suffered a 22% drop, which is less than what these altcoins have seen during this period.
At the time of writing, the Bitcoin price is trading at around $80,900, down over 1% in the last 24 hours, according to data from CoinMarketCap.
Featured image from iStock, chart from Tradingview.com
Source link

As Bitcoin Mining Companies Slump, Tether Loads Up on Bitdeer

Can XRP Price Hit $20? Federal Reserve Hints US Banks Can Use XRP

Kyrgyzstan President Brings CBDC a Step Closer to Reality

Manta founder details attempted Zoom hack by Lazarus that used very real ‘legit faces’

Ethereum Price Fights for Momentum—Traders Watch Key Resistance

Corporate Bitcoin Holdings Hit Record High In Q1 2025 As Public Companies Accelerate Accumulation

‘Big Short’ Investor Steve Eisman Derisks, Says Stock Market Volatility Will Be Here for a While
Dow drops over 500 points as UnitedHealth tanks, Fed tensions weigh on markets

Gold Is Still the Safe-Haven King, While Bitcoin Loses Out: JP Morgan

Dogecoin Price Breakout in view as Analyst Predicts $5.6 high

Bitcoin (BTC) Price in Standstill at $85K as Trump Increases Pressure on Fed’s Powell

Ripple acquisition Hidden Road secures FINRA registration

Ethereum Whales Offload 143,000 ETH In One Week – More Selling Ahead?

How Do We Protect Bitcoin From Quantum Computers? Not With A Joke

OKX Goes Live In The US After Setting Up New Headquarters in San Jose, California


 24/7 Cryptocurrency News5 months ago
Arthur Hayes, Murad’s Prediction For Meme Coins, AI & DeFi Coins For 2025

 Bitcoin3 months ago
Expert Sees Bitcoin Dipping To $50K While Bullish Signs Persist

 24/7 Cryptocurrency News3 months ago
Aptos Leverages Chainlink To Enhance Scalability and Data Access

 Ripple Price4 weeks ago
3 Voting Polls Show Why Ripple’s XRP Price Could Hit $10 Soon

 Bitcoin5 months ago
Bitcoin Could Rally to $80,000 on the Eve of US Elections

 Opinion5 months ago
Crypto’s Big Trump Gamble Is Risky

 Altcoins3 months ago
Sonic Now ‘Golden Standard’ of Layer-2s After Scaling Transactions to 16,000+ per Second, Says Andre Cronje

 Bitcoin5 months ago
Institutional Investors Go All In on Crypto as 57% Plan to Boost Allocations as Bull Run Heats Up, Sygnum Survey Reveals
