
Bonk (BONK)
BONK Price Prediction Signals 55% Rally By July End, But There’s a Twist

The BONK price prediction in the daily chart shows a 4-day rally amid the current market recovery. From the $0.000022 low, the Meme coin jumped 28% to trade at $0.000028, while the market cap reached $1.94 Billion. This bullish upswing recently breached the immediate monthly resistance of $0.000027 along with the formation of a bullish reversal pattern. Time to go long?
BONK Price Prediction: Mt. Gox Sale Impact Overstated

Following the recent market correction, the BONK price developed from a local bottom at $0.00018. The horizontal floor coincided closely with the support trendline of the rising wedge pattern creating a strong accumulation for buyers.
A bullish turnaround has uplifted the asset 56% within a fortnight to trade at $0.000028. Amid this upswing, the BONK price gave a decisive breakout from the double-bottom reversal pattern.
Ki Young Ju, CEO of CryptoQuant, has highlighted the fear, uncertainty, and doubt (FUD) surrounding the potential sale of Mt. Gox’s Bitcoin is largely overblown. In a recent tweet, he pointed out that the growth of Bitcoin’s market cap has significantly outpaced its realized cap growth, indicating strong demand in the market.
MtGox FUD is overestimated.
Market cap growth outpaces realized cap growth, showing strong demand. Since 2023, $224B in #Bitcoin sold, yet price up 350%.
Even if MtGox’s $3B is sold on Kraken, it’s just 1% of the realized cap increase in this bull cycle — manageable liquidity. https://t.co/IUtw2pY6Am pic.twitter.com/pWqWhM0i9Z
— Ki Young Ju (@ki_young_ju) July 16, 2024
Since 2023, a staggering $224 billion worth of Bitcoin has been sold, yet the price has surged by 350%. Ju noted that even if the $3 billion worth of Bitcoin held by Mt. Gox were sold on Kraken, it would represent just 1% of the realized cap increase in the current bull cycle. This minimal impact underscores the manageable liquidity in the market.
Amid prospects of an extended market recovery, BONK price prediction suggests a potential 55% rally before encountering significant resistance within a rising wedge pattern. As long as the converging trend lines hold, this Solana-based memecoin may continue to experience a consolidation phase.
If the overhead trendline persists, the BONK price may enter another fresh correction.
Technical Indicator:
- Exponential Moving Average: The coin price back above the daily Exponential Moving Average (20, 50, 100, and 200) indicates the path to least resistance is up.
- RSI: The daily Relative Strength Index slope back above 60% indicates the memecoin entering a high momentum rally.
Frequently Asked Questions (FAQs)
A double-bottom reversal pattern is a bullish chart formation that appears after a downtrend
Market cap, or market capitalization, is the total value of a cryptocurrency’s circulating supply multiplied by its current price.
EMA stands for Exponential Moving Average. It is a type of moving average that gives more weight to recent prices, making it more responsive to new information.
Related Articles
The presented content may include the personal opinion of the author and is subject to market condition. Do your market research before investing in cryptocurrencies. The author or the publication does not hold any responsibility for your personal financial loss.
Source link


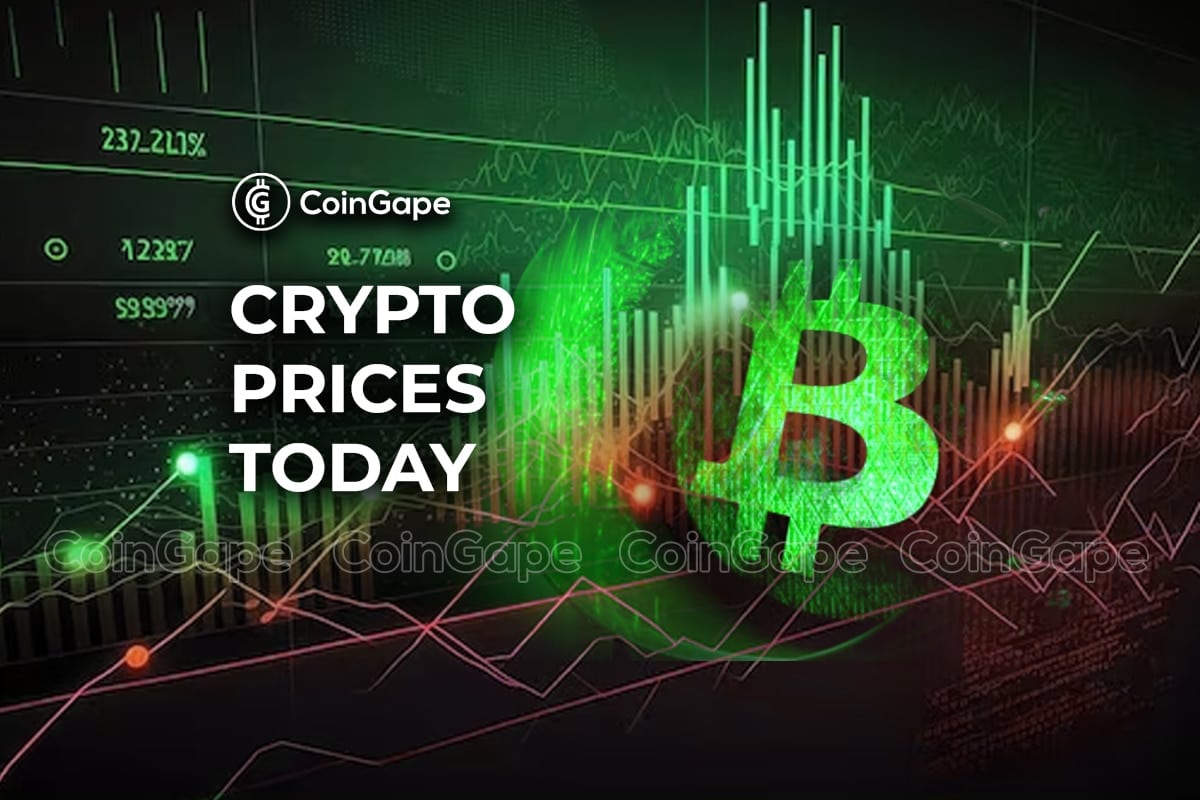
Crypto Prices Today, November 20: The crypto market experienced mixed sentiment as Bitcoin touched $94K intraday, marking a new all-time high, before settling above $92K. Major altcoins showed negative sentiment, with declines of 2-3% over the last 24 hours. Meanwhile, GOAT and BONK emerged as top gainers, surging 8-13% in the same period.
The global crypto market cap dropped by 0.3% in the past day, standing at $3.07 trillion. Total trading volume reached $179 billion, reflecting a 10% decline from the previous day.Here’s a look at some leading cryptocurrencies by market cap and their price movements today.
Crypto Prices Today: BTC Hits $94K ATH While SOL, ETH, and XRP See Declines
Bitcoin touched an all-time high of $94K in intraday trading today before facing a rejection, currently holding above $92K. GOAT and BONK led the market, posting impressive gains of 8-13% over the last 24 hours. Major altcoins experienced slight turbulence, with most trading 2-4% lower. Meme coins showed mixed sentiment; DOGE rose by 1%, while SHIB dropped 3% in the same period.
Bitcoin Price Today
Bitcoin price is up by 0.5% over the last 24 hours, currently trading at $92,050. The coin’s intraday low and high are $91,059 and $94,002, respectively. BTC’s market cap stands at $1.81 trillion with a 24-hour trading volume of $75 billion, reflecting a market dominance of 59.21%.
According to sosovalue, daily inflows have reached $600 million, although data from BlackRock and Grayscale is yet to be updated. The debut of Bitcoin ETF options on Nasdaq, including BlackRock’s iShares Bitcoin Trust ETF (IBIT), has sparked a surge in demand. This pivotal development offers investors new tools for hedging risks and managing exposure to Bitcoin’s price fluctuations.
Ethereum Price Today
Ethereum is down by 2.33% in the last 24 hours, currently trading at $3,087. The 24-hour low and high for ETH are $3,070 and $3,160. With a market cap of $371.5 billion and a 24-hour trading volume of $28 billion, Ethereum holds a market dominance of 12.51%, making it the second-largest cryptocurrency in the world. The price decline is also reflected in Ethereum ETFs, with a daily outflow of $67 million, though BlackRock and Grayscale’s inflow data is awaited.
Solana Price Today
Solana is currently trading at $232, showing a 4.5% decline over the last 24 hours. The 24-hour low and high for SOL are $231 and $247, respectively. With a market cap of $110 billion, Solana ranks as the fourth-largest cryptocurrency in the world. Its 24-hour trading volume stands at $6.87 billion, with a market dominance of 3.61%.
XRP Price Today
XRP is currently trading at $1.08, reflecting a 4% drop in the last 24 hours. The 24-hour low and high for XRP are $1.0738 and $1.138, respectively. XRP’s 24-hour trading volume is $5.74 billion, with a market dominance of 2%. On a positive note, XRP whales moved 210 million coins, sparking rumors of a partnership with Cardano.
Meme Crypto Prices Today
Dogecoin price saw a gain of approximately 1.3%, currently trading at $0.38. Its 24-hour low and high are $0.3767 and $0.4183, respectively. On the other hand, Shiba Inu (SHIB) is down by 3% in the last 24 hours, now trading at $0.00002404. Its 24-hour low and high are $0.00002409 and $0.00002601, respectively.
Top Crypto Gainers Prices Today
Goatseus Maximus
Goatseus Maximus is currently up by 12%, trading at $1.20. Its 24-hour low and high are $0.9988 and $1.231, respectively.
BONK
BONK is trading at $0.00005609, reflecting a 10% increase in the last 24 hours. Its 24-hour low and high are $0.00004847 and $0.00005768. The market volume stands at $4.23 billion.
UNUS SED LEO
UNUS SED LEO (LEO) is currently trading at $8.50, showing a 9% increase over the last 24 hours. The 24-hour low and high are $7.73 and $8.50, with a market cap of $7.85 billion.
Top Crypto Losers Prices Today
Hedera
Hedera (HBAR) is currently trading at $0.1258, reflecting a 16% decrease over the last 24 hours. Its 24-hour low and high are $0.1241 and $0.1561, respectively, with a market cap of $4.69 billion.
Akash Network
Akash Network (AKT) is currently trading at $3.813, showing a 12.7% decline in the last 24 hours. The 24-hour low and high are $3.779 and $4.494, respectively.
The hourly time frame charts show a positive trend with BTC up by 0.02%. However, ETH has experienced a slight decline of 0.1% during the same period.
Coingape Staff
CoinGape comprises an experienced team of native content writers and editors working round the clock to cover news globally and present news as a fact rather than an opinion. CoinGape writers and reporters contributed to this article.
Disclaimer: The presented content may include the personal opinion of the author and is subject to market condition. Do your market research before investing in cryptocurrencies. The author or the publication does not hold any responsibility for your personal financial loss.
Source link

The cryptocurrency world is buzzing with high hopes as certain Solana coins show great potential for massive gains. Investors aiming for substantial returns see opportunities to grow a $100,000 investment into $1 million by December 2024.
The crypto market trades sideways as Solana’s price remains firm, hovering around $152. Bitcoin is steady above $67,000, while Ethereum trades near $2,600.
3 Solana Coins Poised to Turn $100K Into $1M
Bonk (BONK)
Bonk (BONK), a Solana-based meme coin, has attracted attention by distributing half of its tokens to Solana users. Over the past year, BONK’s price surged 11,857%, sparking predictions that it could turn a $100,000 investment into $1 million by December 2024.
Currently, the value of BONK is at $0.00002291, with a slight 3% dip, but it still shows a 40% increase over the past month, indicating potential for further growth.
Crypto analyst has highlighted a potential breakout for Bonk, predicting a surge of 180% soon. According to the chart shared by the analyst, BONK is forming a bullish pattern, indicating a strong upward trend.

Dogwifhat (WIF)
Dogwifhat (WIF), a meme coin in the Solana ecosystem, has gained attention for its impressive growth. Since its launch, WIF has skyrocketed over 1,429%, positioning itself as a potential game-changer.
This rapid surge suggests a $100,000 investment could turn into $1 million by December 2024. Despite a minor 0.16% drop, WIF’s current price is $2.58, showcasing its growing influence and popularity within the crypto community.
According to the santiment data, the percentage of stablecoin supply held by whales, with more than $5 million, has seen a notable increase. As these large holders gain more control over the supply, analysts closely monitor the potential effects on liquidity and volatility. This trend could be crucial in shaping the next phase of market growth and price behavior.

Popcat (POPCAT)
Popcat (POPCAT), a cryptocurrency on the SOL blockchain, has experienced a remarkable surge, rising by 7935% recently. This increase has positioned POPCAT as a strong contender for significant portfolio gains, with a $100,000 investment potentially reaching $1 million by December 2024.
The current price of the Cat themed-based coin is $1.34, reflecting its ongoing bullish trend. If POPCAT surpasses its current resistance levels, it may soon climb to $2. The cryptocurrency’s upward trend mirrors broader market movements, indicating a strong potential for continued growth.

With the current market trends, three Solana coins could turn a $100,000 portfolio into $1 million by the end of 2024. While the market remains volatile, the potential upside in Solana-based projects makes them attractive for investors looking to maximize returns in the next year.
Frequently Asked Questions (FAQs)
Bonk (BONK), Dogwifhat (WIF), and Popcat (POPCAT) show strong growth potential.
These coins could potentially turn $100K into $1M by 2024.
Market sentiment, broader crypto trends, and Solana ecosystem developments impact prices.
Coingape Staff
CoinGape comprises an experienced team of native content writers and editors working round the clock to cover news globally and present news as a fact rather than an opinion. CoinGape writers and reporters contributed to this article.
Disclaimer: The presented content may include the personal opinion of the author and is subject to market condition. Do your market research before investing in cryptocurrencies. The author or the publication does not hold any responsibility for your personal financial loss.
Source link

XRP’s $5, $10 goals are trending, but this altcoin with 7,400% potential takes the spotlight

CryptoQuant Hails Binance Reserve Amid High Leverage Trading

Trump Picks Bo Hines to Lead Presidential Crypto Council

The introduction of Hydra could see Cardano surpass Ethereum with 100,000 TPS

Top 4 Altcoins to Hold Before 2025 Alt Season

DeFi Protocol Usual’s Surge Catapults Hashnote’s Tokenized Treasury Over BlackRock’s BUIDL

DOGE & SHIB holders embrace Lightchain AI for its growth and unique sports-crypto vision

Will Shiba Inu Price Hold Critical Support Amid Market Volatility?

Chainlink price double bottoms as whales accumulate

Ethereum Accumulation Address Holdings Surge By 60% In Five Months – Details

Ripple Transfers 90M Coins, What’s Happening?

Filecoin, Monero, and Lunex dominate smart investor portfolios

Bitwise CIO Matt Hougan Predicts Institutional Interest in Altcoins, Says 2025 the Year of Crypto Diversification

How Low Will Ethereum Price Go By The End of December?

Analyst says buying this altcoin at $0.15 could be as profitable as buying ETH at $0.66
182267361726451435
Why Did Trump Change His Mind on Bitcoin?

Top Crypto News Headlines of The Week

New U.S. president must bring clarity to crypto regulation, analyst says

Will XRP Price Defend $0.5 Support If SEC Decides to Appeal?

Bitcoin Open-Source Development Takes The Stage In Nashville

Ethereum, Solana touch key levels as Bitcoin spikes

Bitcoin 20% Surge In 3 Weeks Teases Record-Breaking Potential

Ethereum Crash A Buying Opportunity? This Whale Thinks So

Shiba Inu Price Slips 4% as 3500% Burn Rate Surge Fails to Halt Correction

Washington financial watchdog warns of scam involving fake crypto ‘professors’

‘Hamster Kombat’ Airdrop Delayed as Pre-Market Trading for Telegram Game Expands

Citigroup Executive Steps Down To Explore Crypto
Mostbet Güvenilir Mi – Casino Bonus 2024

NoOnes Bitcoin Philosophy: Everyone Eats

 3 months ago
182267361726451435

 Donald Trump5 months ago
Why Did Trump Change His Mind on Bitcoin?
 24/7 Cryptocurrency News4 months ago
Top Crypto News Headlines of The Week
 News4 months ago
New U.S. president must bring clarity to crypto regulation, analyst says
 Price analysis4 months ago
Will XRP Price Defend $0.5 Support If SEC Decides to Appeal?
 Opinion5 months ago
Bitcoin Open-Source Development Takes The Stage In Nashville
 Bitcoin5 months ago
Ethereum, Solana touch key levels as Bitcoin spikes
 Bitcoin5 months ago
Bitcoin 20% Surge In 3 Weeks Teases Record-Breaking Potential

✓ Share: