
Price analysis
Will XRP Price Defend $0.5 Support If SEC Decides to Appeal?
The XRP price dipped 2.62% to $0.56 on Sunday as crypto witnessed renewed selling pressure. The falling price marks a notable reversal within the multi-year triangle pattern, signaling the potential for a major correction. Will the bear’s plan intensify as some reports hint that the U.S. Securities and Exchange Commission (SEC) may decide to appeal certain aspects of the final verdict?
Ripple Faces Potential SEC Appeal Despite $12.5M Penalty
The XRP coin has recently garnered the attention of crypto investors following a favorable final verdict in the Ripple vs SEC case. On August 7th, Judge Torres imposed a $12.5 million penalty on Ripple, far less than the SEC’s original $2 billion demand.
While the XRP Community celebrated this as a major win, discussions emerged regarding the possibility of an appeal by the U.S. Securities and Exchange Commission (SEC), particularly concerning Ripple’s On-Demand Liquidity (ODL) sales.
However, Attorney Jeremy Hogan explains that the injunction on Ripple’s On-Demand Liquidity (ODL) sales will unlikely change the status quo. He highlights that most XRP and ODL sales are outside U.S. jurisdiction. Ripple can still sell XRP to institutions under specific exemptions, and the SEC must prove any violation to enforce the order.
I see lots of questions re what the injunction means for ODL sales. I don’t see it changing the status quo AT ALL, for the following reasons:
1. As Ripple has stated, the majority of its XRP and ODL sales are outside the U.S. jurisdiction and not subject to the ruling. Those… pic.twitter.com/3GimWEcp0c
— Jeremy Hogan (@attorneyjeremy1) August 7, 2024
Hogan also mentions that Ripple’s legal team has had ample time to adjust its practices to comply with the summary judgment ruling.
XRP Price Hints Major Reversal Within Triangle Pattern
The daily XRP price chart shows a notable reversal of $0.64 as the mid-week recovery subsides. The bearish turnaround plunged the asset 11.5% to $0.56, while the market cap plunged to $31.9 Billion.
Interestingly, this reversal marked another bear cycle within the triangle pattern, which had been intact since September 2021. This chart pattern consists of two converging trendlines: dynamic resistance and support, which drive the prices into a squeezing range before a major breakout.
Data from Coinglass shows that XRP’s Open Interest (OI)-Weighted Funding Rate is -0.0085. This negative rate shows that short sellers are paying to maintain their positions, implying expectations of further price declines.
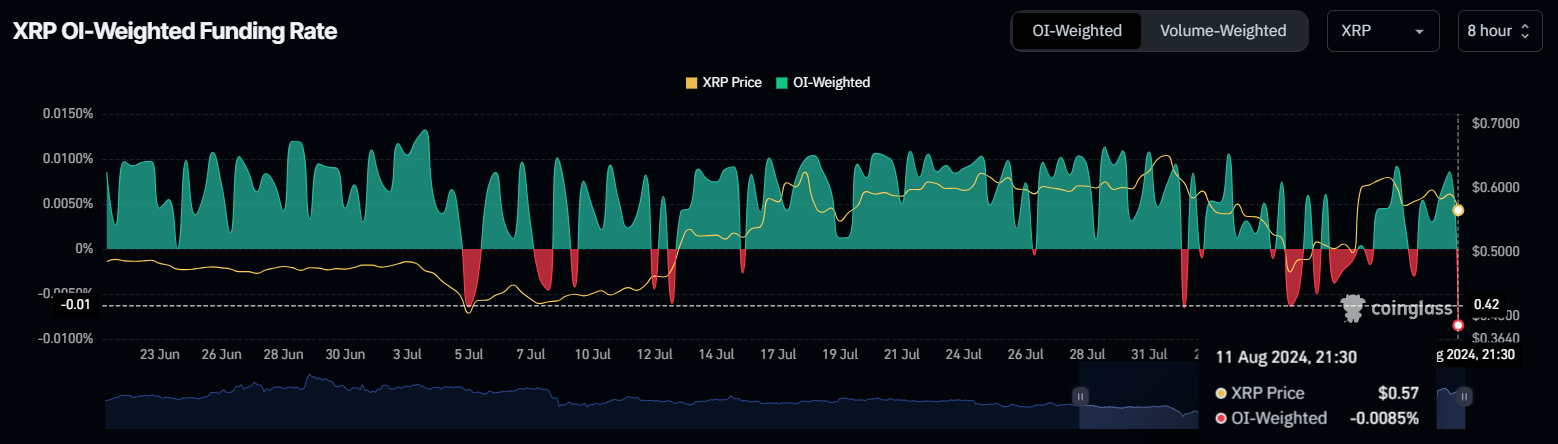
Thus, the recent reversal and anticipated appeal from the SEC on Ripple’s ODL sale could accelerate the bearish sentiment for XRP. With sustained selling, the altcoin could breach the combined support of $0.55 and the 200-day EMA, bolstering a downfall to the psychological level of $0.4.
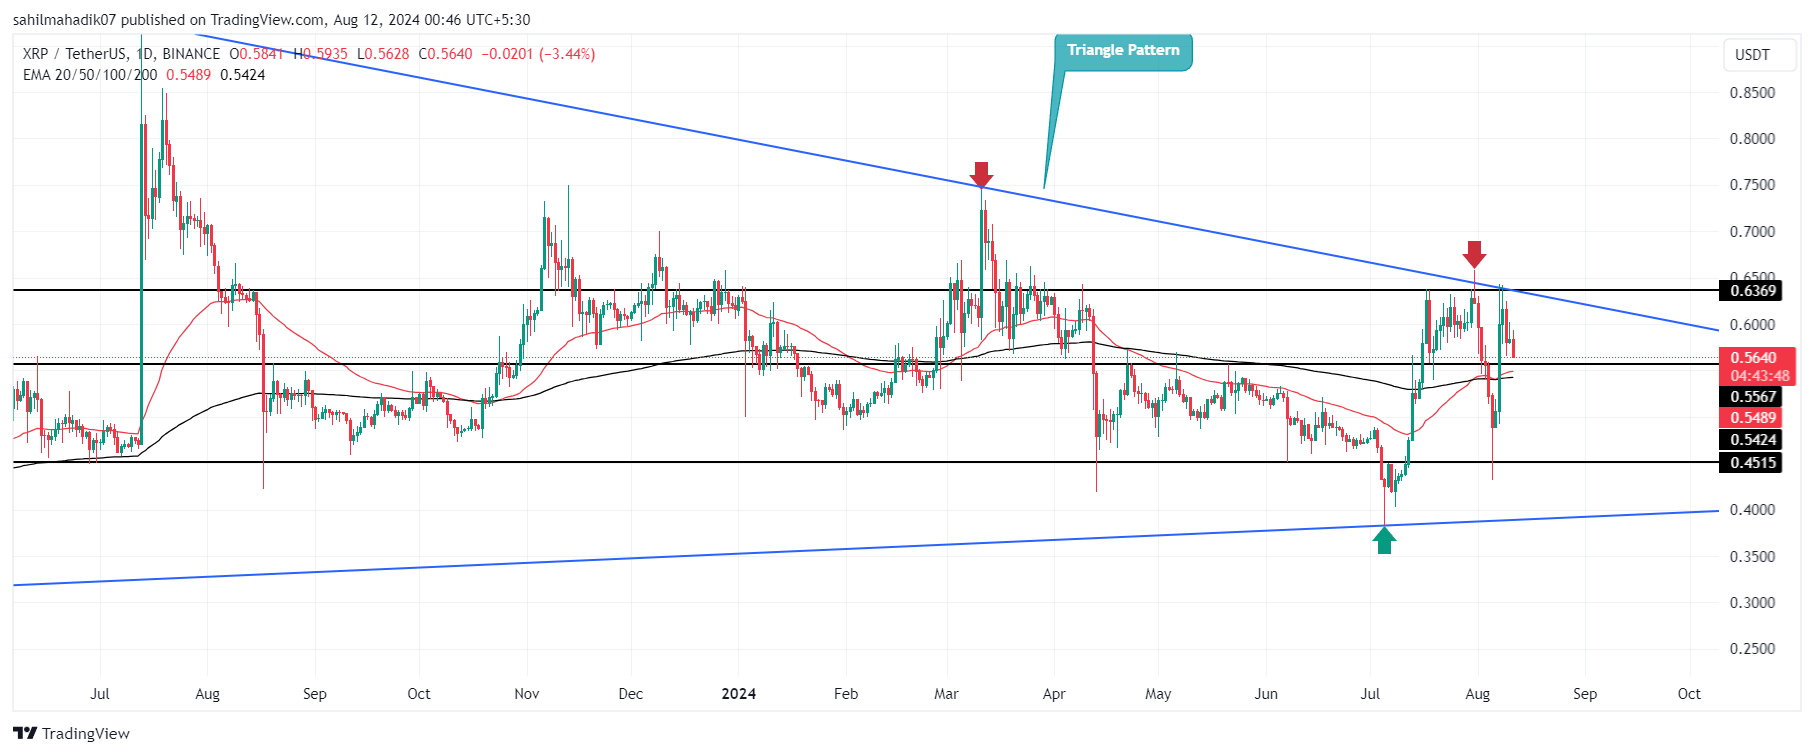
The $0.4 level, backed by the triangle pattern support, is a major accumulation zone for dip buyers. A potential rebound from this bottom could renew the recovery momentum for the next leap.
Frequently Asked Questions (FAQs)
If the SEC decides to appeal aspects of the Ripple case, particularly concerning ODL sales, it could intensify bearish sentiment, putting additional downward pressure on XRP’s price.
The XRP price will witness suitable support at $0.55, backed by 200-day EMA.
The XRP price shows a long-term sideways trend amid the formation of a symmetrical triangle pattern.
Sahil Mahadik
Sahil is a dedicated full-time trader with over three years of experience in the financial markets. Armed with a strong grasp of technical analysis, he keeps a vigilant eye on the daily price movements of top assets and indices. Drawn by his fascination with financial instruments, Sahil enthusiastically embraced the emerging realm of cryptocurrency, where he continues to explore opportunities driven by his passion for trading
Disclaimer: The presented content may include the personal opinion of the author and is subject to market condition. Do your market research before investing in cryptocurrencies. The author or the publication does not hold any responsibility for your personal financial loss.
Source link


Cardano (ADA) price has significantly increased in the last 24 hours, following a broader market surge. The altcoin’s positive trend comes amid increased investor interest as the cryptocurrency market rallies after the recent U.S. elections. Notably, Cardano’s surge aligns with other altcoins that have also rebounded, strongly eyeing more gain in November and further attracting attention from analysts.
Will Cardano Price Hit New Peaks in November Amid Major Upgrades?
Cardano’s price has shown strong momentum recently, climbing over 10% in the past month, supported by a positive shift in the broader cryptocurrency market. This surge comes as Cardano launches Node 10.1, a significant upgrade that introduces new governance capabilities and prepares the network for the upcoming Chang 2 hard fork.
Node 10.1.1 is the first mainnet node to support the Chang 2 inter-era hard fork, marking a crucial step for Cardano’s governance evolution. The release also brings enhanced delegation options, allowing stake pool operators (SPOs) to delegate to pre-defined voting choices.
These advancements have spurred optimism that Cardano’s price could push higher in the coming weeks, as the network solidifies its infrastructure and prepares for new functionalities.
Analyst Predicts 70% ADA Price Rally Surge
Crypto analyst ZAYK Charts has highlighted a potential bullish wave for Cardano, indicating a breakout from a falling wedge pattern on the 1-day chart. This technical formation is often seen as a reversal indicator that ADA could experience significant upward momentum.
According to ZAYK Charts’ projections, the breakout could lead to a 60-70% price increase. This optimistic outlook comes as ADA investors anticipate the next move, with bullish sentiment building around the cryptocurrency.
$ADA Faling Wedge Breakout is Done in 1D Timeframe✅
Expecting 60-70% Bullish Wave📈#ADA #ADAUSDT #Crypto pic.twitter.com/RD0bYw3i5R
— ZAYK Charts (@ZAYKCharts) November 7, 2024
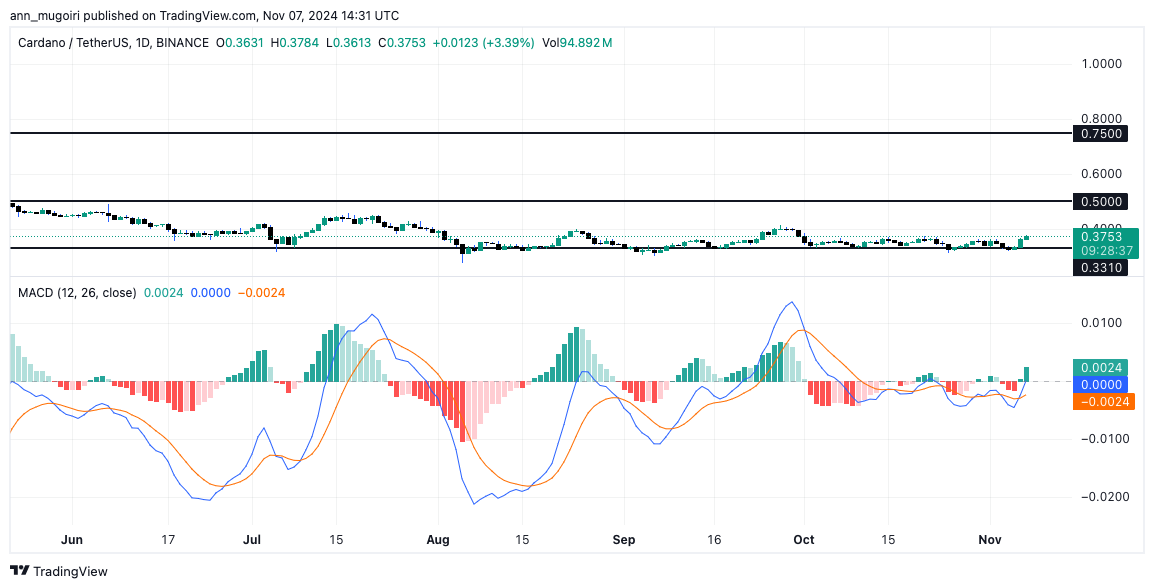
At the time of writing, the ADA price saw an impressive 5.% increase within the past day, trading at approximately $0.3751. Opening at a low of $0.3525, the ADA gradually gained traction, climbing to a high of $0.3771, marking a significant upward trend in the 24 hours.
The top altcoin price is eyeing a critical resistance level at $0.38, with bullish momentum suggesting a potential breakthrough. If ADA manages to overcome this barrier, analysts expect the cryptocurrency could challenge a more significant resistance point at $0.75.
The Moving Average Convergence Divergence (MACD) indicator on the daily chart shows a positive crossover. The MACD line (blue) stands above the signal line (orange), indicating growing buying momentum. The histogram has also shifted to green, suggesting bullish momentum may be building up.
As Cardano continues to build momentum and adopt new upgrades, it could be on track for notable price growth in November. With promising technical indicators and bullish sentiment, ADA may push toward new highs in the weeks ahead.
Frequently Asked Questions (FAQs)
Cardano’s Node 10.1 upgrade, increased investor interest, and a positive market rally are key drivers.
Analysts predict a potential 60-70% rally if ADA breaks through key resistance levels.
It introduces new governance and delegation features, preparing the network for the Chang 2 hard fork.
Coingape Staff
CoinGape comprises an experienced team of native content writers and editors working round the clock to cover news globally and present news as a fact rather than an opinion. CoinGape writers and reporters contributed to this article.
Disclaimer: The presented content may include the personal opinion of the author and is subject to market condition. Do your market research before investing in cryptocurrencies. The author or the publication does not hold any responsibility for your personal financial loss.
Source link

During Wednesday’s trading session, the cryptocurrency market witnessed a surge in buying pressure as Donald Trump secured his victory as the 47th U.S. President. The pioneer cryptocurrency, Bitcoin, surged 8.8% to a new high of $75,400, boosting recovery in the altcoin market. However, the Ethereum price could struggle to hit new ATH as crypto whale continues to offload ETH.
By press time, the ETH price trades at $2,647 with an intraday gain of 9.89%. According to Coingecko, Ether’s marketcap holds at $319.2 Billion, and 24-hour trading volume is at $38.169 Billion.
Ethereum Price ATH Delayed? Whale Sales Overshadow Election Momentum
On November 6th, the cryptocurrency market experienced a significant rally as Donald Trump secured the necessary 270 electoral votes to become the 47th President of the United States. Amid this rally, a crypto whale who received 150,000 ETH through the ICO recently transferred a substantial 25,000 ETH (worth approximately $65.63 Million) to Kraken at an average price of $2,625.
According to Lookonchain, this whale has sold a total of 90,000 ETH of the 150,000 coins at an average value of $2,527 (worth around $227.45M).
Breakdown of the Whale’s ETH Sales:
- July 2019: Sold 5,000 ETH at $218 ($1.09M).
- June 2024: Sold 10,000 ETH at $3,539 ($35.39M).
- September–October 2024: Sold 50,000 ETH at $2,516 ($125.34M).
- November 2024: Sold 25,000 ETH at $2,625 ($65.63M).
Historically, whale selling has coincided with major market tops and spurred a bearish sentiment in the market. Amid the supply pressure, the Ethereum price could witness a stalled recovery momentum and struggle to hit a new All-time-high.
在今天的大幅上涨后,通过 ICO 获得 15 万枚 ETH 的鲸鱼又准备出售一部分 ETH:过去 40 分钟里他将 2.5 万枚 ETH ($65.63M) 转进了 Kraken。
到现在他通过 ICO 获得的 15 万枚 ETH 已经以 $2,527 的均价出售了 9 万枚 ($227.45M):
一、2019 年 7 月以 $218 的价格出售 5,000 ETH ($1.09M);… https://t.co/fsr487zjLd pic.twitter.com/K9qVxaEOso— 余烬 (@EmberCN) November 6, 2024
ETH Chart Analysis Shows Porlong Consolidation Within Triangle
Over the past three months, the Ethereum price prediction has traded sideways, resonating within a symmetrical triangle pattern. The price action strictly resonated within two converging trendlines, indicating a lack of dominance from buyers or sellers.
With a massive green candle today, the ETH price is at $2,661, still consolidating within the triangle and 3% away from a major breakout. If the sellers continue to defend this resistance, the Ether price will revert again and prolong its sideways trend.
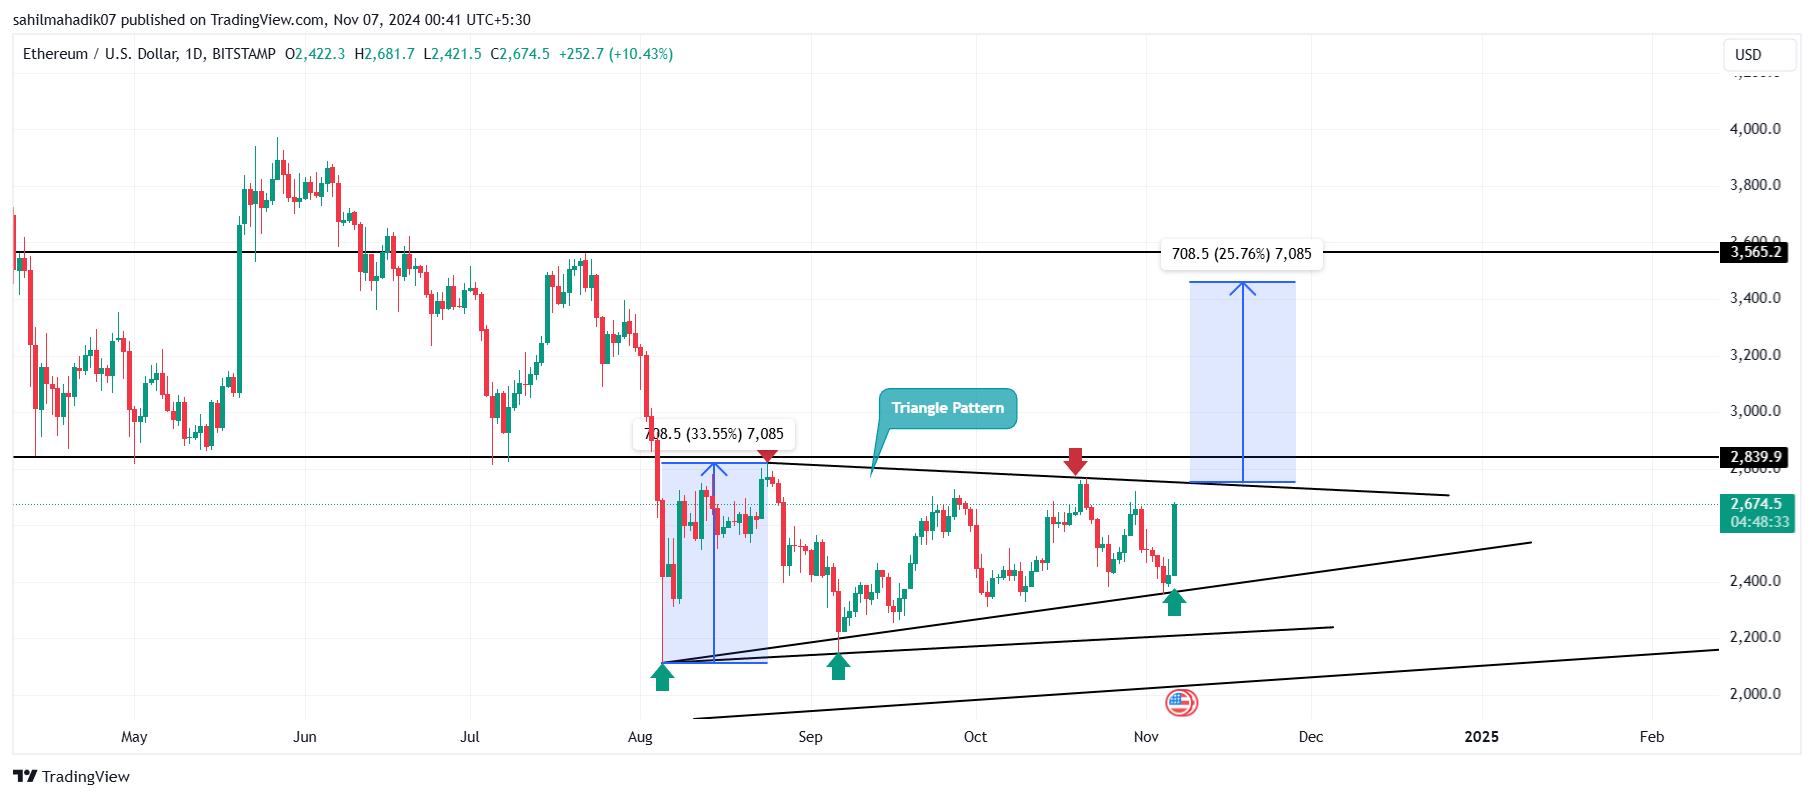
Therefore, a potential breakout from overhead resistance is necessary for buyers to regain control over the asset. If the ETH price surpasses the dynamic with the daily candle closing, the bullish momentum will accelerate to drive a surge above $3,500.
Frequently Asked Questions (FAQs)
Ethereum’s price recovery has been limited due to persistent selling by crypto whales
Following Trump’s election as the 47th U.S. President, the crypto market saw a rally, with Bitcoin hitting $75,400 and Ethereum gaining 9.89%, trading at $2,647
The symmetrical triangle pattern indicates consolidation, with ETH price oscillating between two converging trendlines. An upside breakout from this pattern is essential for buyers to regain control and push ETH towards the $3,500 mark or higher.
Sahil Mahadik
Sahil is a dedicated full-time trader with over three years of experience in the financial markets. Armed with a strong grasp of technical analysis, he keeps a vigilant eye on the daily price movements of top assets and indices. Drawn by his fascination with financial instruments, Sahil enthusiastically embraced the emerging realm of cryptocurrency, where he continues to explore opportunities driven by his passion for trading
Disclaimer: The presented content may include the personal opinion of the author and is subject to market condition. Do your market research before investing in cryptocurrencies. The author or the publication does not hold any responsibility for your personal financial loss.
Source link
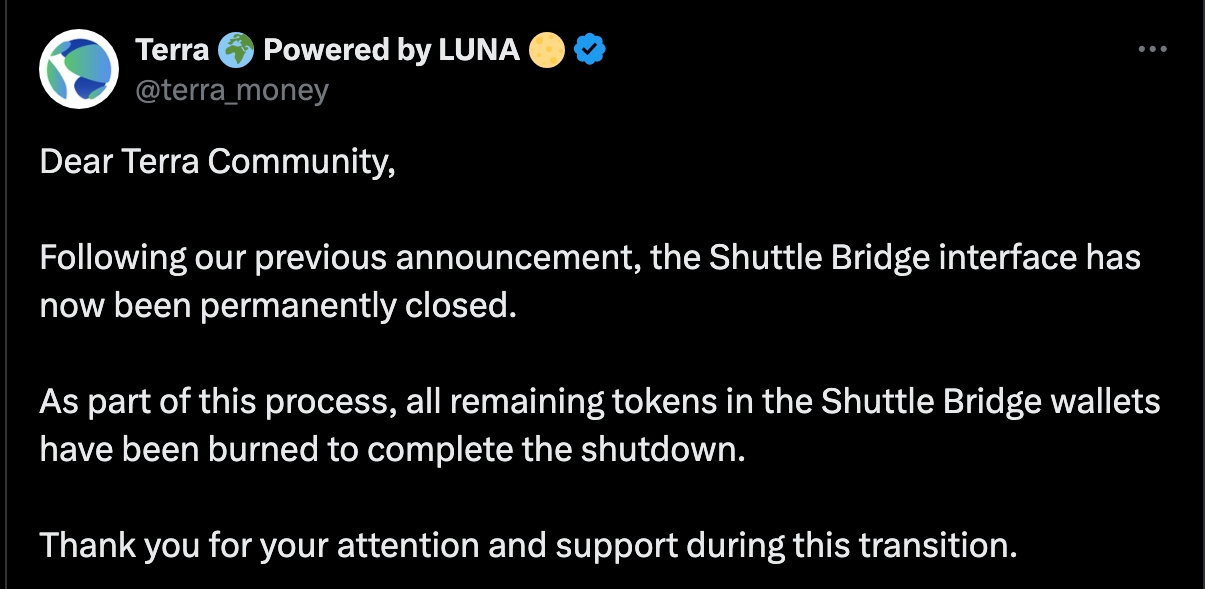
The Terra Classic price crawled back on Tuesday, November 5, reaching an intraday high of $0.000086. This LUNC recovery happened after Terra announced that it had permanently closed the Shuttle Bridge and burned the remaining tokens.
Terra Classic Price Reacts to Shuttle Bridge Closure
In an X post, Terra announced that it had permanently closed the Shuttle Bridge interface. This closure led to the burning of the remaining LUNC and USTC tokens in the bridge. A token burn happens when tokens are moved to a discrete address that cannot be accessed.
The closure happened a few months after the developers opened the bridge to facilitate the redemption of the existing wrapped tokens. Precisely, the bridge helped users to send their LUNC and USTC bridged to Ethereum, BNB Chain, and Harmony back to Terra Classic.
The opening of the Shuttle Bridge was part of the Terraform’s Chapter 11 bankruptcy proceedings, a few years after its collapse. As part of the settlement with the Securities and Exchange Commission, Terraform Labs had to burn the remaining tokens.
Terra Luna Classic Price Is At Risk
The LUNC price formed a double-top pattern around $0.00025 earlier this year, which explains why it has dropped by 65% from its highest level in March. The neckline of this pattern was at $0.000087, where it was trading on November 5.
Terra Luna Classic price has remained below the 78.6% Fibonacci Retracement level. Most importantly, it has remained below the 50-day Weighted Moving Average indicator and the Ichimoku cloud.
The LUNC token has formed two bearish chart patterns. It has created a rising wedge, which is made up of converging higher lows and higher highs. In most periods, this pattern leads to a breakdown, especially when the two lines are nearing their confluence.
Terra Luna Classic has formed a bearish pennant chart pattern consisting of a long vertical line and a triangle-like pattern.
Therefore, the combination of a double-top pattern, rising wedge, and bearish pennant means that the token will have a bearish breakdown in the near term. If this happens, the next reference level to watch will be $0.000054, its August lows, and 38% below the current level.
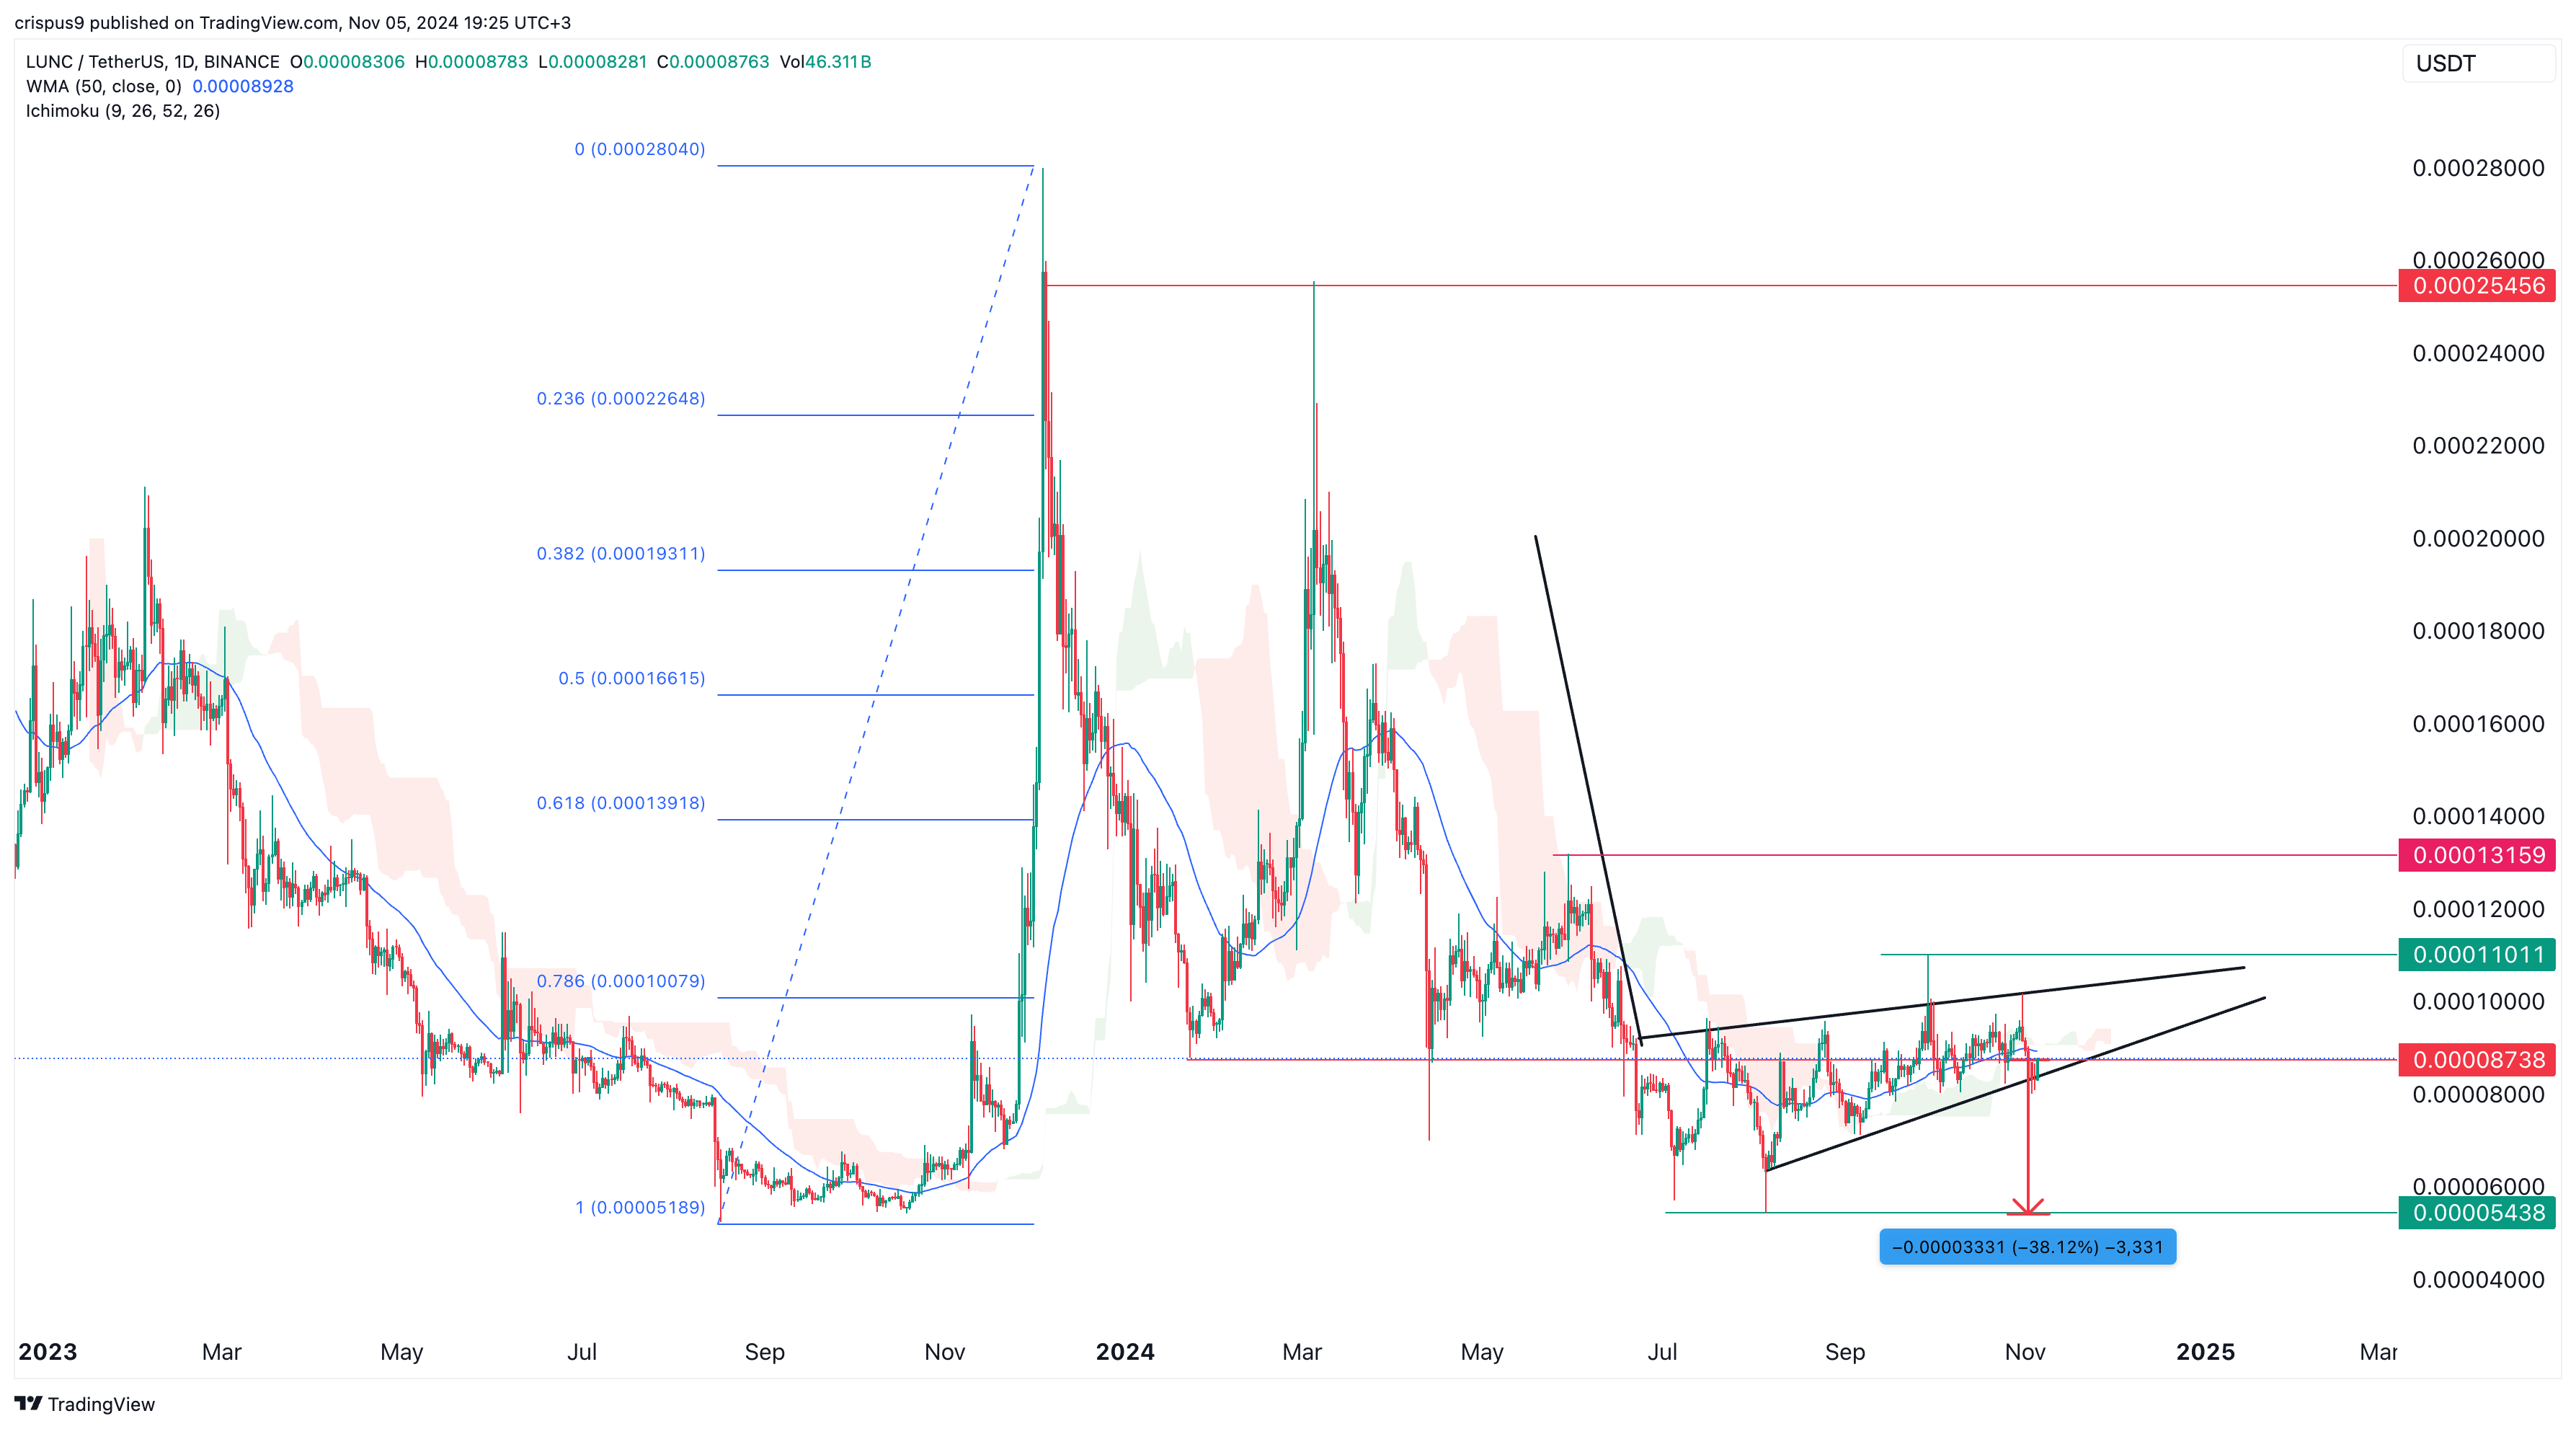
On the flip side, a move above the crucial resistance level at $0.00011, its highest swing in September, will invalidate the bearish view. If this happens, it will rise to the next key resistance level at $0.00013, its highest level in May.
Frequently Asked Questions (FAQs)
Odds are that the end of the Shuttle Bridge will lead to a bearish breakdown since it has formed a bearish pennant and a rising wedge pattern.
Technicals point to more Terra Luna Classic sell-off in the next few weeks. If they are accurate, the coin may drop by 38%.
Based on our technical analysis, the initial support and resistance levels to watch will be at $0.0000054 and $0.00011
crispus
Disclaimer: The presented content may include the personal opinion of the author and is subject to market condition. Do your market research before investing in cryptocurrencies. The author or the publication does not hold any responsibility for your personal financial loss.
Source link

The Bitcoin Report: Key Trends, Insights, and Bitcoin Price Forecast

Eclipse launches public mainnet of first SVM L2 on Ethereum

How Far Can Cardano Price Rise in November?

Bitcoin Indicator Signals Equilibrium After Trump Victory – A Clear Path To New Highs?

Satoshi Nakamoto: The Robin Hood of the Digital Age, But He Stole from Himself

Following SHIB’s success, XYZ coin could bring 19,900% gains: $1,000 could yield $200k

Benjamin Cowen Issues Bitcoin Alert, Says Potential Plunge ‘That Scares People’ Incoming – Here’s His Outlook

Trump Memecoins Tanked More than 50%: Is It The End or Just A Temporary Downfall?

TRUMP, MAGA, and other Trump-themed tokens crash after election day

Dormant Ethereum Whale Returned With Donald Trump’s Win Making $30M

SEC Seeks Court Approval to Dismiss Kraken’s Major Legal Defenses

How Trump’s Promises Could Influence BTC $250k forecast

Polymarket Faces French Ban After Massive Bets On US Election Results

Bitcoin (BTC) Price Hits $76K as Crypto Liquidations Soar, Coinbase (COIN) Rockets 30% Higher on Trump Sweep

Trump victory creates over 11k new Bitcoin millionaires
182267361726451435

Top Crypto News Headlines of The Week
Why Did Trump Change His Mind on Bitcoin?

New U.S. president must bring clarity to crypto regulation, analyst says

Ethereum, Solana touch key levels as Bitcoin spikes

Bitcoin Open-Source Development Takes The Stage In Nashville
Bitcoin 20% Surge In 3 Weeks Teases Record-Breaking Potential

Ethereum Crash A Buying Opportunity? This Whale Thinks So

Will XRP Price Defend $0.5 Support If SEC Decides to Appeal?

Shiba Inu Price Slips 4% as 3500% Burn Rate Surge Fails to Halt Correction

‘Hamster Kombat’ Airdrop Delayed as Pre-Market Trading for Telegram Game Expands

Washington financial watchdog warns of scam involving fake crypto ‘professors’

Citigroup Executive Steps Down To Explore Crypto
Mostbet Güvenilir Mi – Casino Bonus 2024

Bitcoin flashes indicator that often precedes higher prices: CryptoQuant

 2 months ago
182267361726451435
 24/7 Cryptocurrency News3 months ago
Top Crypto News Headlines of The Week

 Donald Trump3 months ago
Why Did Trump Change His Mind on Bitcoin?
 News2 months ago
New U.S. president must bring clarity to crypto regulation, analyst says
 Bitcoin4 months ago
Ethereum, Solana touch key levels as Bitcoin spikes
 Opinion4 months ago
Bitcoin Open-Source Development Takes The Stage In Nashville
 Bitcoin3 months ago
Bitcoin 20% Surge In 3 Weeks Teases Record-Breaking Potential
 Altcoins3 months ago
Ethereum Crash A Buying Opportunity? This Whale Thinks So

✓ Share: