
Avalanche price analysis
Avalanche Price Analysis Signals $40 Rally As Buyers Break 60-Day Correction.
The cryptocurrency market displayed a sluggish trend over the weekend, with most cryptocurrencies attempting to stabilize following the weekday rally. Bitcoin’s price saw a modest increase of 0.4%, while AVAX surged by 8%, reaching a five-week high of $31.6. The Avalanche price analysis indicated a significant rally, marking a breakout from a falling wedge pattern that represented a two-month correction.
Avalanche Price Analysis: TVL and Futures Interest Boost Investor Confidence

Amid the July market recovery, the Avalanche coin correction managed to bottom at the $21.8 price support. The bullish reversal boasted the altcoin value of 45% to trade at $31.4, while the market cap surged to $12.4 Billion.
Interestingly, the bearish pullback reverted precisely from the 50% Fibonacci retracement level indicating a healthy correction for buyers to replenish strength. This also indicates the broader trend for the asset remains bullish.
On Saturday, the Avalanche price analysis showcased a bullish breakout from the resistance trendline of a falling wedge pattern. In theory, the two converging trend lines indicate the bearish momentum is gradually diminishing, allowing buyers to retake control. This chart setup has carried the last two months’ correction in Avalanche and the breakout signals a change in market dynamics.
Additionally, the Total Value Locked (TVL) in Avalanche has experienced a strong recovery, increasing from $689.5 million to $951.7 million—a 38% rise. This substantial growth suggests a boost in investor confidence and heightened activity in the Avalanche ecosystem.

Simultaneously, the Futures Open Interest in the Avalanche network experienced a substantial rise, climbing from $173.6 million to $254.1 million—an increase of 46%. This notable growth indicates heightened trader engagement and a positive outlook in Solana’s futures market.

The upcoming week could show a minor pullback to breached resistance and validate its availability as potential support. If the wedge pattern breakout sustains, the AVAX price prediction hints at a potential rally to $41.8, followed by $65.4.
Technical indicators
- Exponential Moving Average: The coin price reclaiming the fast-moving 20D and 50D EMAs indicates an initial sign of trend reversal.
- Directional Movement Index: A positive crossover between the DI+ (blue) and DI-(orange) slope indicates buyers are strengthening their grip over this asset.
Frequently Asked Questions (FAQs)
TVL is important because it indicates the amount of capital being utilized within the ecosystem, reflecting its usage, adoption, and overall health.
rising open interest indicates that more traders are entering the market and opening new positions, which suggests increased trader engagement and a potentially strong trend.
The Fibonacci retracement level is a tool used in technical analysis to identify potential support and resistance levels.
Related Articles
The presented content may include the personal opinion of the author and is subject to market condition. Do your market research before investing in cryptocurrencies. The author or the publication does not hold any responsibility for your personal financial loss.
Source link


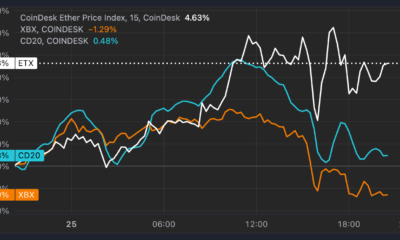


This week, the crypto market witnessed a selling pressure, which tumbled the Bitcoin price from $64500 to $58090, registering a 10% loss. The bearish shift triggered a correction trend across major altcoins, raising concerns of a prolonged downtrend into September. However, the AVAX and LINK price analysis shows recovery potential amid the listing announcement on Hong Kong’s HashKey Exchange.
AVAX and LINK Price Hints Reversal on Retail Listing Approval in HK
Hong Kong-based HashKey Exchange recently announced the listing approval of AVAX (Avalanche) and LINK (Chainlink) for retail investors. This move signifies the expansion of the web3 landscape in HK, which previously restricted retail trading to Bitcoin (BTC) and Ethereum (ETH).
Livio Weng, CEO of HashKey Exchange, noted, “ There may be many reasons for this acceleration, but the main catalyst may have been particularly when Trump expressed his intention to have Web3 happen in the United States.” in an interview with the South China Morning Post (SCMP).
Furthermore, this crypto exchange has revealed that it had submitted the third phase of the application for approval of tokens for retail traders. Amid this report, the AVAX and LINK prices managed to hold above key support levels of $24 and $11, respectively.
AVAX Price Analysis Signals Recovery to Target $30
On August 22nd, the AVAX price gave a decisive breakout from the resistance trendline of a falling wedge pattern. This pattern, characterized by two converging trendlines, signaled a steady correction trend for the past five months.
The post-breakout jump pushed the asset price to $28 high before reverting back to $24.5. With an intraday gain of 1.6%, the Avalanche price prediction shows sustainability above the 20-day EMA and the downsloping trendline of the wedge pattern as flipping support. If the pullback sustains, the AVAX price could rally to $1.33, marking a 34.4% potential gain, followed by an extended rally to $41.8.

If the Avalanche price analysis hints at a reversal within the wedge setup, the sellers could pull the asset back to $17.3 support.
LINK Price Analysis Eyes 17% Jump Before Major Breakout
The Chainlink price analysis shows the same falling wedge pattern formation in the daily time frame chart. On August 5th, LINK price rebounded from the pattern’s lower trendline, uplifting its value by 42.5% to reach $11.51, while the market cap jumped to $7B.
Consequently, the buyers reclaimed the midline of Bollinger band indicators, suggesting an initial shift in market sentiment. As the LINK price witnessed a renewed buying pressure at $10.8 support, the buyers could drive a 17% upswing to challenge the pattern’s overhead trendline. A successful breach could drive an extended value to $19.2.

However, if the overhead trendline persists, the Chainlink price prediction could witness a prolonged downfall.
Frequently Asked Questions (FAQs)
The recovery potential for Avalanche and Chainlink prices is driven by the listing approval on Hong Kong’s HashKey Exchange
The crypto market experienced selling pressure, leading to a 10% drop in Bitcoin’s price from $64,500 to $58,090 and triggering a correction trend across major altcoins.
Avalanche is holding above the $24 support level, while Chainlink remains steady above $10.8 despite the market sell-off
Sahil Mahadik
Sahil is a dedicated full-time trader with over three years of experience in the financial markets. Armed with a strong grasp of technical analysis, he keeps a vigilant eye on the daily price movements of top assets and indices. Drawn by his fascination with financial instruments, Sahil enthusiastically embraced the emerging realm of cryptocurrency, where he continues to explore opportunities driven by his passion for trading
Disclaimer: The presented content may include the personal opinion of the author and is subject to market condition. Do your market research before investing in cryptocurrencies. The author or the publication does not hold any responsibility for your personal financial loss.
Source link
Avalanche price surged 3.5% during Saturday’s trading session, buoyed by a broader market uptick. This recovery helped AVAX overcome a key resistance level that had persisted for five months, signaling a major trend reversal. Most major altcoins also saw significant gains this week as Bitcoin price climbed from $57,800 to $64,000, marking a 10% increase. Will the bullish trajectory be sustained?
Avalanche Price Rebounds as Franklin Templeton Integrates $420M FOBXX Fund
On August 22, Franklin Templeton, a global investment firm, expanded the reach of its Franklin OnChain U.S. Government Money Fund (FOBXX) with Integration on the Avalanche network. Launched in 2021, FOBXX is the first U.S.-registered mutual fund to utilize a public blockchain for transaction processing and share ownership recording.
One share of the $420 million Fund is represented by one BENJI token. Token holders can gain exposure to the Fund through the Benji Investments app. The integration with the Avalanche network aims to enhance accessibility while tapping into the increasing number of institutional participants utilizing Avalanche’s technology.
Alongside this announcement and Grayscale’s Avalanche Trust Fund, the Avalanche price gained additional bullish momentum, pushing it past the $25 psychological level.
In addition, Franklin Templeton has introduced new features for FOBXX. It now allows Benji wallet holders to convert USDC stablecoin to invest in the fund’s shares and transfer them peer-to-peer on the public blockchain. The blog post highlighted–
“Bringing the Benji platform to the Avalanche network further expands access to our first-of-its-kind tokenized money market fund,” said Roger Bayston, Head of Digital Assets at Franklin Templeton. “We look forward to working with Avalanche’s vibrant developer community to bring new blockchain-enabled innovations into the market.”
AVAX Coin Hints Breakout From Major Reversal Pattern
Since mid-August, the Avalanche price prediction has projected a high momentum recovery with nine consecutive green candles in the daily chart. This bullish recovery uplifted the asset from $19.78 to $27.7, registering a 40% growth while the market cap boosted $11.4 Billion.
Last Thursday, the rising AVAX price gave a decisive breakout from the resistance trendline of a falling wedge pattern, signaling an early signal of trend recovery. This chart pattern consisting of two converging trend lines has led to a steady correction in Avalanche coins since March 2024.
Amid the breakout, the buyers managed to reclaim fast-moving 20-and-50-day Exponential Moving Averages, projecting a positive shift in the near-term trend. If the bullish momentum persists, the AVAX price could rally 20% to challenge the $33 resistance, followed by a $41.8 peak.

On the contrary note, the Avalanche price trades below the 100- and 200-day EMAs, suggesting a broader trend remains bearish. If sellers push the asset back within the wedge pattern, the previous bullish breakout could be invalidated, potentially leading to a correction to $17.4 support.
Frequently Asked Questions (FAQs)
The recent surge in Avalanche price was driven by a broader market uptick, alongside key developments such as Franklin Templeton launching its $420M tokenized fund on the Avalanche network and Grayscale’s Avalanche Trust Fund.
If the bullish momentum persists, Avalanche could rally 20% to challenge the $33 resistance, with a potential peak at $41.8.
The breakout from the falling wedge pattern indicates an early signal of trend recovery for Avalanche, reversing the steady correction seen since March 2024.
Sahil Mahadik
Sahil is a dedicated full-time trader with over three years of experience in the financial markets. Armed with a strong grasp of technical analysis, he keeps a vigilant eye on the daily price movements of top assets and indices. Drawn by his fascination with financial instruments, Sahil enthusiastically embraced the emerging realm of cryptocurrency, where he continues to explore opportunities driven by his passion for trading
Disclaimer: The presented content may include the personal opinion of the author and is subject to market condition. Do your market research before investing in cryptocurrencies. The author or the publication does not hold any responsibility for your personal financial loss.
Source link
Major XRP rivals are gaining traction among crypto participants as the recent conclusion of the long-running Ripple vs. US Securities and Exchange Commission (SEC) case failed to ignite the expected rally. On August 7th, Judge Analisa Torres ruled that Ripple Labs would pay $125 Million of the $2 Billion initial fine sought by the U.S SEC, a decision that some see as a victory for the blockchain payments company.
While the XRP price still wavers around the $0.55 mark, the potential investors can consider the below competitors poised for notable growth in the 3rd quarter.
1. XRP Rivals – Stellar (XLM)
Stellar (XLM), the blockchain project closest among XRP rivals, focuses on financial inclusivity by enabling quick, low-cost cross-border transactions that appeal particularly to unbanked populations globally.
Over the past two years, the XLM price showcased a sideways action resonating within two converging trendlines of the symmetrical triangle pattern. A recent reversal from the pattern’s lower trendline has uplifted the asset from $0.075 to $0.096, registering a 26% growth.
According to Coingecko data, the Stellar coin holds a market cap of $2.8 Billion, while the 24-hour trading volume is $46.5 Million. With sustained buying, the altcoin could rise over 40% to challenge the overhead resistance trendline at $0.137.
A bullish breakout from the triangle pattern will signal a major trend reversal in Stellar price prediction.

XLM/USD 1d Chart
2. Solana (SOL)
Solana (SOL) is a high-performance blockchain platform designed for decentralized applications (dApps) and crypto projects. According to Coinmarketcap data, Solana is the fifth largest cryptocurrency, boasting a market cap of $64.6 Billion.
Over the past year, this altcoin has surged 540% to $139, emerging as a high-performing asset. However, this recovery could be an initiation push after the FTX collapse crash, as leading asset management companies showed interest in Solana-based products in the traditional market.
The SOL price has been down 2.4% in the last 24 hours, likely heading to the flag pattern support at $100. On-chain data from The Block suggests that the number of new addresses has decreased by 30% to 956.3k in August. This decline indicates a slowdown in network activity and user engagement.
Thus, the Solana price prediction hints at a healthy retracement before a breakout from the flag pattern.

3. Toncoin (TON)
TON blockchain, closely linked with the Telegram messaging app, is designed for high-speed, low-cost transactions and supports a variety of decentralized applications. Toncoin stands strong among the XRP rivals due to its rapid price growth backed by Network Total Volume Locked (TVL) and famous Tap-to-earn games.
Data from Coingecko shows that Toncoin holds a market cap of $16.1 Billion, securing its position as the eighth-largest cryptocurrency. Moreover, Intotheblock analystics shows the number of addresses with Balance skyrocketed to 40.54 Million, registering a YTD growth of 1025%.

The Toncoin price is down 1.65% to trade at $6.44. A potential breakout from the overhead trendline will signal the end of correction and bolster the buyers to surpass the All-time high barrier of $8.2.

4. SUI
SUI is a layer-1 blockchain network providing a secure, robust, scalable development platform. The native cryptocurrency of the network, SUI, recently caught the attention of investors with a sharp recovery from $0.46 to $1.17—- a 141% increase in August’s sluggish market.
This rapid growth can be attributed to the recent launch of Grayscale’s SUI Trust Fund and price breakout from a 4-month downward channel. The SUI coin currently trades at $0.817 and holds a market cap of $2.1 Billion.
The current pullback in SUI price could retest the breach channel resistance at $7.5 before the next leap. The post-correction rally could drive the altcoin to an initial target of $1.44, followed by ATH at $2.18.

5. Binance Coin (BNB)
Binance coin is the native token of the largest centralized cryptocurrency exchange in terms of trading volume. Along with the exchange, the BNB token powers the entire Binance ecosystem, including the Binance smart chain, NFT market, DeFi services, etc.
Over the past year, the BNB has increased by 129% to make a new all-time high of $724 in June 2024. Despite the founder, Changpeng Zhao, being arrested, the BNB token and the Binance ecosystem flourished. As CZ is expected to be released this September, along with the potential rate cuts in the US, the BNB coin price will likely skyrocket.
The BNB price is trading at $530 with an intraday gain of 5.36%, which forms a morning start in the weekly chart. In the daily chart, the BNB price trend shows a double-bottom reversal in a megaphone pattern. As a trend continuation pattern, it increases the possibility of an extended bull run in the coming times.

6. Avalanche (AVAX)
In the race of Ethereum-killer, Avalanche is right behind Solana with a market cap of $8 billion and a growing ecosystem. As the crypto market grows with increasing global adoption, Avalanche will likely find new markets and niches.
The AVAX token among the top contenders of XRP rivals shows a 78% rise in the last year and forms a 52-week high at $65.38. Trading at a discount of 86% from its all-time high at $147.50, AVAX exchanges hands at $20.46.
Furthermore, Avalanche faces a threat of huge incoming supply with a token unlock of 9.54 million tokens on August 20. Thus, a potential surge in supply with the unlock could dilute the market price to lower levels.
The daily chart shows a bearish wedge in the AVAX price trend, accounting for a 66% drop in 150 days. Currently, the bull cycle struggles to gain momentum as it takes a lateral exit. A breakout of either of the converging trendlines will decide the upcoming trend in Avalanche price prediction.

7. Polkadot (DOT)
Polkadot, known as the internet of the crypto world, allows cross-blockchain data transfer. Based on its four-year history, Polkadot is a fast and highly scalable layer-1 project. As the number of blockchain projects increases along with the high chunks of value over top blockchain, Polkadot and similar projects will gain traction for user convenience.
DOT token price witnesses a rise in bearish influence over the past year, resulting in a 7% drop. However, compared to the 52-week high at $11.89 formed in March 2024, the DOT price is down by 68% and trades at $4.330.

With a bearish trendline in action, the DOT price is in a downtrend and has experienced multiple rejections. However, as a rising star among XRP rivals, the Polkadot price may soon skyrocket with a breakout run to reclaim $10.
Frequently Asked Questions (FAQs)
The conclusion of the Ripple vs. SEC case, which resulted in a significantly reduced fine for Ripple, did not trigger the expected rally in XRP’s price.
Solana’s substantial market capitalization and its high-performance capabilities for decentralized applications make it an attractive option for ETFs.
Toncoin has seen a dramatic increase in the number of addresses with balances, growing its market cap substantially.
Sahil Mahadik
Sahil is a dedicated full-time trader with over three years of experience in the financial markets. Armed with a strong grasp of technical analysis, he keeps a vigilant eye on the daily price movements of top assets and indices. Drawn by his fascination with financial instruments, Sahil enthusiastically embraced the emerging realm of cryptocurrency, where he continues to explore opportunities driven by his passion for trading
Disclaimer: The presented content may include the personal opinion of the author and is subject to market condition. Do your market research before investing in cryptocurrencies. The author or the publication does not hold any responsibility for your personal financial loss.
Source link

Bitcoin Dips to $93,000 With $400 Million in Longs Rekt. Where to From Here?

You Can Now Invest In Bitcoin And Open-source Companies

Trump holds $7 million in crypto: Arkham Intelligence

John Deaton Calls Out Gary Gensler For Ties With Sam Bankman-Fried

Ethereum’s ETH Outperforms as Bitcoin (BTC) Price Recoils Off $100K Sell Wall

Safegcd’s Implementation Formally Verified

US detaining Bitcoin mining equipment at border: report

Robinhood Lists Dogwifhat, WIF Price To $5?

MicroStrategy Adds 55,500 More BTC To Its Portfolio For $5.4 Billion

Newmarket Capital Launches Battery Finance, Bitcoin-Collateralized Loan Strategy

Can the XRP price realistically jump to $10 in 2024?

Shiba Inu Price Eyes 76% Rally As 6.8m SHIB Tokens Burned

VanEck Doubles Down on Big Bitcoin Price Target, Says Key Indicators Continue To ‘Signal Green’

Multichain AI token poised to dethrone SOL, TON: 5,000% gains expected

Will Pi Network Price Reach $100 in This Bull Market?
182267361726451435
Why Did Trump Change His Mind on Bitcoin?

Top Crypto News Headlines of The Week

New U.S. president must bring clarity to crypto regulation, analyst says

Ethereum, Solana touch key levels as Bitcoin spikes

Bitcoin Open-Source Development Takes The Stage In Nashville

Will XRP Price Defend $0.5 Support If SEC Decides to Appeal?

Bitcoin 20% Surge In 3 Weeks Teases Record-Breaking Potential

Ethereum Crash A Buying Opportunity? This Whale Thinks So

Shiba Inu Price Slips 4% as 3500% Burn Rate Surge Fails to Halt Correction

‘Hamster Kombat’ Airdrop Delayed as Pre-Market Trading for Telegram Game Expands

Washington financial watchdog warns of scam involving fake crypto ‘professors’

Citigroup Executive Steps Down To Explore Crypto
Mostbet Güvenilir Mi – Casino Bonus 2024

Bitcoin flashes indicator that often precedes higher prices: CryptoQuant

 2 months ago
182267361726451435

 Donald Trump4 months ago
Why Did Trump Change His Mind on Bitcoin?
 24/7 Cryptocurrency News3 months ago
Top Crypto News Headlines of The Week
 News3 months ago
New U.S. president must bring clarity to crypto regulation, analyst says
 Bitcoin4 months ago
Ethereum, Solana touch key levels as Bitcoin spikes
 Opinion4 months ago
Bitcoin Open-Source Development Takes The Stage In Nashville
 Price analysis4 months ago
Will XRP Price Defend $0.5 Support If SEC Decides to Appeal?
 Bitcoin4 months ago
Bitcoin 20% Surge In 3 Weeks Teases Record-Breaking Potential

✓ Share: