
Composite Trend Oscillator
XRP Rally To $0.6360 Subsides As Price Faces New Decline

In recent trading activities, XRP has taken a significant hit in its latest attempt to rally toward its previous high of $0.6360. Despite initial bullish momentum suggesting a potential breakout, XRP could not sustain its upward trajectory. The failure to reach the anticipated target has led to a notable decline in value, raising concerns among traders and analysts about the short-term outlook for XRP.
As XRP struggles with these hurdles, this article seeks to analyze its current price movement and the technical indicators suggesting a sustained drop. The goal is to provide readers with a comprehensive understanding of the token’s potential future trajectory.
XRP was trading at $0.5974 at the time of writing, indicating a 1.13% gain. The cryptocurrency has garnered a trading volume of more than $2 billion and a market capitalization of more than $33 billion. Over the past day, XRP’s trading volume has increased by 41.17%, while its market cap has increased by 1.13%.
Initial Bullish Momentum Falters
On the 4-hour chart, although XRP is still actively trading above the 100-day Simple Moving Average (SMA), its price is currently on a bearish move towards the $0.5725 mark after failing to sustain its upward trajectory. If the digital asset continues its current bearish trend, it could drop below the $0.5725 mark.
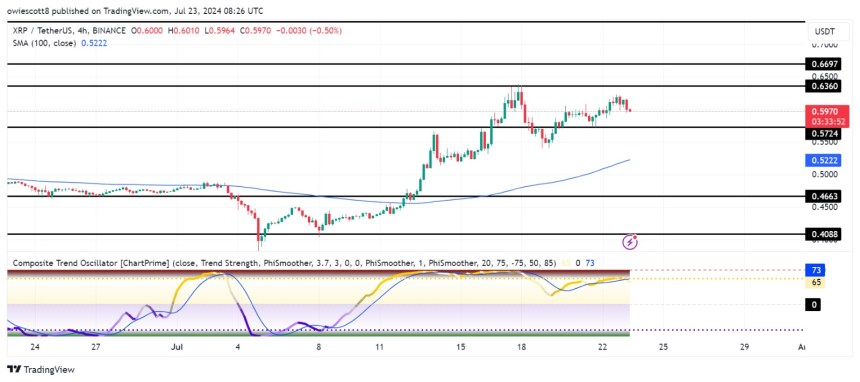
The 4-hour Composite Trend Oscillator indicates that XRP may continue its bearish trajectory toward the $0.5725 mark, as the signal line is currently attempting a drop below the SMA of the indicator. If the signal line crosses below the SMA, both lines are likely to move toward the zero line, signaling a potential extended decline for the coin.
On the 1-day chart, following the failure of XRP to sustain its upward trajectory to its previous high of $0.6360, the price is currently attempting a single candle bearish move toward the $0.5725 mark, trading above the 100-day SMA. This bearish momentum may drive the digital asset to reach the $0.5725 mark.
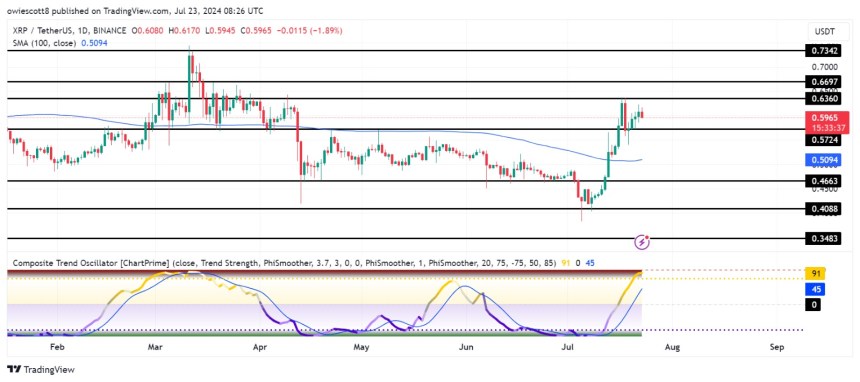
Lastly, it can be observed that the signal line is currently trading in the overbought zone and is attempting to move downward toward the SMA of the indicator. This formation in the composite trend oscillator suggests that XRP’s price may continue its bearish movement toward $0.5725 before potentially starting to move upward again.
Expert Insights On Crucial XRP Levels To Monitor
Should the price of XRP decline to the $0.5725 mark and encounter rejection, it would likely start an upward movement toward the $0.6360 resistance mark. A successful breach above this target could potentially trigger further upward movement to test the $0.6697 resistance and beyond.
Nevertheless, should XRP’s price approach the $0.5725 support range and break below, it may likely continue to move downward toward the $0.4663 support level. A further break below the $0.4663 support level might lead to a price drop toward the $0.4088 support point and other lower levels.
Source link


Uniswap (UNI) based on recent price movements has experienced a 13% rebound, pushing its price above the critical $5.6 level. This rebound which follows a period of bearish surge by the cryptocurrency has raised optimism among investors and traders as to whether the bulls can maintain this momentum and drive the price even higher.
By offering insights and expert analysis, this article aims to provide readers with a comprehensive analysis of Uniswap’s recent 13% price rebound, which has pushed it above the $5.6 price mark. Additionally, it will assess the sustainability of the bullish momentum and evaluate whether the bulls can maintain control and drive UNI’s price higher.
UNI is currently trading at around $5.77 and has increased by 13% with a market capitalization of over $3.4 billion and a trading volume of over $274 Million as of the time of writing. In the last 24 hours, the asset’s market cap has increased by 13.23%, while its trading volume has decreased by 13.55%.
Technical Indicators: Signs Of Sustained Bullish Momentum For UNI
Currently, the price of UNI on the 1-hour chart is bullish and is heading toward the 100-day Simple Moving Average (SMA). The digital asset has been on an upward spiral since breaking above the key level of $5.6, which indicates that the bulls are gaining control of the market and could drive the price higher.

Additionally, an analysis of the 1-hour Composite Trend Oscillator reveals that the bulls are currently controlling the market. The signal line and its SMA have risen above the zero line and are approaching the overbought zone. This indicates that there is potential for the price to continue climbing higher.
On the 4-hour, although Uniswap is still trading below the 100-day SMA, it can be observed that the crypto asset is attempting a bullish move toward the $6.7 resistance level. After the rebound at $4.8, UNI has been showing bullish resilience, thereby keeping its pace above this level. With this recent positive momentum, the digital asset could extend its rally to other resistance levels.
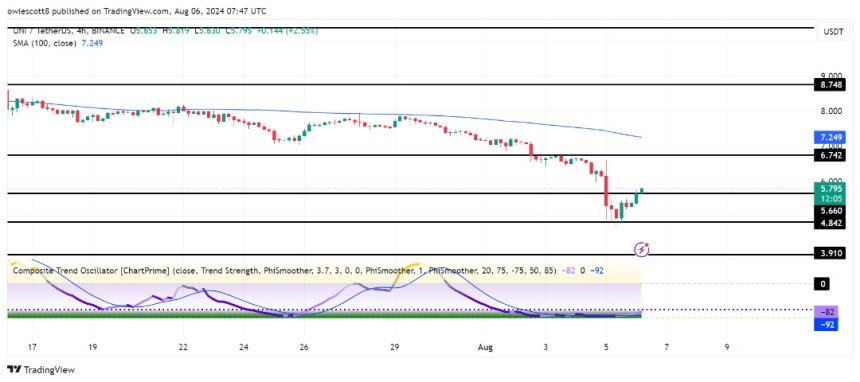
Finally, on the 4-hour chart, the composite trend oscillator also indicates a rising bullish strength for the cryptocurrency as the signal has crossed above the SMA of the indicator and both are attempting to move out of the oversold zone.
Expert Opinions: Will The Bulls Maintain Control?
If the bulls can sustain their strength in the market, the price of UNI will continue to move upward toward the $6.7 resistance range. Should the price break and close above the $6.7 level, it may continue its rally toward the next resistance point at $8.7 and possibly other levels beyond.
However, if Uniswap reverses its route at any of the previously mentioned resistance levels, it would begin to drop toward the direction of its previous support range at $5.6. When the price breaches this support level, it could signify a deeper bearish trend, leading to further price declines towards other lower levels.
Featured image from Vectorstock, chart from Tradingview.com
Source link

Currently, the price of BNB has been attempting a bullish momentum movement toward the bullish trendline. This bullish move which is the second attempt the crypto asset is making after a successful break below the trendline is sparking up optimism among traders and investors alike that a break above could ignite a potential rally toward the $635 resistance mark.
As BNB’s bullish sentiment continues to build, this article aims to analyze its current price actions and technical indicators pointing toward sustained growth to provide readers with adequate insight into BNB’s potential future actions.
BNB’s price is currently trading at around $580, up by 4.15% with a market capitalization of over $85 billion and a trading volume of over $1 9 billion as of the time of writing. In the last 24 hours, there has been a 24-hour increase of %3.82 in BNB’s market capitalization and a 7.89% decrease in its trading volume.
Technical Analysis: Key Trendline And A Potential Rally In Focus
Currently, the price of BNB on the 4-hour chart is trading above the 100-day Simple Moving Average (SMA), attempting an upward move toward the bullish trendline. It can also be observed here that the price of the crypto asset has previously attempted a move on the bullish trendline but enchanters a pullback, which has risen again for a retest.
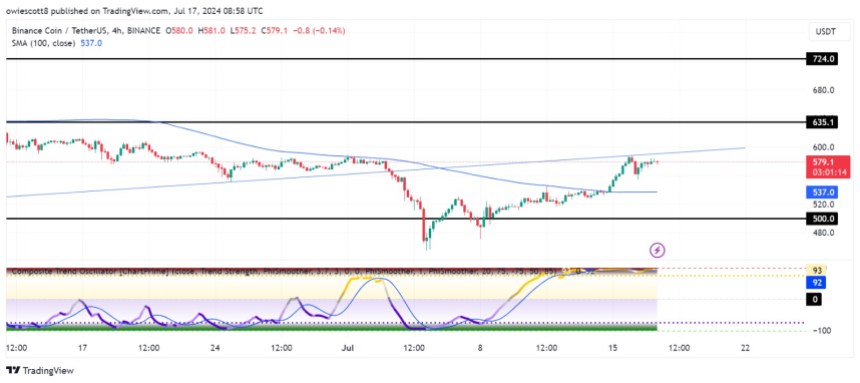
The 4-hour Composite Trend Oscillator also suggests that the crypto asset may potentially sustain its positive sentiment toward the bullish trendline and aim for the $635 resistance level as the signal line and the SMA of the indicator are still trending in the overbought zone and no cross-over attempt has been made.
On the 1-day chart, the price of BNB is bullish and is attempting a move towards the 100-day SMA and the bullish trendline. Although the crypto asset is still trading below the 100-day SMA, with the momentum the price is building, it could potentially break above the trendline and continue to rise toward the $635 resistance level.
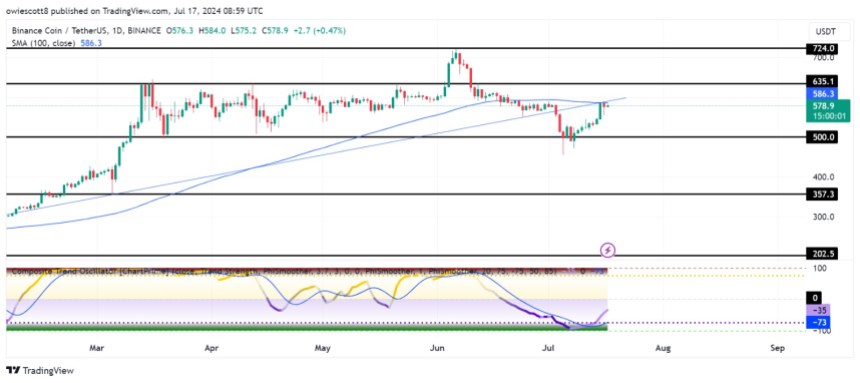
Finally, it can observed that the signal line has crossed above the SMA of the indicator and are both attempting a move out of the oversold zone. With this formation, it can be suggested that BNB may experience more price growth.
Future Outlook: What Lies Beyond For BNB?
BNB is currently attempting a bullish move toward the bullish trendline. If the crypto asset breaks below the bullish trendline, it may start a rally toward the $635 resistance level. A break above this level may trigger a more bullish move for BNB to test the $724 resistance level and other lower levels.
However, if the price of BNB fails to break above the bullish trendline and begins to drop again, it will start to move toward the $500 support level. It could potentially undergo a further drop toward the $357 support level and other lower levels if there is a breach below the $500 support point.
Source link

BTC Risks Falling To $20K If This Happens

Most Layer 2 solutions are still struggling with scalability

Here’s why Stellar Price Could Go Parabolic Soon

Perp-Focused HyperLiquid Experiences Record $60M in USDC Net Outflows

Experts say these 3 altcoins will rally 3,000% soon, and XRP isn’t one of them

Robert Kiyosaki Hints At Economic Depression Ahead, What It Means For BTC?

BNB Steadies Above Support: Will Bullish Momentum Return?

Metaplanet makes largest Bitcoin bet, acquires nearly 620 BTC

Tron’s Justin Sun Offloads 50% ETH Holdings, Ethereum Price Crash Imminent?

Investors bet on this $0.0013 token destined to leave Cardano and Shiba Inu behind

End of Altcoin Season? Glassnode Co-Founders Warn Alts in Danger of Lagging Behind After Last Week’s Correction

Can Pi Network Price Triple Before 2024 Ends?

XRP’s $5, $10 goals are trending, but this altcoin with 7,400% potential takes the spotlight

CryptoQuant Hails Binance Reserve Amid High Leverage Trading

Trump Picks Bo Hines to Lead Presidential Crypto Council
182267361726451435
Why Did Trump Change His Mind on Bitcoin?

Top Crypto News Headlines of The Week

New U.S. president must bring clarity to crypto regulation, analyst says

Will XRP Price Defend $0.5 Support If SEC Decides to Appeal?

Bitcoin Open-Source Development Takes The Stage In Nashville

Ethereum, Solana touch key levels as Bitcoin spikes

Bitcoin 20% Surge In 3 Weeks Teases Record-Breaking Potential

Ethereum Crash A Buying Opportunity? This Whale Thinks So

Shiba Inu Price Slips 4% as 3500% Burn Rate Surge Fails to Halt Correction

Washington financial watchdog warns of scam involving fake crypto ‘professors’

‘Hamster Kombat’ Airdrop Delayed as Pre-Market Trading for Telegram Game Expands

Citigroup Executive Steps Down To Explore Crypto
Mostbet Güvenilir Mi – Casino Bonus 2024

NoOnes Bitcoin Philosophy: Everyone Eats

 3 months ago
182267361726451435

 Donald Trump5 months ago
Why Did Trump Change His Mind on Bitcoin?
 24/7 Cryptocurrency News4 months ago
Top Crypto News Headlines of The Week
 News4 months ago
New U.S. president must bring clarity to crypto regulation, analyst says
 Price analysis4 months ago
Will XRP Price Defend $0.5 Support If SEC Decides to Appeal?
 Opinion5 months ago
Bitcoin Open-Source Development Takes The Stage In Nashville
 Bitcoin5 months ago
Ethereum, Solana touch key levels as Bitcoin spikes
 Bitcoin5 months ago
Bitcoin 20% Surge In 3 Weeks Teases Record-Breaking Potential
