
PEPE
Is Pepe Coin Ready for a 40% Climb to ATH? Reversal Pattern Offers Insights

The crypto market started the new week on a bearish note after Bitcoin suddenly dropped to $66700 on Monday. The BTC price witnessed intense supply pressure of $70000, which has stalled the recovery trend in the altcoin market since last week. Amid the sell-off, the Pepe coin records an intraday loss of 1% to hit $0.0000116, prolonging its breakout from the inverted head and shoulder pattern.
Also Read: Breaking: US Government Transfers 29,800 Bitcoin From Silk Road
77% of PEPE Coin Holders in Profit: Is a Major Price Breakout Imminent?
Despite the broader market recovery, the Frog-themed meme coin PEPE has showcased a sluggish trend over the past two weeks. The price, forming alternate green and red candles in the daily chart, shows no clear initiation from buyers or sellers to drive the asset.
The daily RSI slope wavering at 50% accentuates a neutral sentiment among market participants.
However, a deeper technical chart analysis shows this consolidation as an accumulation trend before an inverted head-and-shoulder breakout. The bullish reversal pattern is commonly spotted at the market bottom and projects a clear change in market sentiment with a new high-low formation.

The PEPE coin price currently trades at $0.0000116, with a market cap of $4.88 Billion. A potential breakout from the neckline resistance will signal a significant reversal and provide buyers with suitable support for a further rally.
According to the chart dynamic, the post-breakout rally may drive the asset 40% higher to a new high of $0.000018.
Also Read: Breaking: Mt. Gox Readies Transfer of Remaining 80.5K Bitcoins, BTC Faces Pressure
The Global In/Out of the Money (GIOM) metric for Pepe Coin presents a positive outlook. Currently, 77% of PEPE coin addresses are ‘in the money’ (showing profits), whereas only 11% are ‘out of the money’ (incurring losses). This distribution hints at potential price stability, as most investors are in a profit-will-uplift panic selling scenario.

Approximately 35,230 addresses that acquired 56.5 trillion PEPE at prices between $0.0000110 and $0.0000130 are breakeven. A potential breakout from the Inverse Head and Shoulders (H&S) pattern would also propel these holders into profit. Additionally, the tiny red spheres on the GIOM chart indicate minimal resistance for PEPE to reach its all-time high.
The 50D and 100D EMA wavering close to $0.0000108 creates a strong buyer support zone. Thus, a breakdown below this support could invalidate the bullish thesis and plunge the asset 12% to hit an ascending trendline since April 2024.
Defending this support is crucial for buyers, as a further breach could lead to a major correction.
Frequently Asked Questions (FAQs)
No trend remains same in an asset indicate the PEPE price is poised for a major move. Amid the bullish inverted head and shoulder pattern the market dynamic lean in buyers favour.
‘In the money’ refers to a situation where the current price of an asset is higher than the purchase price, resulting in a profit for the holder.
The Relative Strength Index (RSI) measures the speed and change of price movements, providing insight into overbought or oversold conditions.
Related Articles
Sahil Mahadik
Sahil is a dedicated full-time trader with over three years of experience in the financial markets. Armed with a strong grasp of technical analysis, he keeps a vigilant eye on the daily price movements of top assets and indices. Drawn by his fascination with financial instruments, Sahil enthusiastically embraced the emerging realm of cryptocurrency, where he continues to explore opportunities driven by his passion for trading
Disclaimer: The presented content may include the personal opinion of the author and is subject to market condition. Do your market research before investing in cryptocurrencies. The author or the publication does not hold any responsibility for your personal financial loss.
Source link


During Monday’s trading session, the Pepe coin price saw a 3% drop, retesting the crucial $0.00001 support level. This bearish movement aligned with Bitcoin’s fall below the $65,000 mark, sparking a corrective phase across several major altcoins. Despite this, PEPE is set for a sharp recovery, driven by accumulation and the completion of a bullish pattern.
Can PEPE Coin Price Surge to $0.000015 by October?
Within a month, the PEPE coin price rallied $0.00000633 to $0.0000119— an 89% increase. This bullish reversal managed to reclaim crucial daily EMAs (20, 50, 100, and 200), signaling a positive change in market sentiment.
A deeper analysis of the daily chart shows this reversal breached the resistance trendline of a falling wedge pattern. This chart pattern drove a steady correction within two converging trendlines for four months before offering a breakout.
The post-rally aligned with the late September rally pushed the asset to a $0.0000119 high before reverting to $0.0000108. The coin price is poised for temporary consolidation or pullback to $0.00001 and recuperates the bullish momentum.
The post-breakout rally could bolster the asset for $0.0000135 before surpassing the $0.000015 mark.

According to Santiment data, large wallet holders possessing between 100 million and 1 billion PEPE coins have actively accumulated, pushing their holdings to a staggering 13.51 trillion coins. This significant increase in accumulation suggests that whales are positioning themselves for a potential price surge, indicating growing confidence in future price growth.

Check out the article on top meme coins to buy for a detailed analysis.
PEPE Coin Faces Potential Downturn as 30-Day MVRV Hits 38.7%
The Santiment analytics shows the 30-day MVRV (Market Cap to its Realized Cap) ratio recently spiked to 38.7%, indicating that short-term traders are in profit. Typically, the high value coincides with the market top, and speculative traders commence profit booking,
Thus, if the Pepe coin price breaks below the $0.00001 support, the sellers could accelerate the bearish momentum for the prolonged fall.

Conclusion:
If the PEPE price post-rally correction manages to sustain above the $0.00001 level by mid-October, a recovery toward $0.000015 is likely.
Frequently Asked Questions (FAQs)
If the PEPE price sustains above the $0.00001 support by mid-October, a recovery toward $0.000015 is likely, supported by accumulation and bullish momentum.
The 30-day MVRV ratio spiked to 38.7%, signaling that short-term traders are in profit, which often coincides with a market top and may lead to profit booking by speculative traders
The breakout from a falling wedge pattern and a bullish crossover between the 20- and 100-day EMAs indicate a potential end to the four-month correction
Sahil Mahadik
Sahil is a dedicated full-time trader with over three years of experience in the financial markets. Armed with a strong grasp of technical analysis, he keeps a vigilant eye on the daily price movements of top assets and indices. Drawn by his fascination with financial instruments, Sahil enthusiastically embraced the emerging realm of cryptocurrency, where he continues to explore opportunities driven by his passion for trading
Disclaimer: The presented content may include the personal opinion of the author and is subject to market condition. Do your market research before investing in cryptocurrencies. The author or the publication does not hold any responsibility for your personal financial loss.
Source link

Meme coin PEPE has been on an impressive rally for some time now. Stemming from a broader influx of funds into the meme coin sector and the overall cryptocurrency market that has been in motion for the past two weeks, PEPE is currently up by 38% in the last seven days, outperforming its meme coin counterparts with larger market caps.
Related Reading
Interestingly, this impressive price action has seen PEPE breaking out of a downtrend pattern that has lasted for the past six months. This significant development was highlighted on the social media platform X by well-known crypto analyst Captain Faibik.
According to the analyst, PEPE’s price action has resulted in an upward breakout from a symmetrical triangle pattern, a technical formation that has been dictating its consolidation period for half a year.
Breakout From 6-Month Consolidation Pattern
Using a PEPE / Tether US chart shared on social media platform X, Captain Faibik highlighted PEPE’s price action since the beginning of the year. The chart showed that since it reached its all-time high of $0.00001717 on May 27, 2024, PEPE has yet to return to this price point. Periods of rallies have been characterized by the formation of lower highs and higher lows, leading to the formation of a symmetrical triangle pattern.
PEPE’s recent 38% rally has seen the meme coin break out substantially from the upper resistance trendline of the symmetrical triangle. From this point, the only place left to go is up.
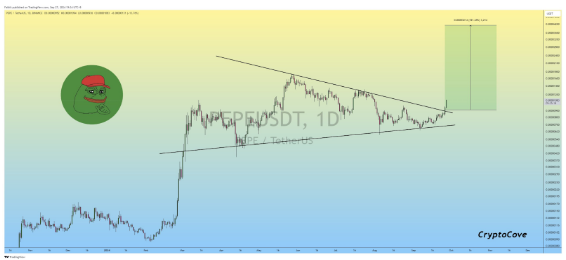
Analyst Predicts 351% Surge To New ATH
With the breakout confirmed, Captain Faibik has set a bullish price target for PEPE. In terms of a price target, Captain Faibik noted that PEPE is now clear for a rally to a new all-time high. Specifically, he predicted a rally to a price target of $0.00003214.
Getting to this price point would necessitate PEPE stepping into new price territories. Furthermore, the price target means PEPE would need to surge by an impressive 351.69% from its breakout point. Given the meme coin’s recent history, such a price surge is very possible, especially as the crypto industry is now transitioning into a predicted bullish fourth quarter.
As always with meme coins, extreme volatility and rapid price changes are expected. This is because investments in meme coins largely depend on the general sentiment among cryptocurrencies like Bitcoin, Ethereum, and sometimes Dogecoin (the king of meme coins).
Related Reading
At the time of writing, PEPE is trading at $0.00001125, still on a 38% gain throughout last week. Other meme coins are on comparable gains in this time frame. Shiba Inu (SHIB) is up by 32%, Dogwifhat (WIF) rose by 33%, Bonk (BONK) climbed by 30%, and Floki (FLOKI) added 23%.
Dogecoin (DOGE), on the other hand, is up by a smaller 17% in the past seven days. These gains could continue into the coming week as the market remains bullish.
Featured image from Rolling Stone, chart from TradingView
Source link
Altcoins
Top Analyst Says One Memecoin Is His Fastest Horse, Updates Outlook on Altcoin Dubbed As Solana Killer

An analyst who earned the “Master Trader” rank on the crypto exchange Bybit believes that one frog-themed memecoin will leave most digital assets in the dust.
Pseudonymous trader Bluntz tells his 276,300 followers on the social media platform X that he sees Pepe (PEPE) pulling off an over 2x rally en route to a fresh all-time high.
The trader shares a chart suggesting that PEPE could surge to as high as $0.22.
“I like to chart all my meme positions against each other to gauge what looks the strongest and then designate whichever that one is as my largest bag.
Healthy to have some diversification of course, but I always try to have my largest position in the fastest horse.
The fastest horse (of my bags) seems to be PEPE.”
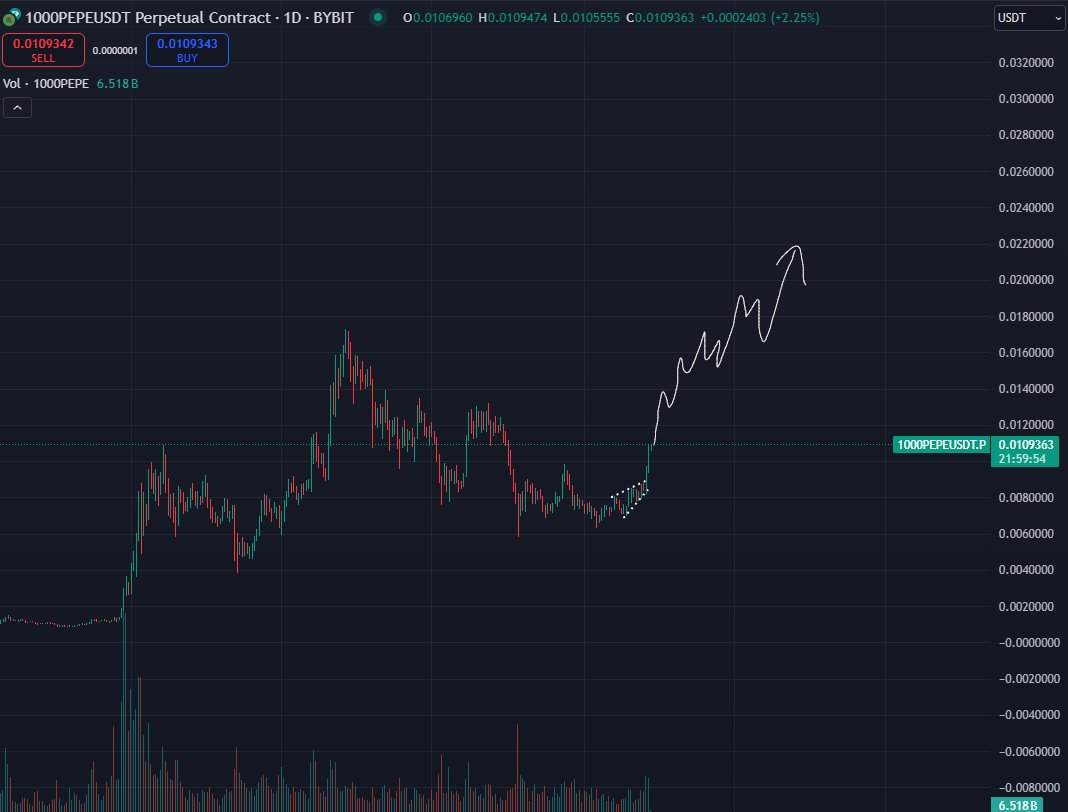
At time of writing, PEPE is trading for $0.000112, up over 5% on the day.
Another altcoin on the trader’s radar is Sui (SUI), a layer-1 crypto project referred to by many as the Solana (SOL) killer.
According to Bluntz, SUI appears to be in the midst of a wave three surge and he sees the altcoin bursting close to $2.60 before its five-wave rally concludes.
“SUI is just a certified beast at this point, every dip on four-hour ends up ABC looking and keeps trucking higher, even this one.
Definitely in a macro wave three still and hasn’t even had a wave four yet.”
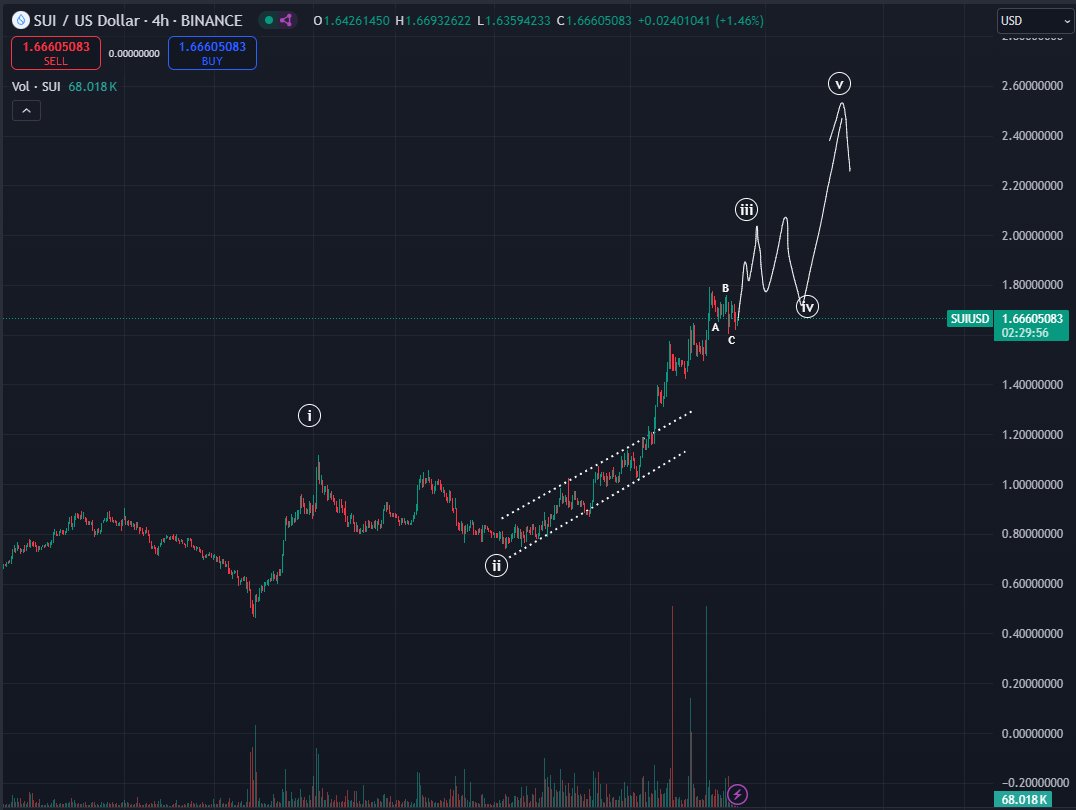
Bluntz relies on Elliott Wave theory, which states that a bullish asset tends to witness a five-wave surge with waves one, three and five serving as impulsive upside bursts and waves two and four as corrective periods. It also suggests that a bullish asset often rallies after an ABC correction.
Based on the trader’s chart, he seems to suggest that SUI will surge above $2 for its third wave before correcting and rallying to new all-time highs.
At time of writing, SUI is worth $1.71.
Don’t Miss a Beat – Subscribe to get email alerts delivered directly to your inbox
Check Price Action
Follow us on X, Facebook and Telegram
Surf The Daily Hodl Mix
 

Disclaimer: Opinions expressed at The Daily Hodl are not investment advice. Investors should do their due diligence before making any high-risk investments in Bitcoin, cryptocurrency or digital assets. Please be advised that your transfers and trades are at your own risk, and any losses you may incur are your responsibility. The Daily Hodl does not recommend the buying or selling of any cryptocurrencies or digital assets, nor is The Daily Hodl an investment advisor. Please note that The Daily Hodl participates in affiliate marketing.
Generated Image: DALLE3
Source link

Whales didn’t sell Bitcoin at $62k, on-chain data shows

HBO Is Joining Search for Bitcoin's Satoshi. Past Attempts Haven’t Turned Out Great.

Will Bitcoin Price Benefit from UAE’s New VAT Exemptions for Virtual Assets?

Will XRP or Cybro hit $3 first?

Will Telegram’s New ‘Gift’ Feature Drive Toncoin Price for $8 Breakout?

Bitcoin Price Lags Beneath $63,000 — What Does This Mean?

Museums, AI-generated art, blockchain, and NFTs

Dogwifhat Price 8% Away From Ending Six-Month Bearish Phase

Analyst PlanB Unveils Potential Trigger for Next Bitcoin ‘Pump,’ Says Whales Waiting for Outcome of One Event

Rollblock’s GambleFi and the future of memecoins

Middle East Tension, US Jobs Data, & XRP Lawsuit Steal Spotlight

why whales are betting on RCO Finance

Why Coinbase Sees Crypto as a Bipartisan, ‘Purple’ Political Issue

US CPI In Focus After Jobs Data Dampens 50 BPS Fed Rate Cut Hopes

Saudi billionaire fuels ETFSwap presale excitement with $5 million bet
182267361726451435

Top Crypto News Headlines of The Week

New U.S. president must bring clarity to crypto regulation, analyst says

Bitcoin 20% Surge In 3 Weeks Teases Record-Breaking Potential

Bitcoin Open-Source Development Takes The Stage In Nashville

Ethereum Crash A Buying Opportunity? This Whale Thinks So

Ethereum, Solana touch key levels as Bitcoin spikes
Why Did Trump Change His Mind on Bitcoin?

Will XRP Price Defend $0.5 Support If SEC Decides to Appeal?

Shiba Inu Price Slips 4% as 3500% Burn Rate Surge Fails to Halt Correction

Citigroup Executive Steps Down To Explore Crypto
Mostbet Güvenilir Mi – Casino Bonus 2024

‘Hamster Kombat’ Airdrop Delayed as Pre-Market Trading for Telegram Game Expands

Bitcoin flashes indicator that often precedes higher prices: CryptoQuant
Crypto Market Movers: 5 Altcoins Making Waves This Bull Run

 3 weeks ago
182267361726451435
 24/7 Cryptocurrency News2 months ago
Top Crypto News Headlines of The Week
 News1 month ago
New U.S. president must bring clarity to crypto regulation, analyst says
 Bitcoin2 months ago
Bitcoin 20% Surge In 3 Weeks Teases Record-Breaking Potential
 Opinion3 months ago
Bitcoin Open-Source Development Takes The Stage In Nashville
 Altcoins2 months ago
Ethereum Crash A Buying Opportunity? This Whale Thinks So
 Bitcoin3 months ago
Ethereum, Solana touch key levels as Bitcoin spikes

 Donald Trump2 months ago
Why Did Trump Change His Mind on Bitcoin?

✓ Share: