Price analysis
Solana Price Holds Above $180 Despite Recent Volatility and SEC Legal Updates
Published
4 months agoon
By
admin
Solana price has experienced significant fluctuations, showing a notable upward trend. The token has been consistently hovering above the $180 support level after breaking through this threshold earlier in the week. This movement represents a robust recovery from its previous position, which saw the token navigating lower support levels.
Solana has peaked at around $193 this week, surging by more than 3%, demonstrating strong market momentum and investor confidence. However, since then, it has experienced a slight pullback, reflecting the typical volatility seen in cryptocurrency markets
Solana Price Fluctuations and Recent Performance
The SEC recently updated its legal action against Binance, excluding Solana from its previous claims identifying certain cryptos as securities. This revision was filed on July 30 in a joint status report with the U.S. District Court for the District of Columbia.
This adjustment aligns with a court’s earlier decision, which concluded that secondary market sales of Binance’s BNB tokens are not securities transactions. This change might alter the U.S.’s regulatory landscape and influence the forthcoming launch of exchange-traded funds based on Solana.
As of the reporting time, SOL price is trading at $180.73, with a slight decrease of 2.74% during the U.S. trading session. Over the past 24 hours, the layer 1 crypto has fluctuated between a low of $179.30 and a high of $187.30. The 24-hour trading volume for Solana has reached $2.9 billion, indicating significant activity in the market.


The technical indicators of Solana reveal a consolidation pattern on the 4-hour chart, as observed on the OKX exchange. The Moving Average Convergence Divergence (MACD) is in the bearish zone, with the MACD line at 0.26, below the signal line of 1.68.
However, the histogram has shrunk, suggesting a decrease in bearish momentum, which may hint at a possible reversal or stabilization in the short term. The Relative Strength Index (RSI) stands at 37, positioning Solana in neutral territory but leaning towards oversold conditions.
SOL price prediction is facing a strong rejection at the $193 level; if bullish momentum mounts, pressure could drive the price toward $200 and potentially up to $250 in the next bullish run.
TVL Surge
According to DefiLlama, Solana has reported substantial activity in its financial ecosystem. The platform’s total value locked (TVL) stands impressively at $5.4 billion. The market capitalization of its stablecoins is also robust, amounting to $3.2 billion.
In terms of transaction fees, Solana has generated $1.88 million in the last 24 hours alone, contributing to revenue of $940,009 during the same period.
The 24-hour trading volume on Solana price has surged to $1.589 billion, with inflows totaling $4.15 million, underscoring the network’s continued investor confidence and financial health.
Support holds at $170, which is crucial for maintaining the current price structure. However, if bears gain more control and selling pressure increases, the price might drop to $160, breaking below the support. If the bearish momentum continues, further decline could be seen, potentially lowering the price to $150.
Frequently Asked Questions (FAQs)
The SEC’s exclusion of Solana from its securities claims has positively impacted investor confidence, potentially influencing Solana’s market performance.
Solana’s TVL, which is $5.4 billion, indicates substantial activity and investor confidence, which can positively influence its price and market stability.
The current support level for Solana is $170. Maintaining this support is crucial to avoid further declines.
Related Articles
Coingape Staff
CoinGape comprises an experienced team of native content writers and editors working round the clock to cover news globally and present news as a fact rather than an opinion. CoinGape writers and reporters contributed to this article.
Disclaimer: The presented content may include the personal opinion of the author and is subject to market condition. Do your market research before investing in cryptocurrencies. The author or the publication does not hold any responsibility for your personal financial loss.
Source link
You may like


US Court Rules Tornado Cash Smart Contracts Not Property, Lifts Ban

Maximizing Bitcoin Accumulation – Beyond the Benchmark

Bitcoin Crashes Under $93,000: What’s Behind It?


Trump in considerations for CFTC to regulate crypto


Will XRP Price Reach $2 By The End Of November?


Here Are Three Promising Altcoins for the Next Crypto Market Bounce, According to Top Trader
Doge price
Crypto Analyst Explains Why Dogecoin Price Will Hit $1
Published
13 hours agoon
November 26, 2024By
admin
Bitcoin’s recent sell-off has affect, Dogecoin leading to a 21% crash. Regardless, the long-term outlook remains bullish, which leads many to believe that the Dogecoin price could be on a path to retest $1 this year. Will DOGE bulls pull through?
Dogecoin Price Could Surge To $1: Analyst
Dogecoin price has dropped to $0.3787, down by 21% from its highest level this year. A 20% drop from a local top of $0.4790 is a sign that it has moved into a short-term retracement. This decline is most likely because of the ongoing crypto sell-off, with Bitcoin falling from this month’s high of $99,700 to $92,000.
However, some analysts believe that the Dogecoin price will bounce back and hit $1. As such, the coin needs to rise by 164% from the current level. In a note, Bluntz, who has almost 300,000 followers, noted that the coin was in the fourth phase of the Elliot Wave.
Elliot Wave is a theory that explains how financial assets move over time. Its impulse phase is made up of five stages, with the third one being the longest. The fourth wave is usually a corrective one and is followed by the bullish fifth wave.


In another post, Gladiator, a popular analyst, estimates that DOGE price has more upside as its performance mirrors that of the last bull cycle in 2021. He expects that the coin could jump to as high as $10 at the turn of the year.
Meanwhile, Trader Tardigrade noted that the value of DOGE coin was forming a high tight flag pattern, a rare sign that indicates a strong upward movement. He expects that Dogecoin will jump to $1, especially if FOMO resumes.


DOGE Price Analysis As It Hits Key Support
Dogecoin price has pulled back after it formed a doji candlestick pattern on November 24. A doji is characterized by long upper and lower shadows and a small body. It is one of the most bearish reversal patterns in the market.
The coin has dropped and hit a crucial support, which is made up of the lowest swings on November 12 and 17. If it ends the day above that support level, it will be a sign that it has formed a morning star candle, a popular bullish reversal sign.
Dogecoin price has remained above the 50-day and 200-moving averages. It is also above the key support at $0.2286, the upper side of the cup and handle pattern.
Therefore, since it has formed a bullish-flag-like pattern, there is a likelihood that it will bounce back in the coming days. If this happens, the initial target will be at $0.4795, its highest swing this month. A break above that level will point to more gains, potentially to $1.


On the other hand, a drop below the lower side of the ascending channel at $0.3646 will invalidate the Dogecoin price prediction. That breakdown could push it to the psychological level at $0.30.
Frequently Asked Questions (FAQs)
Dogecoin needs to rise by 165% to get to $1, which is a possibility in the crypto industry. Just recently, it jumped by 486% from its lowest point in August and this month’s high.
The cryptocurrency industry needs to be doing well and the coin needs to move above the resistance level at $0.4795 for this bull run to happen.
Dogecoin can crash to as low as $0.2286, the upper side of the cup and handle pattern. That move will be confirmed if it drops below $0.30.
crispus
Disclaimer: The presented content may include the personal opinion of the author and is subject to market condition. Do your market research before investing in cryptocurrencies. The author or the publication does not hold any responsibility for your personal financial loss.
Source link
Markets
Can the XRP price realistically jump to $10 in 2024?
Published
2 days agoon
November 25, 2024By
admin
The XRP price has staged a strong recovery this month, making it one of the best-performing top ten cryptocurrencies.
Ripple (XRP) peaked at $1.6305 last week, rising 324% from its lowest point this year and pushing its market cap to over $81 billion. This valuation surpasses major global firms like Deutsche Bank, Marriott International, and BP.
With XRP’s bullish trajectory, analysts have shared optimistic forecasts. Edo Farina, a long-term Ripple supporter, predicted in an X post that the coin could surge to $10 during this bull run.
He cited fundamental catalysts, including expectations that Donald Trump’s victory could resolve Ripple’s ongoing conflict with the Securities and Exchange Commission will be over next year.
Meanwhile, Ripple and Archax have partnered to launch a tokenized fund on the XRP Ledger, signaling renewed activity on the network
Additionally, Ripple is developing RLUSD, a stablecoin intended to compete with Tether (USDT) PayPal USD, and USD Coin (USDC).
There are also rumors of Ripple launching an Initial Public Offering (IPO) in the coming years. A January CNBC report suggested the company postponed its IPO plans due to SEC challenges, a situation that could shift next year.
Can the XRP price jump to $10?
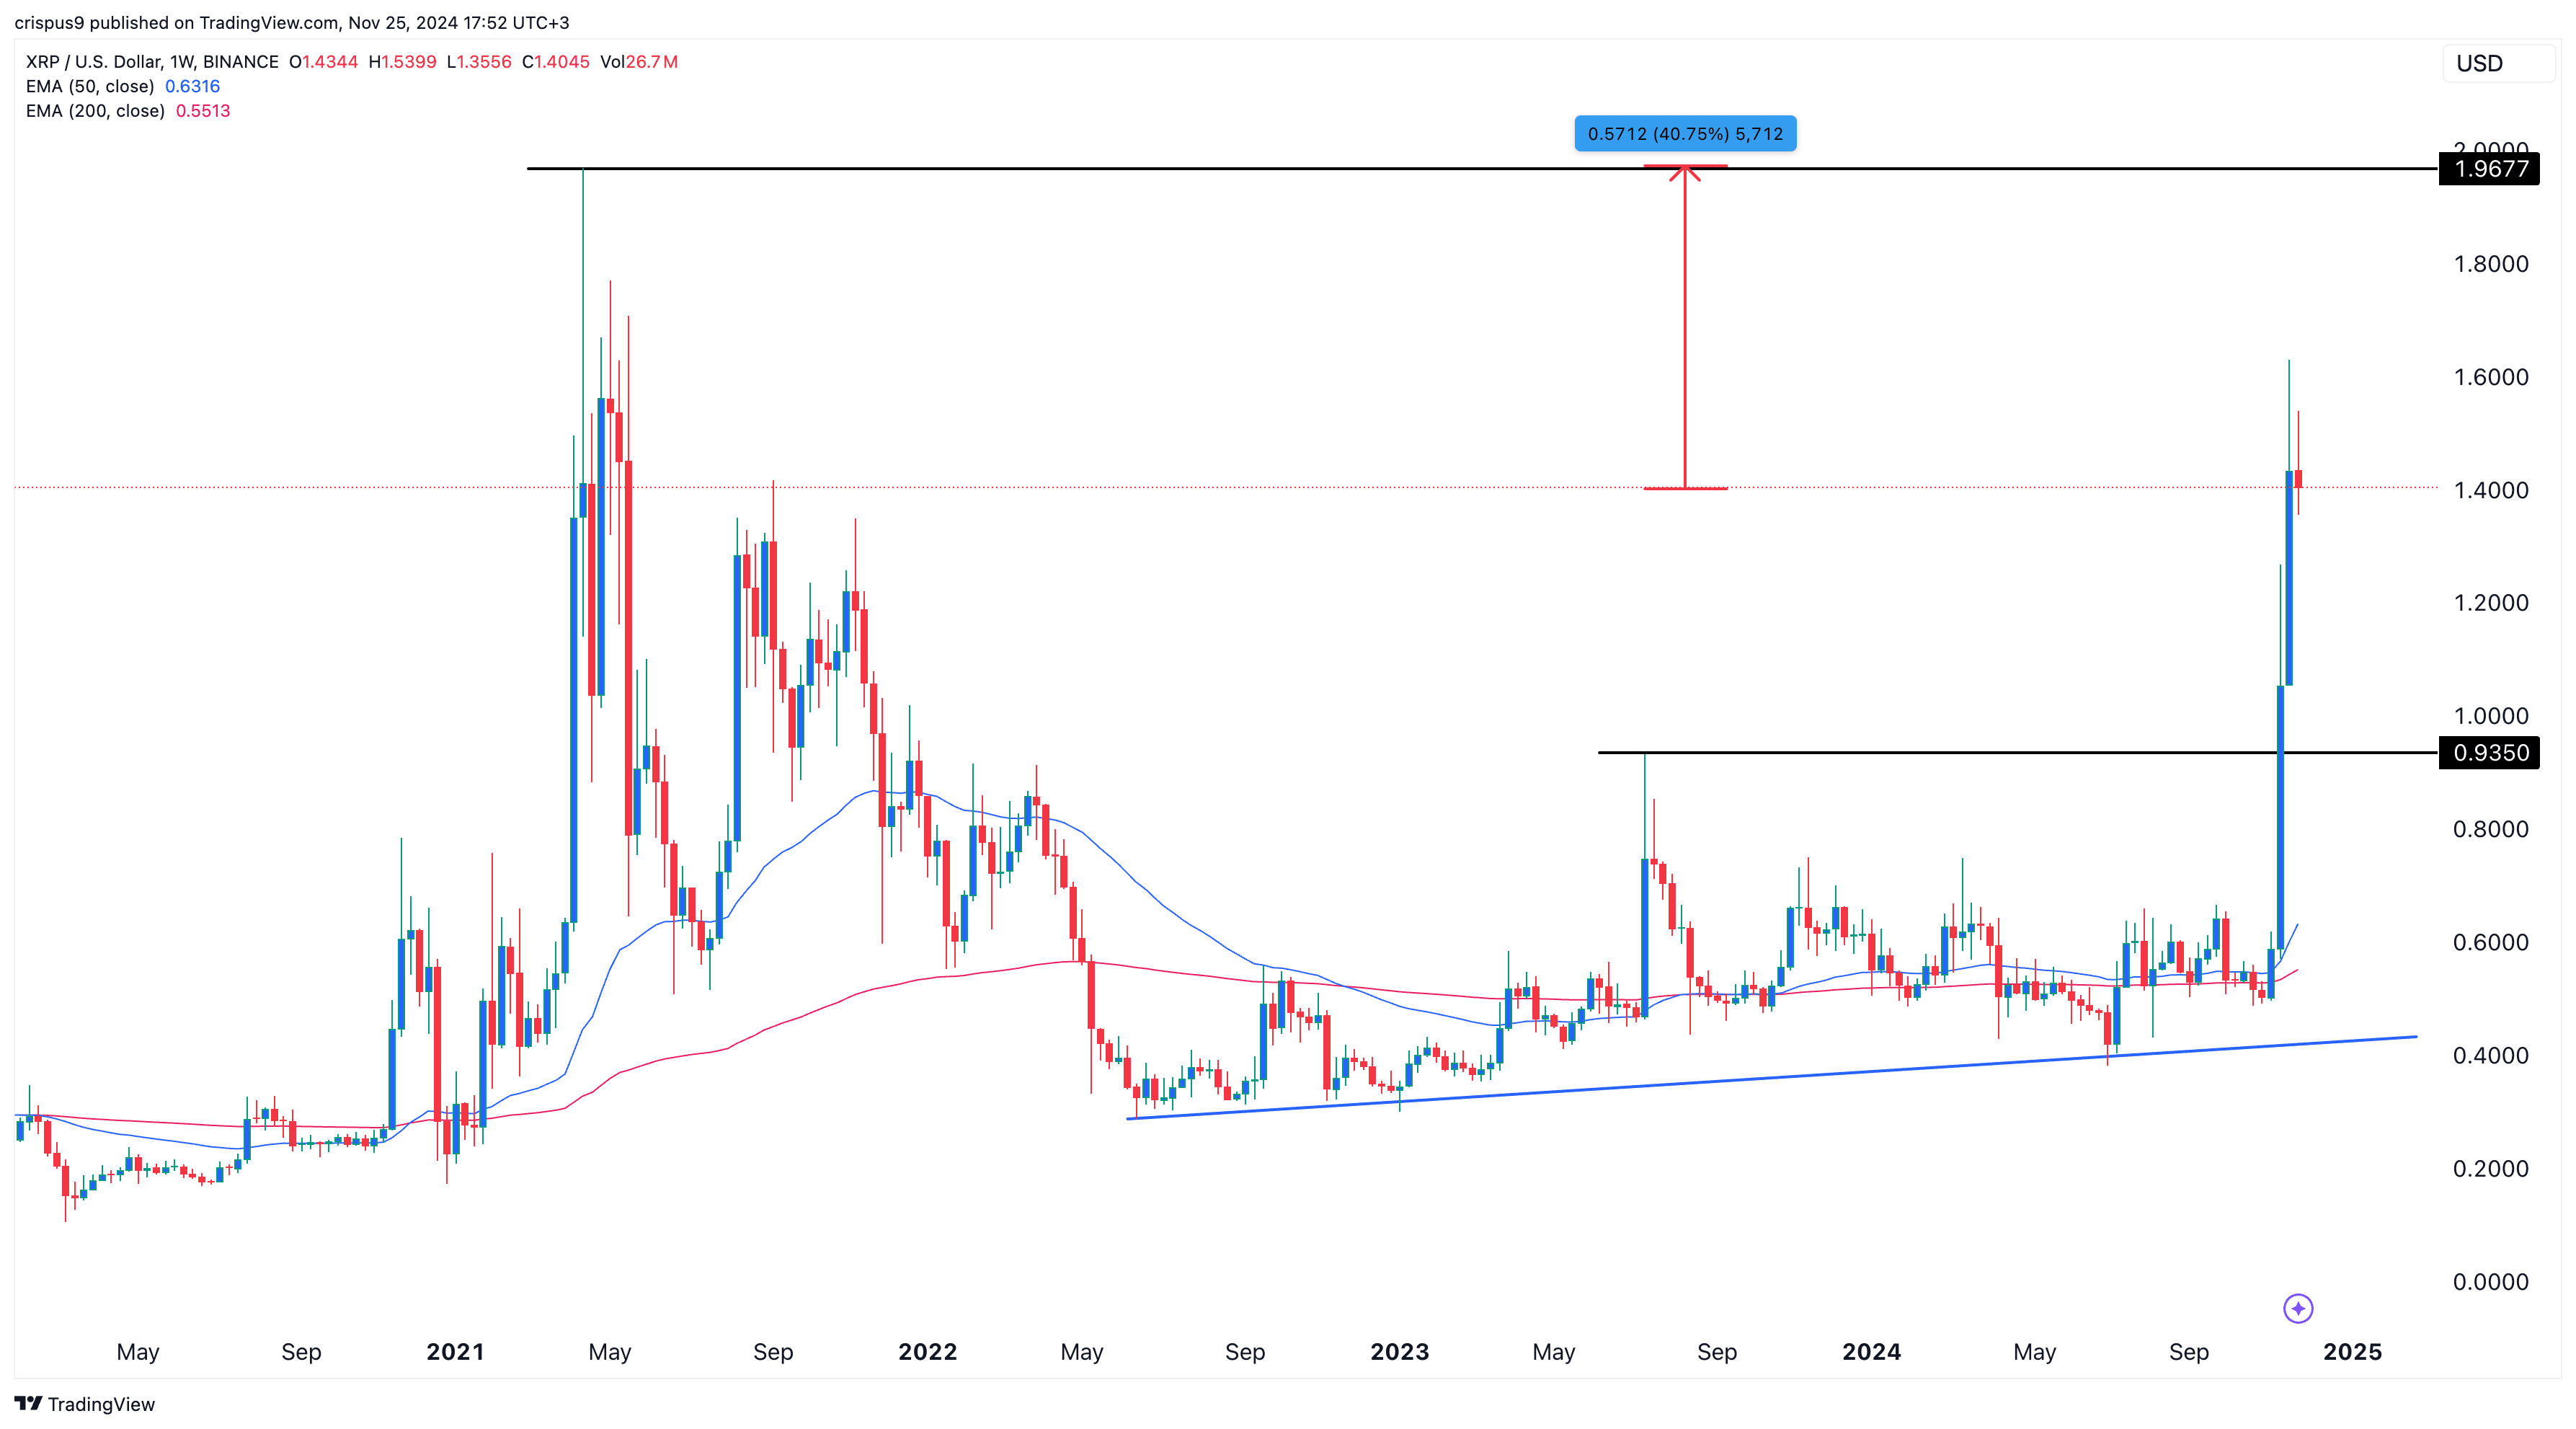
The price of Ripple traded at $1.4381 on Nov. 25, requiring a 600% increase to reach $10. Such a move would exceed its recent performance but aligns with past trends, like its 1,800% jump from 2020 lows to its all-time high in 2021.
The weekly chart shows that Ripple broke the significant resistance level of $0.9350, the neckline of a slanted triple-bottom pattern. The coin has moved above the 50-week and 200-week Exponential Moving Averages, suggesting positive momentum. There are also indications of a bullish pennant pattern forming.
While XRP may continue climbing, potentially reaching its all-time high of $1.96 and further to $5, a leap to $10 in 2024 remains unlikely.
Source link
Price analysis
Shiba Inu Price Eyes 76% Rally As 6.8m SHIB Tokens Burned
Published
2 days agoon
November 25, 2024By
admin
Shiba Inu price has underperformed other popular meme coins in the past few days. SHIB trades at $0.000026 on Monday, where it has been stuck since November 10, as investors anticipate more upside as the burn rate rebounds.
Shiba Inu Price Likely to Rally 76% As 6.8m SHIB Burnt
One potential catalyst for the SHIB price is that the number of coins in circulation continues to drop, helped by the robust token burn. Data by Shiburn shows that the amount of these burns rose by 40% in the past 24 hours to 4.85 million.
Therefore, the number of Shiba Inu tokens has continued to drop from the original 999 trillion to 410 trillion, a figure that will continue falling in the future. The token burn is when SHIB coins are moved to an inaccessible wallet either voluntarily or from ecosystem fees to be removed from the circulating supply forever.
These token burns help to create value for existing tokens by reducing the number of coins in circulation. It is often compared to when a company executes a share buyback, which in turn increases the earnings per share.
Some of the top players in this ecosystem are ShibaSwap and Shibarium. ShibaSwap is a decentralized DEX network where people swap tokens, while Shibarium is a layer-2 network that has completed over 500 million transactions. Data on its website shows that ShibaSwap’s volume has jumped to $75 million this month, the highest level since March.


SHIB Price Analysis: Shiba Inu Bulls Prepares For Uptrend
In an X post, Shib Knight, a popular crypto analyst predicted that the SHIB was preparing for its next leg and that it looked “sendy”.
The most bullish case for the Shiba Inu price rally is a cup-and-handle pattern on the daily chart. This techncial formation contains a rounded bottom that looks like a cup, which is often followed by a minor retracement that forms the handle. Hence, the namesake.
The target of $0.000045 for this setup is obtained by measuring the depth of the cup and adding it to the neckline, connecting the cup and handle’s swing highs.
The upper side of this pattern is at $0.000030, where it has struggled to move above since May. According to this pattern, the ongoing consolidation is part of the formation of a handle section. In most periods, this pattern is one of the most bullish patterns in the market.
Additionally, Shiba Inu price has formed a golden cross pattern as the 50-day and 200-day Exponential Moving Averages (EMA) have formed a bullish crossover. Therefore, the confirmation for the next leg up will come if the SHIB rises above the upper side of the cup at $0.000030. If this happens, SHIB could jump to $0.000045, its highest level this year, which is about 76% above the current level.


On the flip side, this Shiba Inu price prediction will become invalid if the coin drops below the key psychological point at $0.000023. A drop below that level will point to more downside, potentially to $0.0000158, its lowest point on October 25.
Frequently Asked Questions (FAQs)
It has strong technicals after forming a golden cross pattern and a cup and handle. A cross above the cup will point to more gains, potentially to the year-to-date high of $0.000045.
Odds are that the SHIB price will stage a strong rally soon. However, a drop below the support at $0.000022 will invalidate the bullish view and raise the odds of it falling to $0.00001.
Shiba Inu’s burn rate is continuing, while analysts expect the ongoing crypto bull run will continue in the near term.
crispus
Disclaimer: The presented content may include the personal opinion of the author and is subject to market condition. Do your market research before investing in cryptocurrencies. The author or the publication does not hold any responsibility for your personal financial loss.
Source link

US Court Rules Tornado Cash Smart Contracts Not Property, Lifts Ban

Maximizing Bitcoin Accumulation – Beyond the Benchmark

Bitcoin Crashes Under $93,000: What’s Behind It?

Trump in considerations for CFTC to regulate crypto

Will XRP Price Reach $2 By The End Of November?

Here Are Three Promising Altcoins for the Next Crypto Market Bounce, According to Top Trader

Bitcoin Script: Focus On The Building Blocks, Not The Wild Geese

Kraken to close NFT marketplace by February 2025

Kraken To Shut Down Its NFT Marketplace

Pump.fun Accounted for 62% of Solana DEX Transactions in November, So Far

Fidelity Investments Director Shares Bitcoin’s Adoption and Valuation Models

Zodia Custody teams up with Securitize for institutional access to tokenized assets

Crypto Analyst Explains Why Dogecoin Price Will Hit $1

Bitcoin Long-Term Holders Have 163K More BTC to Sell, History Indicates: Van Straten

The transformative potential of Bitcoin in the job market
182267361726451435

Why Did Trump Change His Mind on Bitcoin?

Top Crypto News Headlines of The Week

New U.S. president must bring clarity to crypto regulation, analyst says

Ethereum, Solana touch key levels as Bitcoin spikes

Bitcoin Open-Source Development Takes The Stage In Nashville

Will XRP Price Defend $0.5 Support If SEC Decides to Appeal?

Bitcoin 20% Surge In 3 Weeks Teases Record-Breaking Potential

Ethereum Crash A Buying Opportunity? This Whale Thinks So

Shiba Inu Price Slips 4% as 3500% Burn Rate Surge Fails to Halt Correction

‘Hamster Kombat’ Airdrop Delayed as Pre-Market Trading for Telegram Game Expands

Washington financial watchdog warns of scam involving fake crypto ‘professors’

Citigroup Executive Steps Down To Explore Crypto
Mostbet Güvenilir Mi – Casino Bonus 2024

Bitcoin flashes indicator that often precedes higher prices: CryptoQuant
Trending

 2 months ago
182267361726451435

 Donald Trump4 months ago
Why Did Trump Change His Mind on Bitcoin?

 24/7 Cryptocurrency News3 months ago
Top Crypto News Headlines of The Week

 News3 months ago
New U.S. president must bring clarity to crypto regulation, analyst says

 Bitcoin4 months ago
Ethereum, Solana touch key levels as Bitcoin spikes

 Opinion4 months ago
Bitcoin Open-Source Development Takes The Stage In Nashville

 Price analysis4 months ago
Will XRP Price Defend $0.5 Support If SEC Decides to Appeal?

 Bitcoin4 months ago
Bitcoin 20% Surge In 3 Weeks Teases Record-Breaking Potential


✓ Share: