
bnb
BNB Eyes $605 After Breaking Key Resistance
BNB has demonstrated significant bullish momentum, with a positive candlestick crossing the 100-day Simple Moving Average (SMA) in the 4-hour timeframe. The previous market scenario reveals that the digital currency has faced multiple rejections at the $572 level.
This persistent resistance has cleared a path for the bulls to take charge and drive the price higher aiming at the $605 resistance level. As market dynamics shift, the key question is whether BNB can continue its current upward trend and hit the new target of $605.
In this article, we will analyze the recent price movements of BNB using technical indicators to determine whether the price can sustain its momentum to reach $605 or decline back to $572.
Technical Analysis Indicates Potential Rise To $605
Technical analysis reveals that the price of BNB has successfully crossed above the 100-day Simple Moving Average (SMA) on the 4-hour chart, indicating a potential bullish trend and increased buying momentum. This position indicates that BNB’s price could continue rising as long as it remains above the SMA.
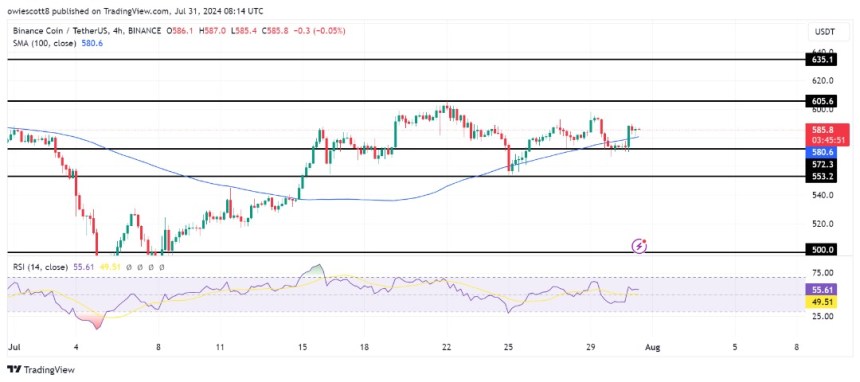
On the 4-hour chart, the Relative Strength Index (RSI) signal line has successfully risen above 50% into the overbought zone, signaling a potential shift in momentum, which suggests that buying pressure is increasing and the asset might experience further upward movement towards the $605.6 level.
Meanwhile, on the daily chart of BNB, the price is attempting to break above the 100-day SMA. A successful cross above this key technical level could signal potential bullish momentum. If BNB maintains its position above the 100-day SMA, it might trigger a sustained uptrend and greater investor confidence.
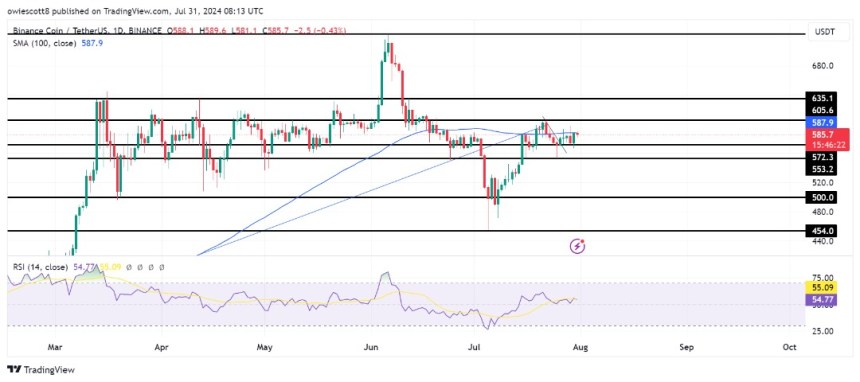
Also, the RSI indicator is trading above 50%, further supporting the possibility of a bullish trend, indicating that buying pressure is currently stronger than selling pressure. BNB’s 1-day chart shows that a bullish engulfing candlestick has formed following the rejection at $572. This pattern demonstrates a potential trend reversal and could make the $605 target achievable.
Key Levels To Observe When BNB Reaches $605 Resistance
BNB is on a bullish trajectory, targeting the $605 resistance level. If the price of BNB breaks and closes above the $605 level, it may continue its rally toward the next resistance level at $635 and possibly other levels beyond.
Nonetheless, should the digital asset face rejection at $605 and fail to break above it, a potential downward move could follow, possibly retreating to $572. The $572 level could act as a key support zone, where the price may stabilize or consolidate. However, if $572 fails to hold, a deeper correction could occur to lower support ranges such as $553.3 and $500.
As of the time of writing, BNB’s price has risen by 2.09%, trading at approximately $585 in the past 24 hours. The cryptocurrency boasts a market capitalization exceeding $85 billion and a trading volume surpassing $1.8 billion, indicating an increase of 2.09% and 3.57% respectively over the same period.
Featured image from Adobe Stock, chart from Tradingview.com
Source link


BNB price is consolidating above the $620 support zone. The price is consolidating and might aim for a fresh increase above the $675 resistance.
- BNB price is struggling to settle above the $700 pivot zone.
- The price is now trading below $680 and the 100-hourly simple moving average.
- There is a key bearish trend line forming with resistance at $675 on the hourly chart of the BNB/USD pair (data source from Binance).
- The pair must stay above the $640 level to start another increase in the near term.
BNB Price Holds Support
After a downside correction, BNB price found support at $620. It is now recovering losses like Ethereum and Bitcoin. There was a move above the $675 level before the bears appeared at $695.
There was a move below the $680 and $675 levels. The price declined below the 50% Fib retracement level of the recovery wave from the $619 swing low to the $693 high. There is also a key bearish trend line forming with resistance at $675 on the hourly chart of the BNB/USD pair.
The price is now trading below $675 and the 100-hourly simple moving average. However, the bulls are now active near the 76.4% Fib retracement level of the recovery wave from the $619 swing low to the $693 high.
If there is a fresh increase, the price could face resistance near the $675 level and the trend line. The next resistance sits near the $692 level. A clear move above the $692 zone could send the price higher. In the stated case, BNB price could test $705.

A close above the $705 resistance might set the pace for a larger move toward the $720 resistance. Any more gains might call for a test of the $735 level in the near term.
Another Dip?
If BNB fails to clear the $675 resistance, it could start another decline. Initial support on the downside is near the $640 level. The next major support is near the $625 level.
The main support sits at $620. If there is a downside break below the $620 support, the price could drop toward the $612 support. Any more losses could initiate a larger decline toward the $600 level.
Technical Indicators
Hourly MACD – The MACD for BNB/USD is losing pace in the bearish zone.
Hourly RSI (Relative Strength Index) – The RSI for BNB/USD is currently above the 50 level.
Major Support Levels – $640 and $620.
Major Resistance Levels – $675 and $692.
Source link

BNB price is consolidating near the $725 zone. The price is showing positive signs and might aim for a move above the $740 resistance.
- BNB price started a downside correction from the $800 resistance zone.
- The price is now trading above $700 and the 100-hourly simple moving average.
- There is a key bearish trend line forming with resistance at $725 on the hourly chart of the BNB/USD pair (data source from Binance).
- The pair must stay above the $715 level to start another increase in the near term.
BNB Price Holds Support
After a close above the $700 level, BNB price extended its increase, like Ethereum and Bitcoin. The bulls were able to pump the price above the $720 and $750 resistance levels.
Finally, the price tested the $800 zone. A high was formed at $794 before there was a downside correction. There was a move below the $750 and $740 levels. However, the price is now holding gains above the $700 level. A low was formed at $688 and the price is now consolidating above the 23.6% Fib retracement level of the downward move from the $795 swing high to the $688 low.
The price is now trading above $700 and the 100-hourly simple moving average. If there is a fresh increase, the price could face resistance near the $725level. There is also a key bearish trend line forming with resistance at $725 on the hourly chart of the BNB/USD pair.
The next resistance sits near the $740 level. It is near the 50% Fib retracement level of the downward move from the $795 swing high to the $688 low. A clear move above the $740 zone could send the price higher.

In the stated case, BNB price could test $750. A close above the $750 resistance might set the pace for a larger move toward the $785 resistance. Any more gains might call for a test of the $800 level in the near term.
Another Dip?
If BNB fails to clear the $725 resistance, it could start another decline. Initial support on the downside is near the $715 level. The next major support is near the $700 level.
The main support sits at $685. If there is a downside break below the $685 support, the price could drop toward the $665 support. Any more losses could initiate a larger decline toward the $650 level.
Technical Indicators
Hourly MACD – The MACD for BNB/USD is losing pace in the bearish zone.
Hourly RSI (Relative Strength Index) – The RSI for BNB/USD is currently above the 50 level.
Major Support Levels – $715 and $700.
Major Resistance Levels – $740 and $750.
Source link

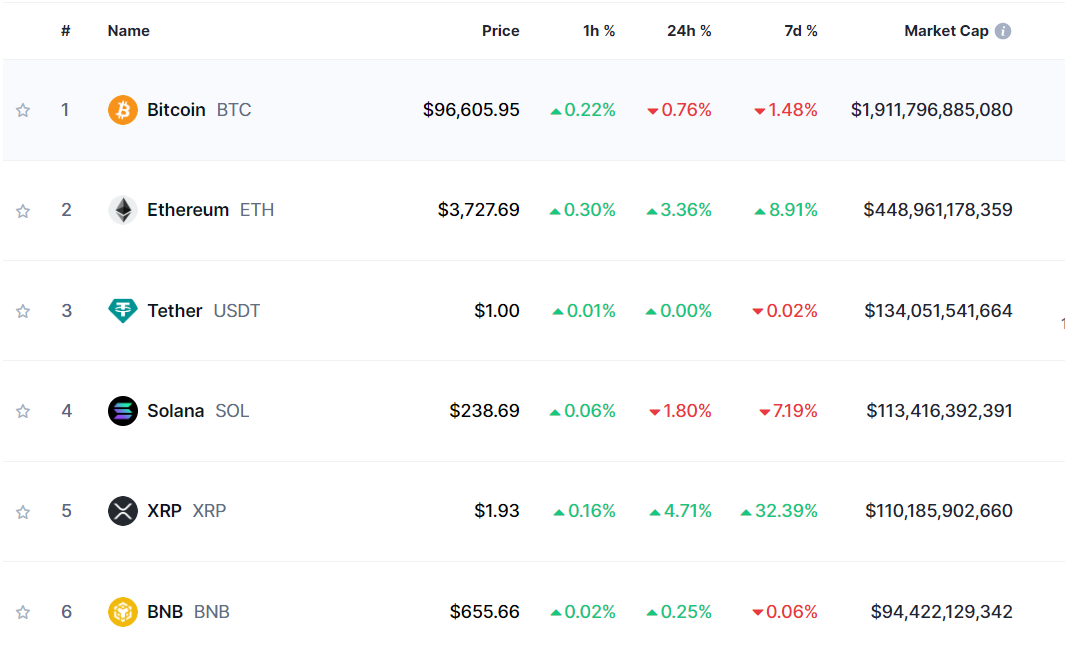
Cross-border payments solution XRP is now the fifth-largest crypto by market capitalization after rallying by nearly 300% in just one month.
Data from CoinMarketCap shows that XRP’s market cap is now hovering at around $110 billion, well above BNB’s valuation of $94.422 billion.
BNB, the native asset of the Binance ecosystem, was the fourth-largest crypto asset at the start of last month while XRP was ranked seventh. But XRP furiously rallied from $0.491 on November 1st to $1.957 on November 30th, printing staggering gains of 298% in as little as 30 days.
XRP is now closing in on Solana (SOL). The layer-1 altcoin and Ethereum (ETH) rival is currently the fourth-largest crypto asset valued at $113.416 billion.
About six years ago, XRP stood as the second-largest crypto by market cap just behind Bitcoin (BTC). But things went downhill for the payments altcoin after the U.S. Securities and Exchange Commission (SEC) sued Ripple in December of 2020, alleging that the firm has been selling XRP as an unregistered security for years.
In July 2023, XRP exploded after Judge Analisa Torres ruled Ripple’s automated, open market sales of XRP are not securities. Judge Torres also tossed out the SEC’s allegations that Ripple executives Brad Garlinghouse and Chris Larsen personally conducted an unregistered securities offering by selling XRP.
At time of writing, XRP is trading for $1.94.
Don’t Miss a Beat – Subscribe to get email alerts delivered directly to your inbox
Check Price Action
Follow us on X, Facebook and Telegram
Surf The Daily Hodl Mix
 

Disclaimer: Opinions expressed at The Daily Hodl are not investment advice. Investors should do their due diligence before making any high-risk investments in Bitcoin, cryptocurrency or digital assets. Please be advised that your transfers and trades are at your own risk, and any losses you may incur are your responsibility. The Daily Hodl does not recommend the buying or selling of any cryptocurrencies or digital assets, nor is The Daily Hodl an investment advisor. Please note that The Daily Hodl participates in affiliate marketing.
Featured Image: Shutterstock/MiniStocker/WhiteBarbie
Source link

BOUNCEBIT price jumps 16% after major partnership

Bullish Lists RLUSD Stablecoin, Here Are Trading Pairs

Wave 2 And 5 Targets Put XRP At $7 And $13

NEIRO’s success shadowed; Catzilla’s presale sparks new market buzz

3 Key Metrics That Hint Bitcoin Price Will Hit $100K Soon

Macro Guru Raoul Pal Predicts Crypto Market Will Rally ‘Pretty Strongly’ Into Year-End – Here’s His Outlook

Blockchain auditor Hacken launches AI-powered MiCA-compliance tool for crypto firms

Crypto in 2024: A Game-Changing Year for Investors

Philippines SEC releases new crypto regulatory framework draft

Another Publicly Traded Firm Just Adopted a Bitcoin Reserve Strategy

MicroStrategy Announces Special Shareholders Meeting to Buy More Bitcoin

These 2 Solana killers have potential turn $1000 into $100k in the next 10 week

BTC Touches $94K, VIRTUAL Soars 35%, ZEC Gains 20%

Trump Makes More Pro-Crypto Appointments

Solaxy presale raises $4.5M for Solana Layer 2 solution
182267361726451435
Why Did Trump Change His Mind on Bitcoin?

Top Crypto News Headlines of The Week

New U.S. president must bring clarity to crypto regulation, analyst says

Will XRP Price Defend $0.5 Support If SEC Decides to Appeal?

Bitcoin Open-Source Development Takes The Stage In Nashville

Ethereum, Solana touch key levels as Bitcoin spikes

Bitcoin 20% Surge In 3 Weeks Teases Record-Breaking Potential

Ethereum Crash A Buying Opportunity? This Whale Thinks So

Shiba Inu Price Slips 4% as 3500% Burn Rate Surge Fails to Halt Correction

Washington financial watchdog warns of scam involving fake crypto ‘professors’

‘Hamster Kombat’ Airdrop Delayed as Pre-Market Trading for Telegram Game Expands

Citigroup Executive Steps Down To Explore Crypto
Mostbet Güvenilir Mi – Casino Bonus 2024

NoOnes Bitcoin Philosophy: Everyone Eats

 3 months ago
182267361726451435

 Donald Trump5 months ago
Why Did Trump Change His Mind on Bitcoin?
 24/7 Cryptocurrency News4 months ago
Top Crypto News Headlines of The Week
 News4 months ago
New U.S. president must bring clarity to crypto regulation, analyst says
 Price analysis4 months ago
Will XRP Price Defend $0.5 Support If SEC Decides to Appeal?
 Opinion5 months ago
Bitcoin Open-Source Development Takes The Stage In Nashville
 Bitcoin5 months ago
Ethereum, Solana touch key levels as Bitcoin spikes
 Bitcoin5 months ago
Bitcoin 20% Surge In 3 Weeks Teases Record-Breaking Potential
