Altcoin
July FOMC decision and its impact on Bitcoin and crypto prices
Published
4 months agoon
By
admin
The Federal Open Market Committee will deliver its July interest rate decision on Wednesday, a move that could impact Bitcoin and other crypto prices.
Cryptocurrencies wait for the Fed decision
Most cryptocurrencies traded in a tight range ahead of the Federal Open Market Committee decision. Bitcoin (BTC) was trading at $66,300, down from this week’s high of $70,000 while Ethereum was at $3,320.
The market cap of all cryptocurrencies was down by just 0.78% to $2.38 trillion. Even some of the best-performing altcoins of the day like Mog Coin (MOG), Kaspa (KAS), and Ripple (XRP) were up by less than 6%.
Economists expect the Federal Reserve will leave interest rates unchanged between 5.50% and 5.25% in this meeting. According to Polymarket, only 4% of participants in the $2.4 million pool expect the bank to slash rates by 25 basis points.
Nonetheless, this will be an important meeting since the bank could provide guidance on when rate cuts will start.
With inflation falling for three consecutive months and the unemployment rate rising, the Fed could point to a September cut. The alternative scenario is where the bank maintains a vague data-dependence posture. In this case, it will watch Friday’s non-farm payrolls data for cues on the labor market and the next consumer price index report. It will then provide guidance on a September cut at the annual Jackson Hole Symposium.
Implication for Bitcoin and altcoins
All assets are impacted by the actions of the FOMC. For example, in 2020 and 2021, BTC and other altcoins soared as the bank slashed rates to zero. They then reversed in 2022 as the bank started its benchmark rates.
One reason Bitcoin and other coins could do well when the Fed starts cutting interest rates is that investors have packed trillions in low-risk assets. Money market funds have accumulated over $6.1 trillion in assets as investors benefit from the average return of 5%.
Money Market Funds totaled more than $6.1 Trillion at the end of the 2nd quarter, an all-time record. And U.S. households were the biggest contributors! pic.twitter.com/SwAb6ek7Ll
— Barchart (@Barchart) July 30, 2024
These assets will be less attractive when interest rates start moving downwards. As a result, there are chances of a rotation to riskier assets like stocks, crypto, and Bitcoin ETFs.
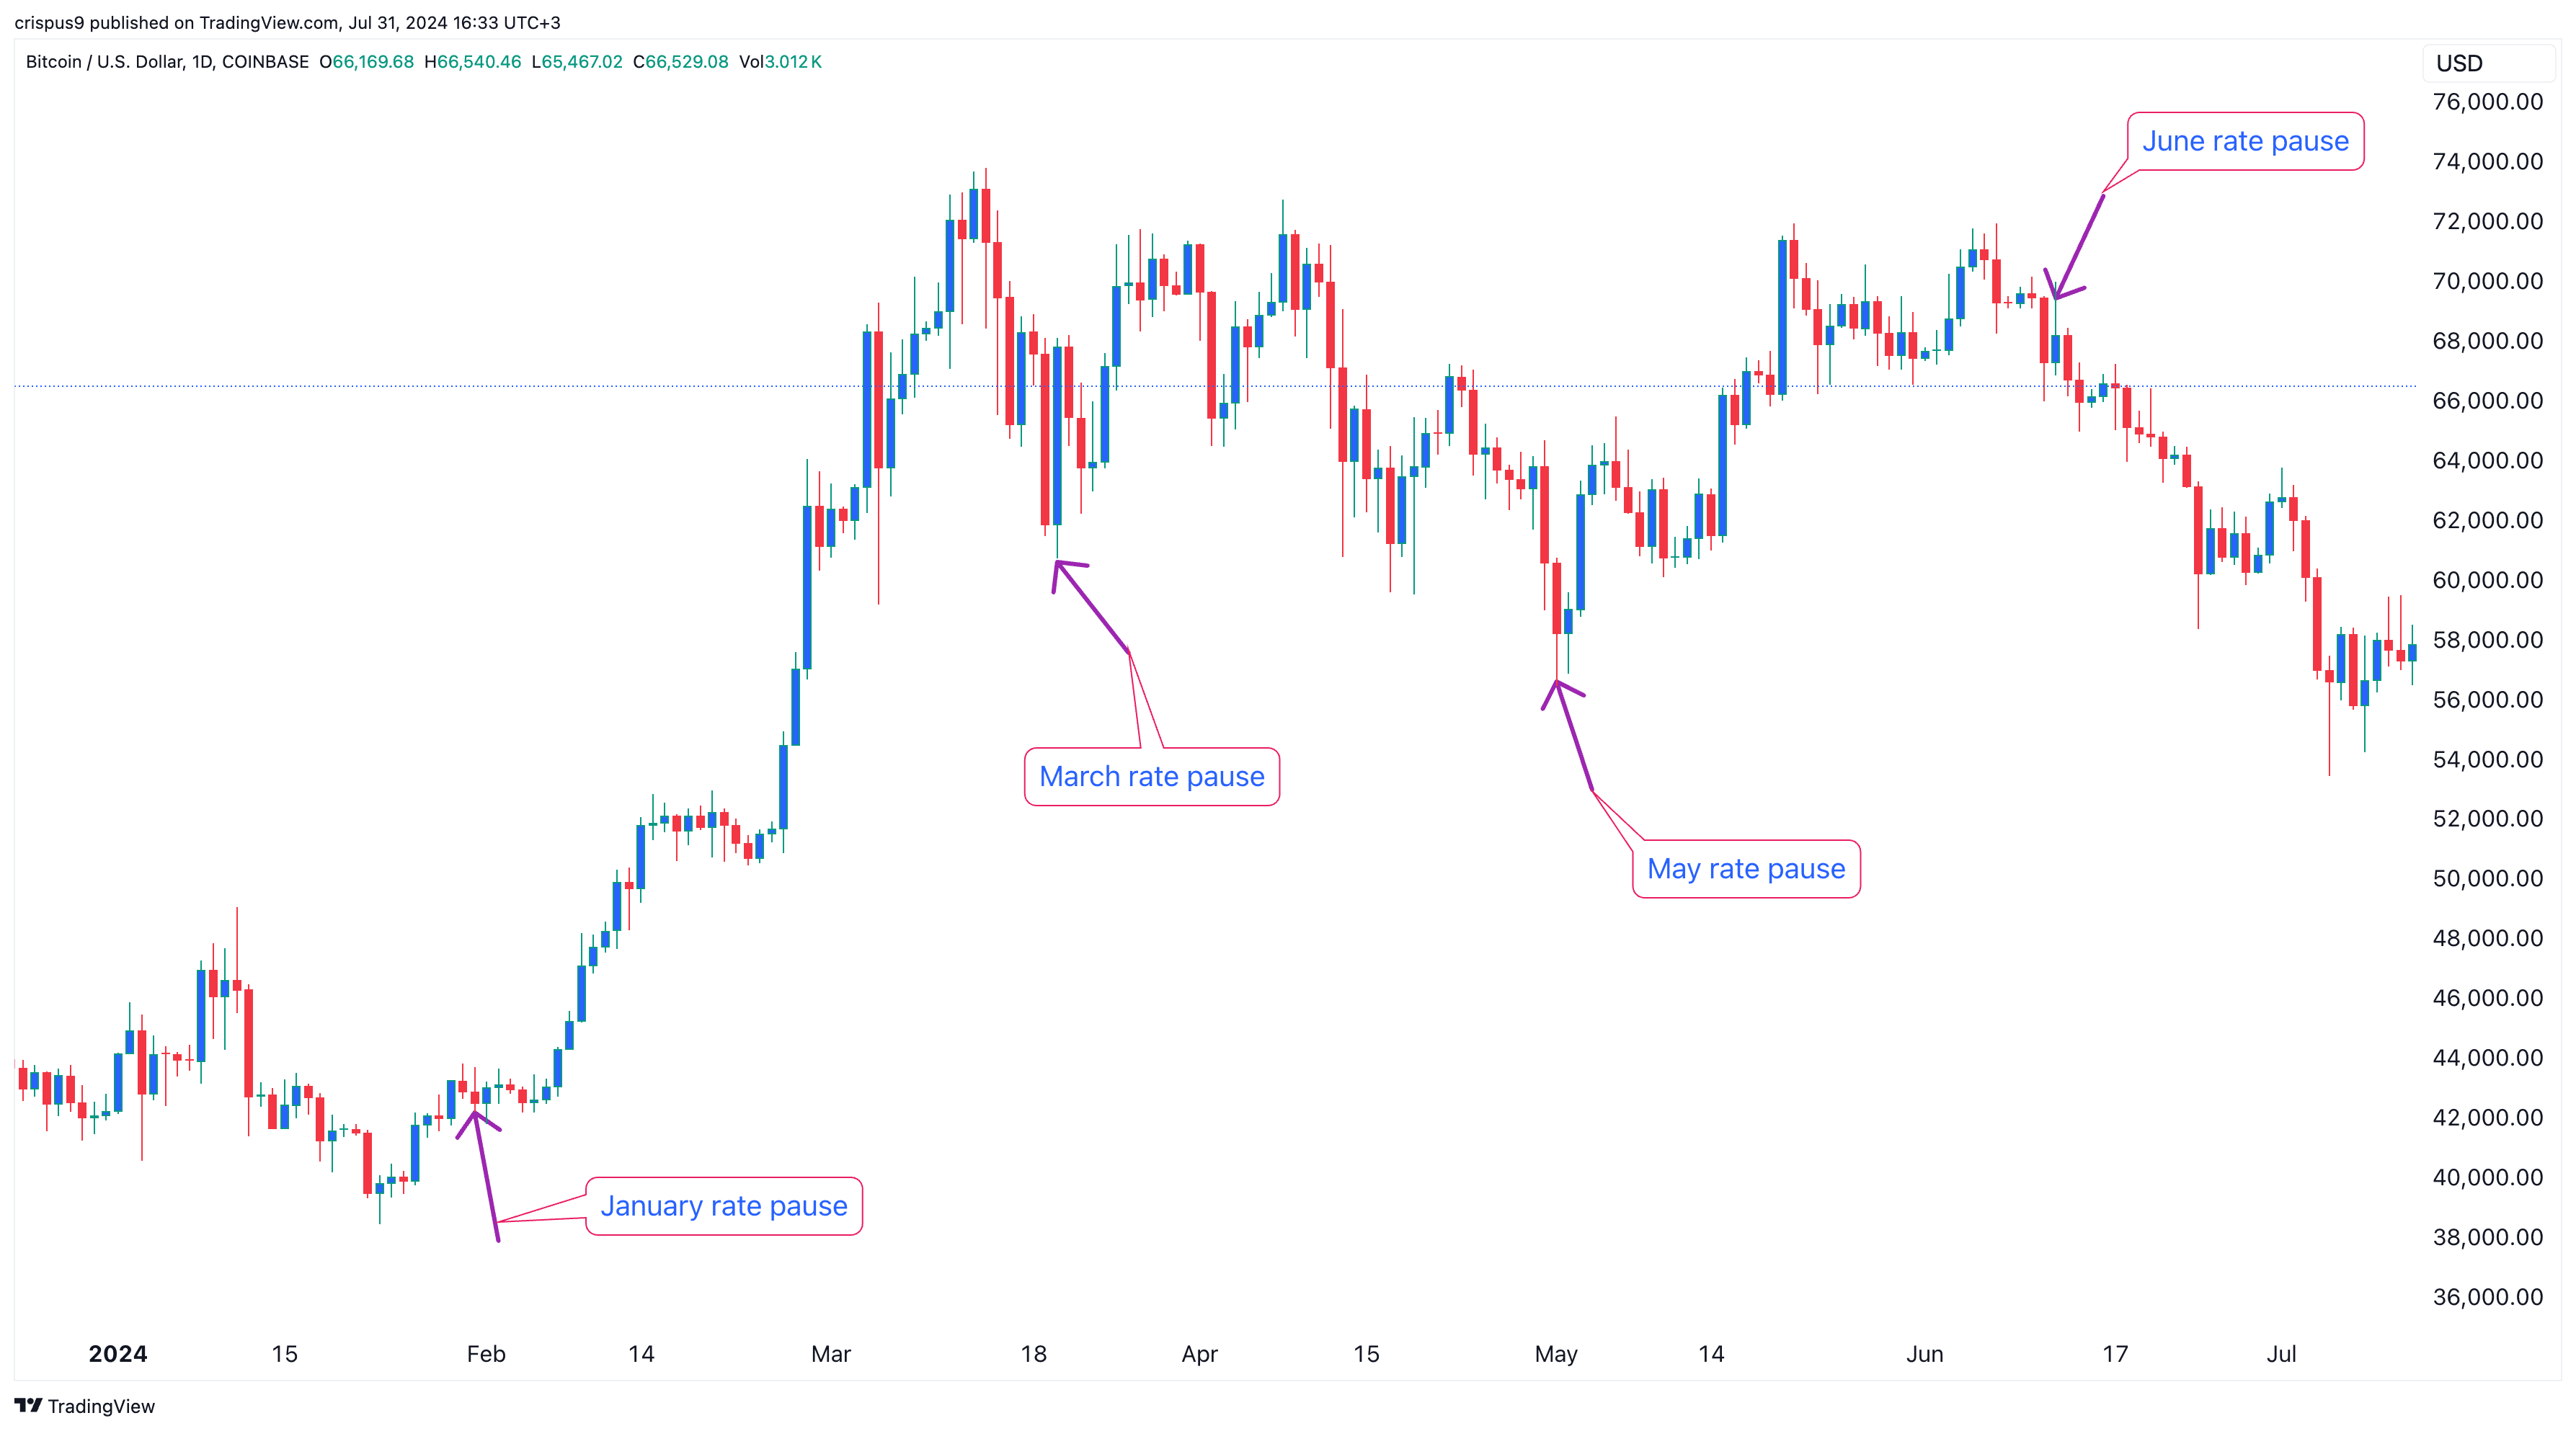
Still, for this meeting, the impact on cryptocurrencies may be limited since the rate pause has been priced in. As shown in previous Fed decisions, there has been no major impact on Bitcoin prices.
Source link
You may like

Bitcoin Cash eyes 18% rally


Rare Shiba Inu Price Patterns Hint SHIB Could Double Soon

The Bitcoin Pi Cycle Top Indicator: How to Accurately Time Market Cycle Peaks


Bitcoin Approaches $100K; Retail Investors Stay Steady


Solana Hits New ATH On Huge Whale Accumulation, More Gains Ahead?


Microsoft Should Buy $78 Billion Worth of Bitcoin
Bitcoin Cash (BCH) added nearly 35% to its value in the past month and rallied 12% on Nov. 21. Bitcoin’s (BTC) observed a rally to $98,384 early on Nov. 21, with BCH and other top cryptocurrencies tagging along for the ride.
An analysis of on-chain and technical indicators and data from the derivatives market shows that BCH could extend gains and retest its mid-April 2024 peak of $569.10.
Bitcoin hits all-time high, fork from 2017 ignites hope for traders
Bitcoin hit a record high of $98,384 on Nov. 21, a key milestone as the cryptocurrency eyes a run to the $100,000 target. BTC was forked in 2017, creating a spin-off or alternative, Bitcoin Cash.
BCH hit a peak of $1,650 in May 2021. Since April 2024, BCH has been consolidating with no clear trend formation.
BCH price rallied nearly 30% since Nov. 15, on-chain indicators show that further rally is likely in the Bitcoin spin-off token.
Bitcoin Cash’s active addresses have climbed consistently since August 2024. Santiment data shows an uptrend in active addresses, meaning BCH traders have sustained demand for the token, supporting a bullish thesis for the cryptocurrency.
The ratio of daily on-chain transaction volume in profit to loss exceeds 2, is 2.141 on Thursday. BCH traded on-chain noted twice as many profitable transactions on the day, as the ones where losses were incurred. This is another key metric that paints a bullish picture for the token forked from Bitcoin.
Binance funding rate is positive since Nov. 10. In the past eleven days, traders have been optimistic about gains in BCH price, according to Santiment data.

The network realized profit/loss metric identifies the net gain or loss of all traders who traded the token within a 24 hour period. NPL metric for Bitcoin Cash shows traders have been taking profits on their holdings, small positive spikes on the daily price chart represent NPL.
Investors need to keep their eyes peeled for significant movements in NPL, large positive spikes imply heavy profit-taking activities that could increase selling pressure across exchange platforms.
84.48% of Bitcoin Cash’s supply is currently profitable, as of Nov. 21. This metric helps traders consider the likelihood of high profit-taking or exits from existing BCH holders, to time an entry/ exit in spot market trades.

Derivatives traders are bullish on BCH
Derivatives market data from Coinglass shows a 33% increase in open interest in Bitcoin Cash. Open interest represents the total number of active contracts that haven’t been settled, representing demand for the BCH token among derivatives traders.
Derivatives trade volume climbed 613% in the same timeframe, to $2.35 billion. Across exchanges, Binance and OKX, the long/short ratio is above 1, closer to 2, meaning traders remain bullish on BCH and expect prices to rally.

BCH futures open interest chart shows a steady increase in the metric, alongside BCH price gain since November 5, 2024. Open interest climbed from $190.74 million to $254.87 million between November 5 and 21.

Technical indicators show BCH could gain 18%
The BCH/USDT daily price chart on Tradingview.com shows that the token remains within the consolidation. The token is stuck within a range from $272.70 to $568.20. BCH could attempt to break past the upper boundary of the range, a daily candlestick close above $568.20 could confirm the bullish breakout.
The April 2024 high of $719.50 is the next major resistance for BCH and the second key level is at $805.80, a key level from May 2021.
The relative strength index reads 64, well below the “overvalued” zone above 70. RSI supports a bullish thesis for BCH. Another key momentum indicator, moving average convergence divergence flashes green histogram bars above the neutral line. This means BCH price trend has an underlying positive momentum.
The awesome oscillator is in agreement with the findings of RSI and MACD, all three technical indicators point at likelihood of gains.

A failure to close above the upper boundary of the range could invalidate the bullish thesis. BCH could find support at the midpoint of the range at $419.90 and the 50-day exponential moving average at $388.50.
Disclosure: This article does not represent investment advice. The content and materials featured on this page are for educational purposes only.
Source link
Altcoin
Trader Says Telegram Gaming Token Primed To Rally by Nearly 100%, Updates Outlook on Ethereum and Dogecoin
Published
2 weeks agoon
November 8, 2024By
admin
A popular crypto strategist is suddenly flipping bullish on an altcoin connected to a viral game on the encrypted messaging platform Telegram.
Analyst Ali Martinez tells his 77,300 followers on the social media platform X that Notcoin (NOT) could soar 100% from its current value.
“Notcoin is showing a promising risk-to-reward setup. With a falling wedge pattern forming, it could be primed for a bullish breakout toward $0.012!”
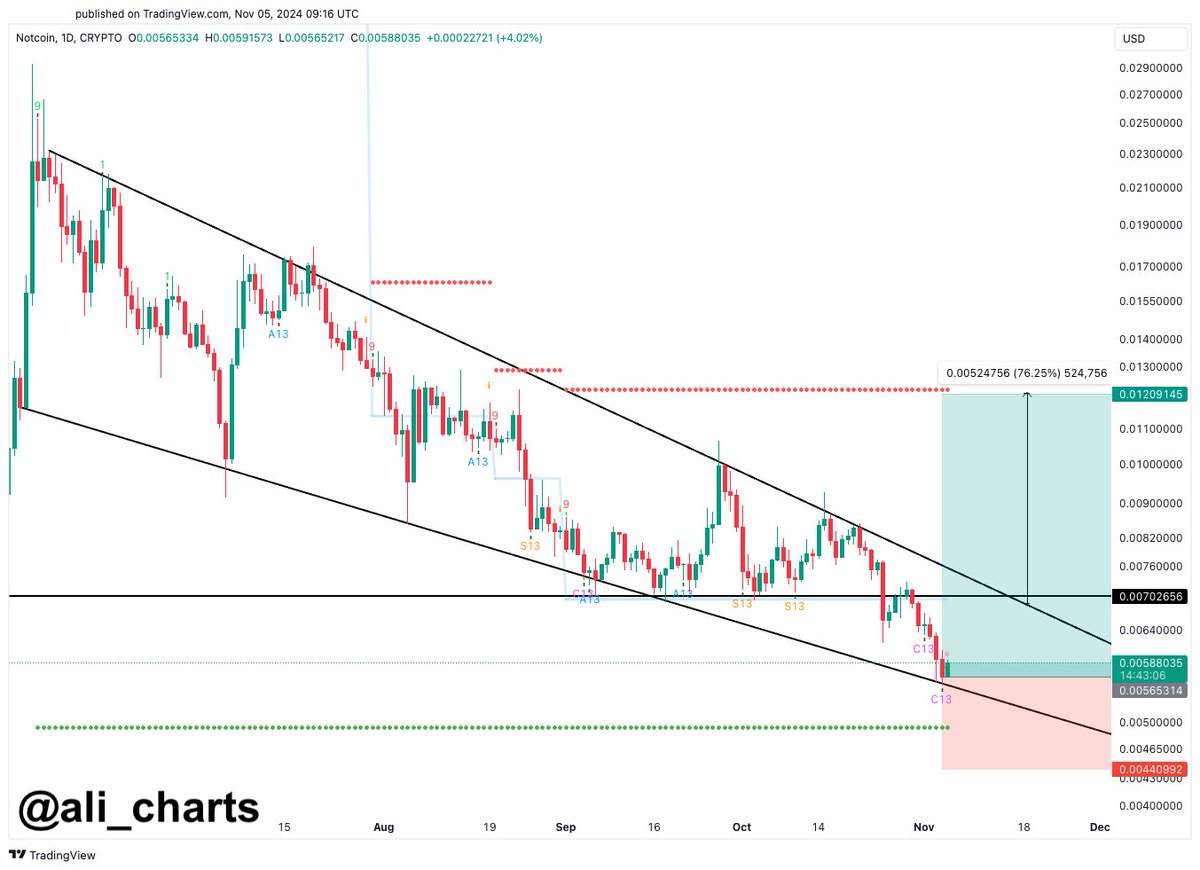
A falling wedge breakout is a technical analysis pattern that is used to identify bullish reversals in an asset’s price. The pattern is characterized by a series of lower highs and lower lows that form a wedge-shaped pattern on the chart.
As the pattern progresses, the distance between the highs and lows decreases, which indicates that the selling pressure is weakening. When price breaks out of the upper trend line of the wedge, it’s traditionally considered bullish.
NOT is trading for $0.006 at time of writing, up 7.9% in the last 24 hours.
The analyst is also bullish on Ethereum (ETH), suggesting it could soon hit $6,000.
“The risk-to-reward ratio on Ethereum is too good to pass up for a long position! I’ve set my stop below $1,880 and am aiming for a target of $6,000.”
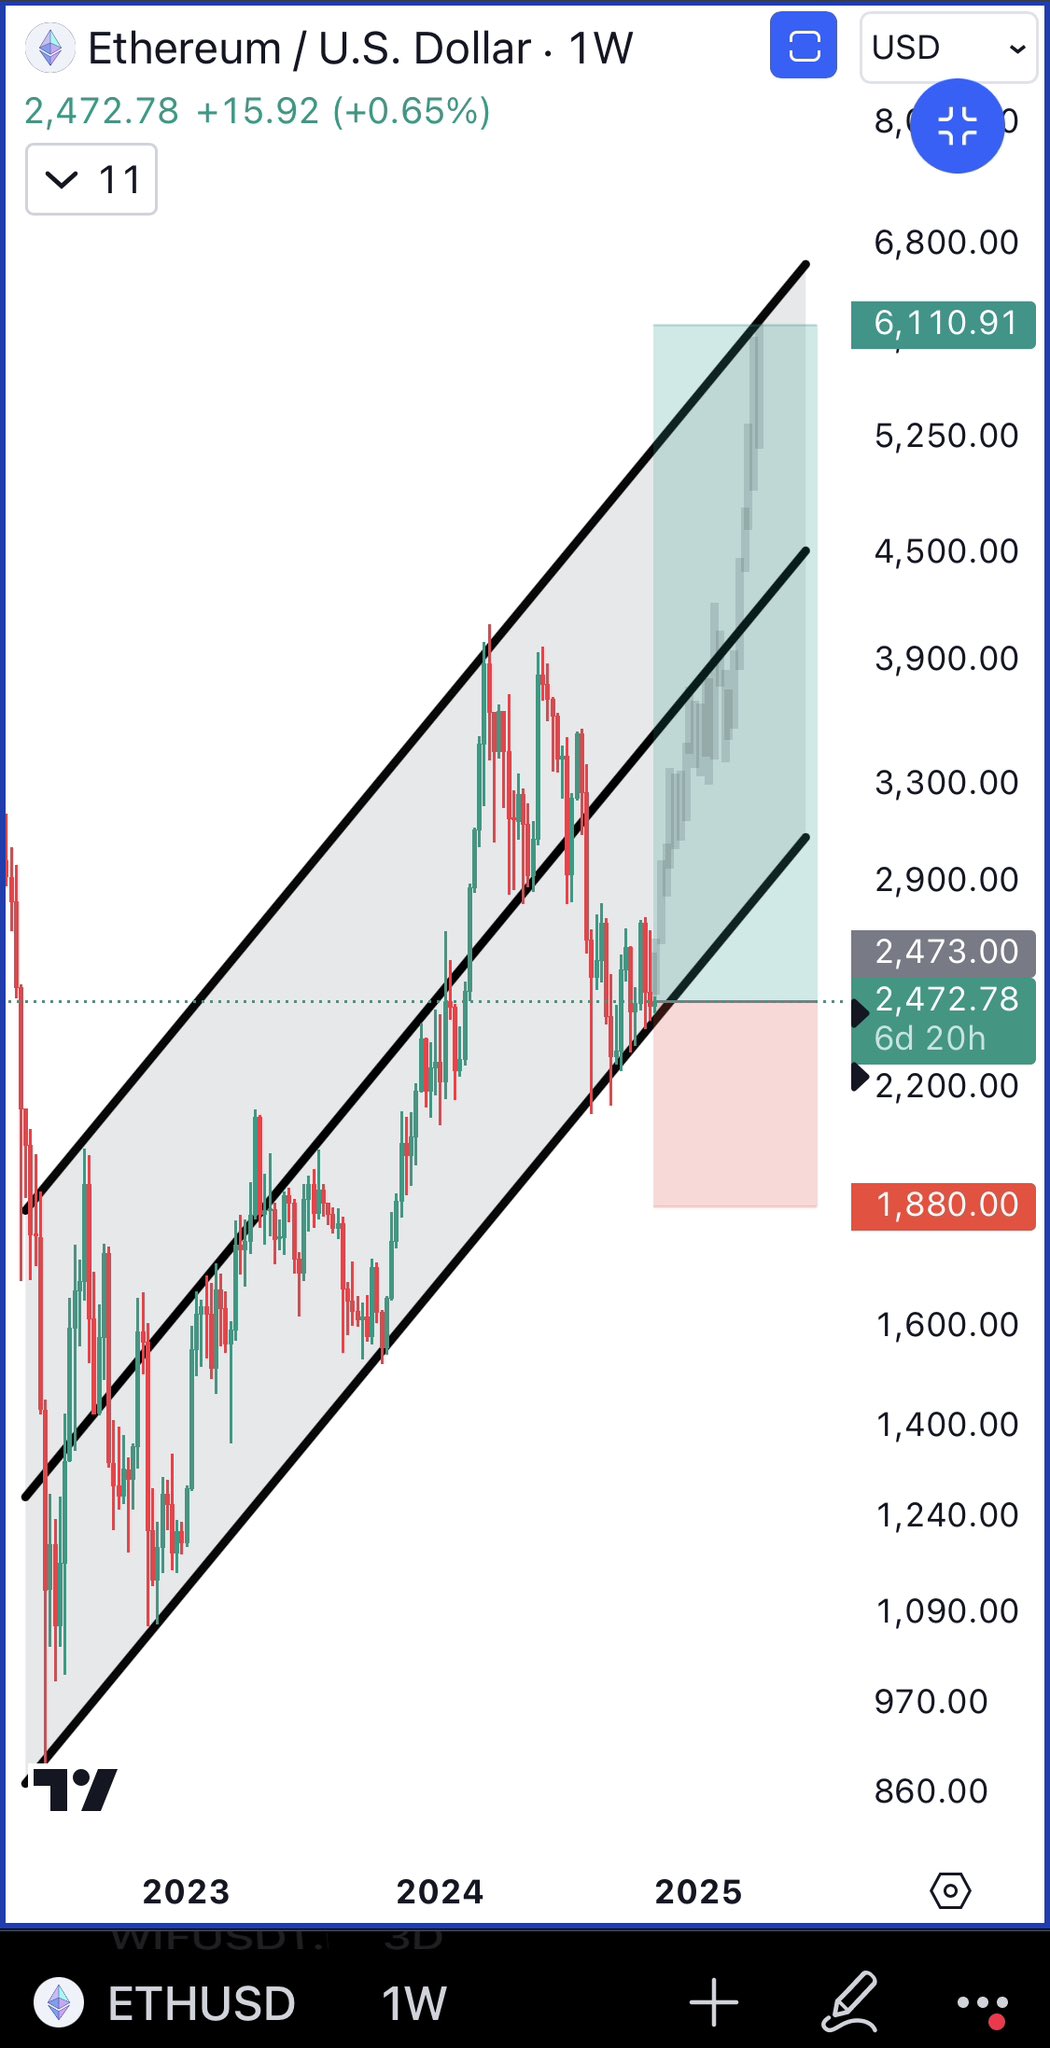
Looking at his chart, the analyst suggests ETH is holding the bottom trend line of the ascending channel as support and could soon re-test the upper bound at around $6,100.
Next up, the analyst suggests that Dogecoin (DOGE) may see an explosive rally, in part, due to billionaire Elon Musk. Musk, one of the memecoin’s most famous supporters, is now close to US President-elect Donald Trump, after playing a role in his election.
The analyst also believes DOGE may repeat a historic pattern based on Fibonacci extensions, which traders use in technical analysis to estimate profit targets and price pullbacks. They are based on Fibonacci ratios.
“With Elon Musk now influencing the 47th President, Donald Trump, Dogecoin could be primed for a wild ride! In past bull cycles, once DOGE broke the 0.50 Fibonacci retracement, it often rallied to the 1.618 or even 2.272 Fib levels. If history repeats, we could see DOGE hit somewhere between $4 and $23!
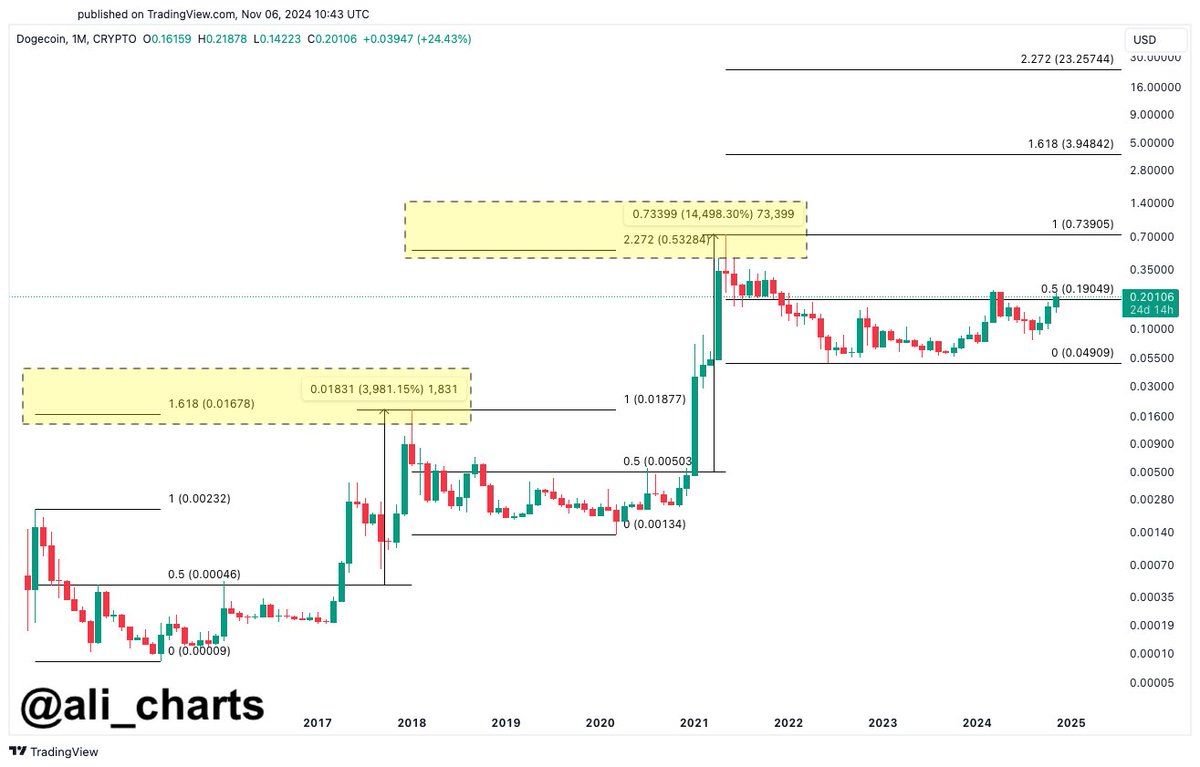
Dogecoin is trading for $0.1969 at time of writing, up 15% in the last 24 hours.
Don’t Miss a Beat – Subscribe to get email alerts delivered directly to your inbox
Check Price Action
Follow us on X, Facebook and Telegram
Surf The Daily Hodl Mix
 

Disclaimer: Opinions expressed at The Daily Hodl are not investment advice. Investors should do their due diligence before making any high-risk investments in Bitcoin, cryptocurrency or digital assets. Please be advised that your transfers and trades are at your own risk, and any losses you may incur are your responsibility. The Daily Hodl does not recommend the buying or selling of any cryptocurrencies or digital assets, nor is The Daily Hodl an investment advisor. Please note that The Daily Hodl participates in affiliate marketing.
Generated Image: Midjourney
Source link
24/7 Cryptocurrency News
PONKE Price Skyrockets 19% On Binance Support, What’s Next?
Published
3 weeks agoon
November 4, 2024By
admin
The Solana meme coin Ponke (PONKE) saw its price soar by 19% following Binance’s announcement of a USDⓈ-Margined PONKEUSDT Perpetual Contract. Set to launch on November 4, 2024, this contract offers users up to 75x leverage, signaling increased opportunities for traders and heightened optimism among PONKE supporters.
PONKE Price Rockets Amid Major Binance Support
According to Binance’s official announcement, the PONKEUSDT perpetual contract will go live on November 4 at 12:30 UTC, providing traders with 75x leverage and 24/7 trading. Key features include a tick size of 0.00001 and a capped funding rate of ±2.00%, with funding fees settled every four hours. Binance’s Multi-Assets Mode further allows users to utilize BTC as collateral, offering flexibility in margin trading. However, the exchange may adjust contract specifications, such as funding fees, leverage, and tick size, based on evolving market conditions, ensuring the asset aligns with market risk levels.
#Binance Futures will launch the USDⓈ-Margined $PONKE Perpetual Contract at
🗓️ Nov 4 2024, 12:30 (UTC)
Read more ➡️ https://t.co/kqrmZqnEp6 pic.twitter.com/LQPUlMOBOR
— Binance Futures (@BinanceFutures) November 4, 2024
PONKE, built on Solana, benefits from the blockchain’s high-speed and low-cost transactions, catering to online traders and gaming enthusiasts. The coin’s community-driven design, distinct tokenomics, and accessibility through major exchanges contribute to its market appeal. Its #ponkyarmy community is particularly active, with governance roles and a dedicated social media presence that drive further engagement and growth.
Will The Rally Sustain?
Following the Binance listing news, PONKE’s price surged by 19%, currently trading at $0.49, with a 24-hour low of $0.43 and a high of $0.56. Its trading volume climbed to $77 million in the last 24 hours, indicating heightened interest. PONKE, with a market cap of $274 million, continues to capture the attention of meme coin enthusiasts. Besides, recent Coinglass data also highlights increased open interest for PONKE, signaling optimism for further gains.


Launched in late 2023 with a total supply of 555 million tokens, PONKE has already achieved an all-time high of $0.70 four months ago. Its deflationary burn mechanism and community-driven features have positioned PONKE uniquely within the Solana ecosystem, drawing both meme coin fans and investors seeking growth in Solana-based assets.
Coingape Staff
CoinGape comprises an experienced team of native content writers and editors working round the clock to cover news globally and present news as a fact rather than an opinion. CoinGape writers and reporters contributed to this article.
Disclaimer: The presented content may include the personal opinion of the author and is subject to market condition. Do your market research before investing in cryptocurrencies. The author or the publication does not hold any responsibility for your personal financial loss.
Source link

Bitcoin Cash eyes 18% rally

Rare Shiba Inu Price Patterns Hint SHIB Could Double Soon

The Bitcoin Pi Cycle Top Indicator: How to Accurately Time Market Cycle Peaks
Bitcoin Breakout At $93,257 Barrier Fuels Bullish Optimism

Bitcoin Approaches $100K; Retail Investors Stay Steady

Solana Hits New ATH On Huge Whale Accumulation, More Gains Ahead?

Microsoft Should Buy $78 Billion Worth of Bitcoin

Ethereum Believers May Be Staring Down Opportunity As ETH Reaches Another Low Against Bitcoin: CryptoQuant CEO

UK government is ready for crypto regulations next year

“Crypto Dad” Chris Giancarlo Emerges Top For White House Crypto Czar Role

Bitcoin Nears $100,000 As Trump Council Expected To Implement BTC Reserve

Know Your Missiles: Russia’s Experimental Hypersonic Missile Is A New Kind of Killing Machine

Polkadot investor predicts a 30,000% rally for this $0.04 token by 2025

Donald Trump Proposed Crypto Advisory Council To Set Up Strategic Bitcoin Reserve

Want Greater Bitcoin Adoption? Engage With Your Government.
182267361726451435

Top Crypto News Headlines of The Week

Why Did Trump Change His Mind on Bitcoin?

New U.S. president must bring clarity to crypto regulation, analyst says

Ethereum, Solana touch key levels as Bitcoin spikes

Bitcoin Open-Source Development Takes The Stage In Nashville

Will XRP Price Defend $0.5 Support If SEC Decides to Appeal?

Bitcoin 20% Surge In 3 Weeks Teases Record-Breaking Potential

Ethereum Crash A Buying Opportunity? This Whale Thinks So

Shiba Inu Price Slips 4% as 3500% Burn Rate Surge Fails to Halt Correction

‘Hamster Kombat’ Airdrop Delayed as Pre-Market Trading for Telegram Game Expands

Washington financial watchdog warns of scam involving fake crypto ‘professors’

Citigroup Executive Steps Down To Explore Crypto
Mostbet Güvenilir Mi – Casino Bonus 2024

Bitcoin flashes indicator that often precedes higher prices: CryptoQuant
Trending

 2 months ago
182267361726451435

 24/7 Cryptocurrency News3 months ago
Top Crypto News Headlines of The Week

 Donald Trump4 months ago
Why Did Trump Change His Mind on Bitcoin?

 News3 months ago
New U.S. president must bring clarity to crypto regulation, analyst says

 Bitcoin4 months ago
Ethereum, Solana touch key levels as Bitcoin spikes

 Opinion4 months ago
Bitcoin Open-Source Development Takes The Stage In Nashville

 Price analysis3 months ago
Will XRP Price Defend $0.5 Support If SEC Decides to Appeal?

 Bitcoin4 months ago
Bitcoin 20% Surge In 3 Weeks Teases Record-Breaking Potential


✓ Share: