
Price analysis
Toncoin Price Breaks Down Below Major Support; Another Sell-Off Ahead?

Toncoin price fell by 2% to $5.8 as the cryptocurrency market experienced a fresh wave of selling over the weekend. Leading cryptocurrencies, Bitcoin and Ethereum, slipped below $60,000 and $2,700, respectively, driven by escalating geopolitical tensions in the Middle East. Amid this ongoing correction, TON’s sustained position below the breakdown point of a bearish pattern indicates a potential decline ahead.
Also Read: Will Bitcoin Price Bottom at $50k Amid Growing Speculation of Fed Rate Cut?
Toncoin Price Poised For Prolong Downfall
The Toncoin price shows the formation of a well-known reversal pattern called head and shoulder in the daily chart. This setup consists of three peaks, with the middle peak (the head) being the highest and the two outside peaks (shoulders) being close in height and lower than the head.
Amid the pattern formation and market correction, the altcoin price plunged from $8.17 to $6.107, registering a loss of 26%, while the market cap fell to $14.9 Billion. The declining price gave a decisive breakdown from the neckline support at $6.5, accelerating the market selling pressure.
The Average Directional Index (ADX) slope spike to 30% indicates the strength in current correction and sellers dominance over this asset.
The derivative market data for Toncoin reveals an Open Interest (OI)-Weighted Funding Rate at -0.31. This negative rate indicates that short sellers are currently paying to maintain their positions, suggesting a strong bearish sentiment and expectations of further price declines.

The potential downside target for the head and shoulders pattern is typically calculated by measuring the vertical distance from the top of the head to the neckline and extending it downward from the breakdown point. With this projection, Toncoin’s price is expected to decline by an additional 24% to potentially find support at the May 2024 projected low of $4.6.
Also Read: Riot Exec Reveals How Bitcoin Strategic Reserve Can Aid US Economy

Moreover, the Total Value Locked (TVL) in the Toncoin network has suddenly dropped from $760 to $676, registering a loss of 11%. This decline in TVL indicates a substantial reduction in liquidity and possibly diminishing investor confidence, which could exacerbate the bearish outlook.

On the contrary note, the falling Toncoin price could witness a renewed demand pressure at $5.56, coinciding with the 200-day Exponential Moving Average (EMA) slope. The potential rebound weakened the bearish and bolstered Toncoin price to surpass $7 after a 16% jump.
Frequently Asked Questions (FAQs)
The Open Interest (OI)-Weighted Funding Rate in derivatives trading measures the cost paid by traders to keep leveraged positions open overnight. A negative rate, such as -0.31, typically indicates that short positions are predominant.
Total Value Locked (TVL) is a metric used in the cryptocurrency market to measure the total value of crypto assets deposited in a decentralized finance (DeFi) protocol. It is often used as an indicator of the health and growth of a DeFi network.
The Average Directional Index (ADX) is a technical analysis indicator used to quantify the strength of a trend.
Related Articles
Sahil Mahadik
Sahil is a dedicated full-time trader with over three years of experience in the financial markets. Armed with a strong grasp of technical analysis, he keeps a vigilant eye on the daily price movements of top assets and indices. Drawn by his fascination with financial instruments, Sahil enthusiastically embraced the emerging realm of cryptocurrency, where he continues to explore opportunities driven by his passion for trading
Disclaimer: The presented content may include the personal opinion of the author and is subject to market condition. Do your market research before investing in cryptocurrencies. The author or the publication does not hold any responsibility for your personal financial loss.
Source link


With Donald Trump’s victory in the U.S. elections, the cryptocurrency market has entered a strong growth phase, reigniting excitement across the space. A long-awaited milestone has been achieved with Bitcoin — its price has soared past the $106,000 mark.
The crypto bull market is in full swing, leaving everyone wondering: what’s next? Which coin will explode in 2025? And which crypto has 1000x potential? Here’s a guide to the crypto coins to watch as we head into next year.
The criteria for a crypto explosion
With more than 10,000 cryptocurrencies out there today, only a small portion ever achieve real success. Why? The key lies in their utility, scalability, and adoption.
Cryptos that succeed often focus on offering something useful, whether that’s speeding up transactions, cutting down on fees, or boosting privacy. For instance, projects that support decentralized finance or enable smart contracts often gain traction due to their innovative applications.
A crypto’s success depends heavily on scalability — blockchains that can process lots of transactions without slowing down or hiking up costs stand out. This reliability makes them more attractive as demand for seamless digital transactions grows.
Strong community support, solid partnerships, and strategic market positioning drive adoption, bolstered by a transparent and experienced development team.
Cryptos that are decentralized attract users looking for security, privacy, and control, as no single entity has all the power. This openness builds trust and transparency. Centralized cryptos, on the other hand, often spark concerns about control and transparency since one entity holds the reins. Many users prefer decentralization for its autonomy and lower risk of manipulation.
Without these foundational elements, many cryptocurrencies simply fail to stand out in the increasingly crowded market.
Top cryptocurrencies likely to explode in 2025
Which cryptocurrency will explode in 2025? As the market evolves, certain coins show immense potential for rapid growth. Here are some crypto coins to watch.
Ethereum
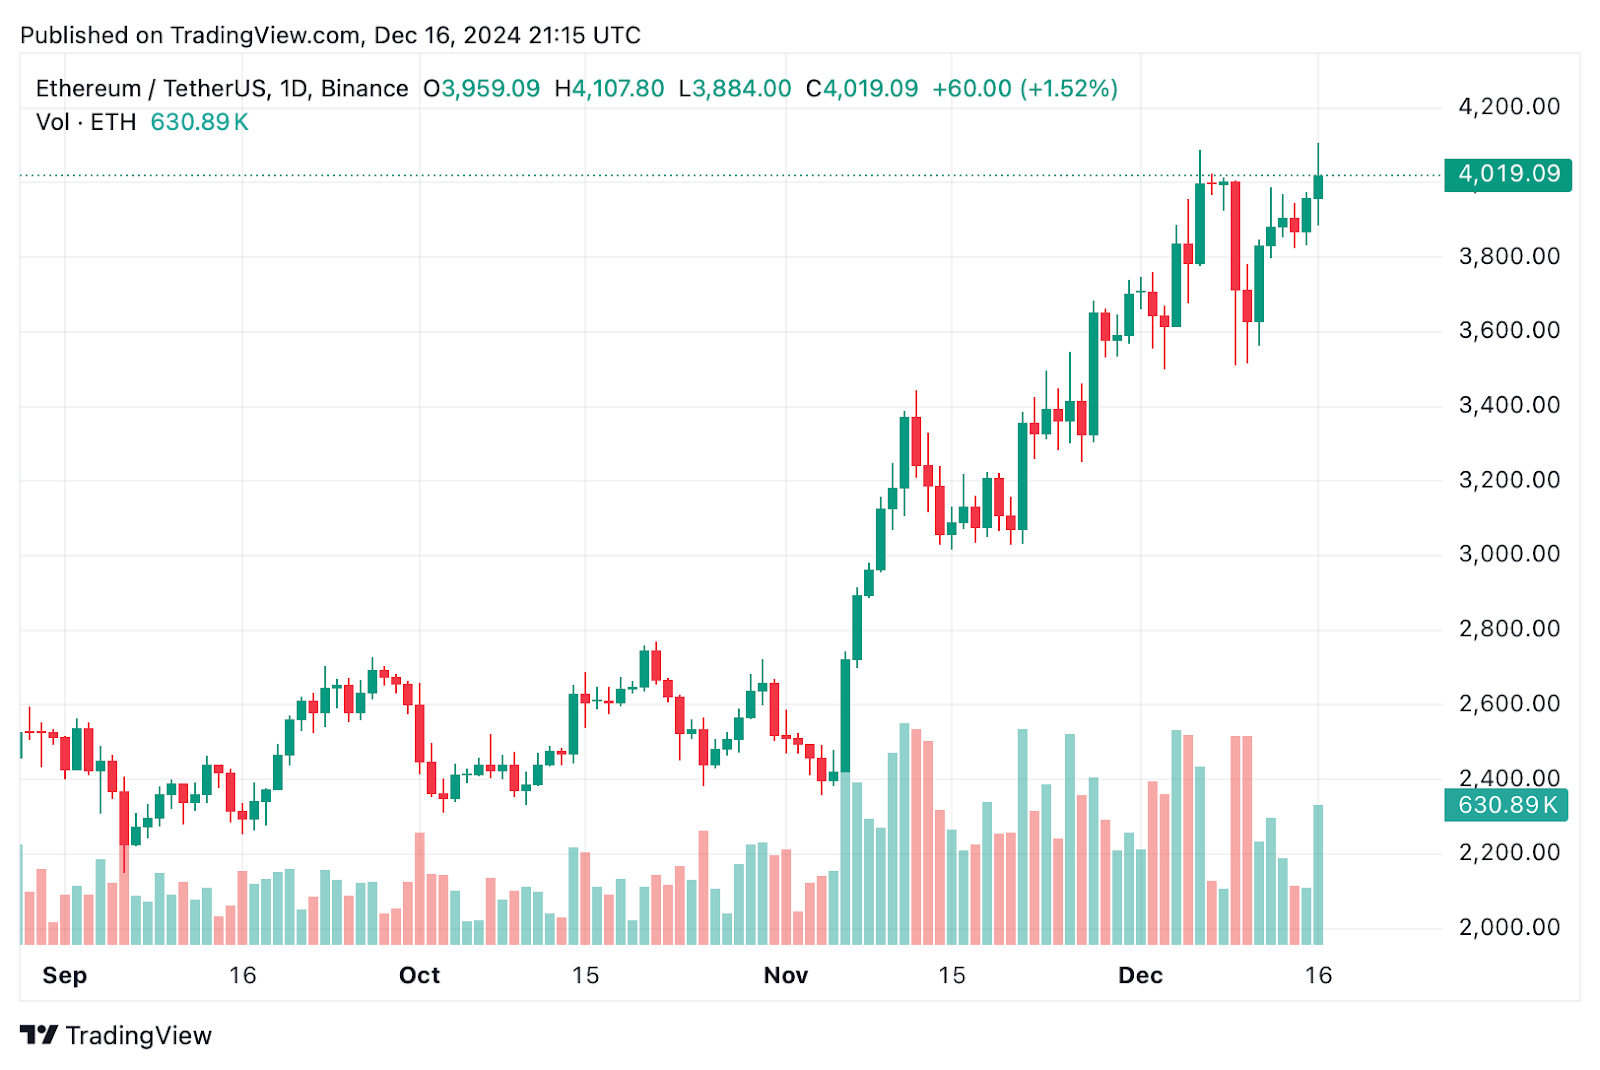
Ethereum 1-day chart, December 2024 | Source: crypto.news
Ethereum’s dominance in the blockchain space is clear, with its key role in powering decentralized applications and smart contracts. With the rise of DeFi and NFTs, Ethereum (ETH) is well-positioned to retain its dominant position.
After transitioning to Ethereum 2.0 in 2022, the network’s scalability and energy efficiency have improved, allowing it to handle more transactions without compromising security.
Looking ahead, the Pectra upgrade planned for 2025 will enhance Ethereum’s scalability even further, enabling it to process more transactions and introducing innovative features like social recovery for wallet access. This is expected to make Ethereum even more robust, positioning it for future growth in a rapidly evolving blockchain landscape.
Solana
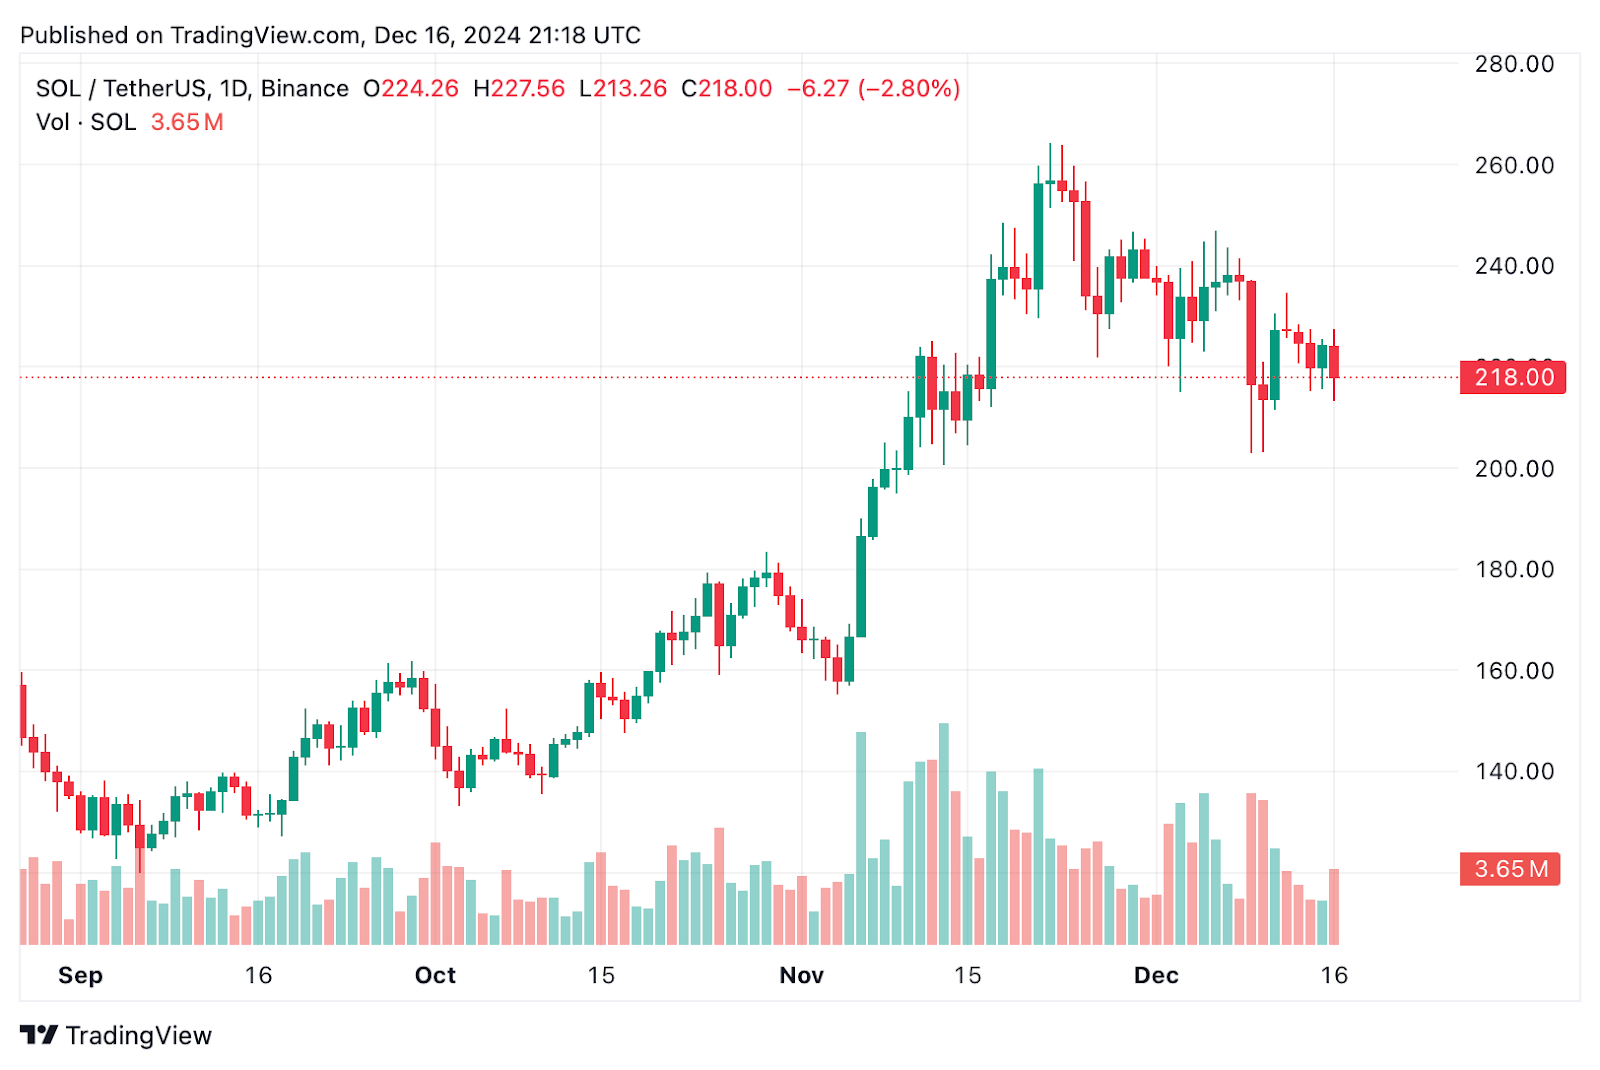
Solana 1-day chart, December 2024 | Source: crypto.news
Solana (SOL) continues to make waves in the blockchain space, standing out for its impressive transaction speed and low fees, which are attracting developers across various industries. The network’s growing presence in decentralized finance and gaming underscores its potential to emerge as a leading force.
While it has faced some network issues in the past, Solana’s ongoing upgrades in scalability and developer tools are enhancing its ecosystem. With its unique ability to process transactions quickly and an expanding user base, Solana is well-positioned for continued success in 2025.
Chainlink
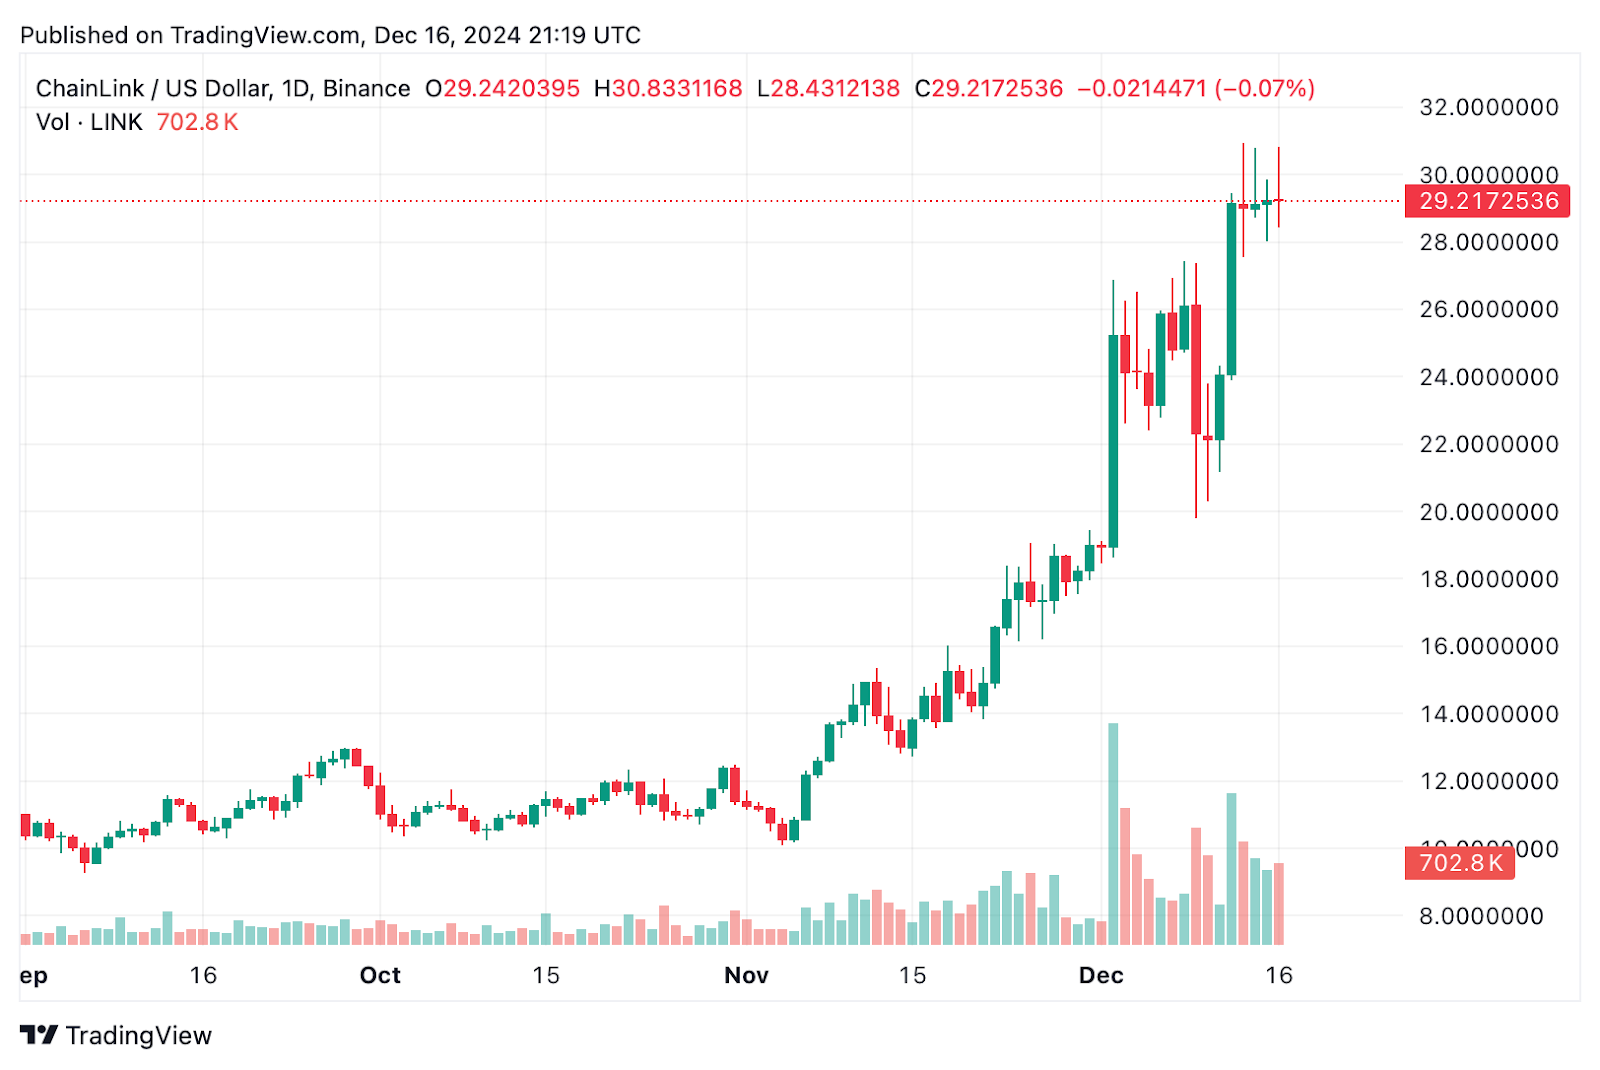
Chainlink 1-day chart, December 2024 | Source: crypto.news
Chainlink (LINK) is a decentralized oracle network that plays a crucial role in connecting blockchains with real-world data. Its ability to securely transmit external information to smart contracts makes it invaluable to the blockchain ecosystem.
With expanding partnerships and increasing use in DeFi and smart contracts, Chainlink is on a strong growth trajectory. As the demand for blockchain-based data services continues to rise, Chainlink is well-positioned to see significant upside potential. Chainlink’s growing adoption, including partnerships with major companies like Google Cloud, SWIFT, and the World Economic Forum, showcases its increasing importance.
As demand for decentralized data services grows, Chainlink’s unique position in blockchain infrastructure positions it for significant growth, especially as blockchain technology expands into more industries.
Expert predictions for 2025
As 2025 approaches, experts present a range of predictions for Ethereum, highlighting its critical role in the evolving cryptocurrency space. Some foresee ETH breaking new records, possibly surpassing $5,000, fueled by growing demand and its limited supply dynamics. Other projections are more optimistic, envisioning ETH prices potentially crossing $10,000, fueled by institutional interest and strong market fundamentals.
Predictions for Chainlink’s performance in 2025 vary, reflecting the unpredictable nature of the crypto market. Analysts suggest that LINK could climb to a range of $30.69 to $38.26 by year-end, driven by growing adoption and ongoing technological advancements. Others, like Nick Petisce, suggest a more optimistic outlook, proposing that LINK could soar to $2,000-$6,000 within the next 3-5 years, driven by the adoption of Chainlink’s Cross-Chain Interoperability Protocol (CCIP) and partnerships with major financial institutions.
Similarly, Solana has garnered attention for its high transaction speeds and low fees, attracting developers across various industries. While specific 2025 price predictions for SOL are less prevalent, the network’s growing presence in decentralized finance and gaming underscores its potential to emerge as a leading force in the blockchain space.
Ongoing upgrades in scalability and developer tools are enhancing its ecosystem, positioning Solana for continued success in the coming years.
Risks and considerations
Investing in cryptocurrency can be rewarding, but it comes with considerable risks. Even strong projects like Ethereum, Solana, and Chainlink are not exempt from market turbulence or external disruptions like regulatory crackdowns. Price volatility can lead to significant losses if you’re not prepared. Predictions from experts offer guidance but don’t guarantee outcomes.
Additionally, the crypto space often attracts fraudulent schemes, making due diligence crucial. Take time to analyze each coin’s fundamentals, consider its long-term potential, and never invest money you can’t afford to lose. Spread your investments across multiple assets, avoid high-risk trades, and ensure that your financial health isn’t jeopardized. Responsible investing starts with informed decisions.
Source link
After crashing nearly 15% Bitcoin has spent nearly a week below $100K and BTC currently trades at $94,124. Despite the brutal crash and sideways movement when will Bitcoin price hit $100,000? This article explores three key on-chain metrics that suggest that BTC is preparing for a strong bounce.
In the previous article, CoinGape explore three reasons why Bitcoin price crash will end soon. This article explores why BTC should bounce soon and revisit the historic $100K level.
3 Key Metrics That Could Propel Bitcoin Price to $100K
According to Santiment, on-chain data provider, the Network Realized Profit/Loss (NPL) indicator saw a spike to roughly 106K & 100K on December 19 and 20, respectively. This profit-taking suggests that investors panic sold. Hence, the chances of a further drop due to spike in selling pressure.

Further supporting this thesis is the 30-day MVRV (market value to realized value) ratio has dipped below zero and sits at -4.77%. Between 5% to 10% is where BTC formed a bottom in the past two months. The fact that BTC’s 30-day MVRV is sitting in the opportunity zone suggests that a reversal is likely in the next few days.

Lastly the supply distribution metrics show that whales accumulated 30,000 BTC since the ATH. These wallets that hold 100 to 1,000 BTC have shown resilience despite the short-term correction and hints that investors are bullish on the last few days of 2025.

All in all, the outlook for Bitcoin price looks bullish and a potential drop here is highly unlikely. Even if there is a drop, it should stabilize around $90K. As mentioned in yesterday’s Bitcoin article, the drop is likely going to reverse soon and kickstart a consolidation or a reversal.
Furthermore, the quarter four is generally bullish according to historical price action, which adds credence to what technicals and on-chain metrics are showing. Therefore, the ongoing downtrend is unlikely to continue and a potential bounce could be coming up soon.
Frequently Asked Questions (FAQs)
The three metrics are: Network Realized Profit/Loss (NPL) indicator, 30-day MVRV ratio, and supply distribution metrics showing whale accumulation.
The 30-day MVRV ratio has dipped below zero, indicating that a reversal is likely in the next few days, as it has formed a bottom in the past two months between 5% to 10%.
Whales accumulating 30,000 BTC since the ATH indicates investor bullishness and resilience despite the short-term correction, suggesting a potential bounce.
Akash Girimath
Akash Girimath, an engineer by training, has developed a deep fascination with the complexities of cryptocurrency markets. As a senior reporter and analyst, he specializes in crypto analysis and contributes his expertise to notable platforms such as AMBCrypto and FXStreet. In addition to his analytical work, Akash actively trades cryptocurrencies and manages a small crypto fund for friends and family. His role involves providing insightful market analysis and keeping readers informed about the latest trends in the crypto world. Follow Him on Youtube , X and LInkedIn
Disclaimer: The presented content may include the personal opinion of the author and is subject to market condition. Do your market research before investing in cryptocurrencies. The author or the publication does not hold any responsibility for your personal financial loss.
Source link

Stellar price plunged in the last three weeks due to a risk-off sentiment brought forth by Fed’s interest decision for 2025. The XLM price has formed a falling wedge pattern and found support at the 50-day moving average, indicating an eventual comeback as investors buy the dip.
Stellar Price Technical Analysis: Falling Wedge Forms
The Stellar Lumens coin fell sharply and formed a few lower lows and lower highs as Bitcoin and most altcoins crashed. This decline has seen it form a falling wedge chart pattern, which is made up of two falling trendlines. The upper trendline connects the highest level on December 2 and 17, while the lower lines link the lower lows since November 26.
A falling wedge is a highly popular reversal sign. In most cases, this reversal happens when the two lines are nearing their confluence levels, which is about to happen.
Another bullish case is that the XLM price has found support at the 50% Fibonacci Retracement level. This retracement links the lowest and highest levels in 2024.
Further, the Stellar price seems to have completed its mean reversion, which explains why it crashed in the past few days. Mean reversion is when a cryptocurrency or a stock return to its average price. In this case, it has found substantial support at the 50-day moving average, where it has failed to drop below in the past two consecutive days.
XLM price has also found support near the lower side of Andrew’s pitchfork tool. Therefore, the coin will likely have a strong bullish breakout in the coming days. If this happens, it may rally and retest the psychological point at $0.50, which coincides with the 23.6% retracement level.

Stellar Lumens price’s bullish view will become invalid if the coin slips below last week’s low at $0.3125. Such a drop will see it drop to the psychological level at $0.30.
XLM Price Has Bullish Fundamentals
Stellar Price has some bullish fundamentals that could push its price higher in the next few weeks. The first big thing is that Stellar and Ripple are often seen as ‘cousins’ since they target the payment industry. Also, Stellar’s founder, Jed McCaleb, is one of Ripple’s founder.

Therefore, Ripple’s performance could benefit the XLM price as it has previously done. As we wrote earlier, analysts are optimistic that the XRP price will skyrocket by 60% if the SEC approves a spot XRP fund. Another analyst expects the Ripple price to surge to $4 as Binance transactions rise.
Further, Stellar’s network is doing relatively well as the DeFi total value locked stages a slow recovery. DeFi Llama data shows that the Stellar Network had a TVL of over 135 million XLM, higher than last week’s low of 112 XLM.
Therefore, a combination of strong fundamentals and technicals may help the Stellar price rebound in the near term.
Frequently Asked Questions (FAQs)
Stellar lumens has retreated because of the ongoing crypto sell-off. Bitcoin and other cryptocurrencies like Ether and Solana have all plunged hard.
The XLM token may rebound to at least $0.50 because the falling wedge chart pattern works out well. Besides, it has already completed the mean reversion pattern.
Stellar price has strong fundamentals, including its similarity with Ripple and its growing ecosystem in the DeFi industry.
crispus
Crispus is a seasoned Financial Analyst at CoinGape with over 12 years of experience. He focuses on Bitcoin and other altcoins, covering the intersection of news and analysis. His insights have been featured on renowned platforms such as BanklessTimes, CoinJournal, HypeIndex, SeekingAlpha, Forbes, InvestingCube, Investing.com, and MoneyTransfers.com.
Disclaimer: The presented content may include the personal opinion of the author and is subject to market condition. Do your market research before investing in cryptocurrencies. The author or the publication does not hold any responsibility for your personal financial loss.
Source link

Here’s a Potential Downside Price Target for Cardano If ADA Sees New Correction, According to Benjamin Cowen

Which crypto will explode in 2025? Expert insights and predictions

XRP Price Pumps 7% On Christmas Eve, Will It Reach Yearly Highs?

XRP firmly above $1, ADA and LCAI to steal the spotlight

The 69 Dumbest Moments of the Year: 2024 Crypto Edition

Here’s What To Expect After Pectra Upgrade

Top 5 meme coins for 12,000x gains

Cardano Price Eyes Rally To New Highs As Bull Flag Appears
Coinbase CEO, Other Crypto Insiders Billions Richer After Seeking to Steer Elections

Protect Your Non-Custodial Bitcoin Wallet — Support The Open Dialogue Foundation

BOUNCEBIT price jumps 16% after major partnership

Bullish Lists RLUSD Stablecoin, Here Are Trading Pairs

Wave 2 And 5 Targets Put XRP At $7 And $13

NEIRO’s success shadowed; Catzilla’s presale sparks new market buzz

3 Key Metrics That Hint Bitcoin Price Will Hit $100K Soon
182267361726451435
Why Did Trump Change His Mind on Bitcoin?

Top Crypto News Headlines of The Week

New U.S. president must bring clarity to crypto regulation, analyst says

Will XRP Price Defend $0.5 Support If SEC Decides to Appeal?

Bitcoin Open-Source Development Takes The Stage In Nashville

Ethereum, Solana touch key levels as Bitcoin spikes

Bitcoin 20% Surge In 3 Weeks Teases Record-Breaking Potential

Ethereum Crash A Buying Opportunity? This Whale Thinks So

Shiba Inu Price Slips 4% as 3500% Burn Rate Surge Fails to Halt Correction

Washington financial watchdog warns of scam involving fake crypto ‘professors’

‘Hamster Kombat’ Airdrop Delayed as Pre-Market Trading for Telegram Game Expands

Citigroup Executive Steps Down To Explore Crypto
Mostbet Güvenilir Mi – Casino Bonus 2024

NoOnes Bitcoin Philosophy: Everyone Eats

 3 months ago
182267361726451435

 Donald Trump5 months ago
Why Did Trump Change His Mind on Bitcoin?
 24/7 Cryptocurrency News4 months ago
Top Crypto News Headlines of The Week
 News4 months ago
New U.S. president must bring clarity to crypto regulation, analyst says
 Price analysis5 months ago
Will XRP Price Defend $0.5 Support If SEC Decides to Appeal?
 Opinion5 months ago
Bitcoin Open-Source Development Takes The Stage In Nashville
 Bitcoin5 months ago
Ethereum, Solana touch key levels as Bitcoin spikes
 Bitcoin5 months ago
Bitcoin 20% Surge In 3 Weeks Teases Record-Breaking Potential

✓ Share: