
Not
Notcoin Price Soars 30% as Double Bottom Pattern Emerges; Correction Over?
Notcoin price soared 30% on Tuesday, outshining other major altcoins during a relief rally. As Bitcoin staged a notable rebound from the psychological $50,000 level, selling pressure on Notcoin eased significantly. During this pullback, most major altcoins experienced a resurgence in demand, highlighting the traders’ persistent inclination to buy the dip.
Also Read: Bitwise Bitcoin ETF: $40B Wealth Manager Taps BITB For BTC Investments
Notcoin Price Rebounds Amid Double Bottom Pattern
Since late July, Notcoin price trajectory on the daily chart has been decidedly bearish, highlighting strong seller dominance. This downturn saw the asset plummet from $0.018 to a low of $0.0085, representing a 52% decline.
However, the falling price witnessed renewed demand pressure at $0.0091, which supported the 93% rally in early July. As market conditions stabilized, Notcoin price sharply recovered to $0.012, simultaneously boosting its market capitalization to $1.274 billion.
According to Coinglass, this price surge triggered the liquidation of $751.1K in short positions, introducing a wave of uncertainty among traders. A more detailed examination of the daily chart reveals this reversal as a potential double-bottom pattern, often indicative of a market bottom.

The Relative Strength Index (RSI) has risen from the oversold territory to 46%, bolstered by increased demand for the altcoin at lower prices. Should this pattern persist, Notcoin might see a 44% increase before encountering significant resistance at $0.18.

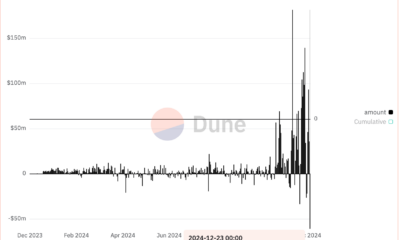
However, derivative market data show substantial losses in Notcoin’s open interest (OI) in the first week of August. The OI metrics dropped from $142.15M to $88.8M, registering a loss of 37.5%. This significant decline in OI data indicates waning investor confidence and a potential decrease in market activity.
Also Read: Crypto Market Recovers As Japan’s Nikkei Stock Index Rises 12%

NOT Futures Open Interest | CoinglassMoreover, the potential confluence of the 20- and 50-day Exponential Moving Average (EMA) around the $0.0133 mark creates significant resistance against buyers, hindering potential upswing efforts.
Thus, if the price breaks below the $0.0091 support, the bullish thesis will be invalidated. The post-breakdown fall could plunge the asset 52% to seek support at the $0.0045 level.
Frequently Asked Questions (FAQs)
The double bottom pattern is significant because it often signals the end of a downtrend and the beginning of a potential uptrend, indicating a shift in market sentiment from bearish to bullish
Open interest refers to the total number of outstanding derivative contracts, such as futures or options, that have not been settled
The daily chart shows notable resistance at $0.146, and support $180, while key support holds at $0.00913, followed by $0.0075
Related Articles
Sahil Mahadik
Sahil is a dedicated full-time trader with over three years of experience in the financial markets. Armed with a strong grasp of technical analysis, he keeps a vigilant eye on the daily price movements of top assets and indices. Drawn by his fascination with financial instruments, Sahil enthusiastically embraced the emerging realm of cryptocurrency, where he continues to explore opportunities driven by his passion for trading
Disclaimer: The presented content may include the personal opinion of the author and is subject to market condition. Do your market research before investing in cryptocurrencies. The author or the publication does not hold any responsibility for your personal financial loss.
Source link


A closely followed crypto strategist thinks two altcoins unseen by most traders are gearing up for huge upside bursts.
Analyst Ali Martinez tells his 78,600 followers on the social media platform X that he’s bullish on the native asset of the peer-to-peer file storage network Filecoin (FIL).
According to the analyst, FIL looks poised to rally to its range high after respecting its long-term support. Martinez also thinks that FIL could witness exponential rallies if it manages to overcome a crucial resistance level.
“Missed out on the $2.94 entry, but I’m still bullish on Filecoin FIL at this level.
The lower boundary has held strong for almost two years, setting us up for a potential rebound to $9.50 – a 145% gain. If we see a breakout above the upper boundary ($9.50), FIL could reach $30, delivering around 700% upside from here.”
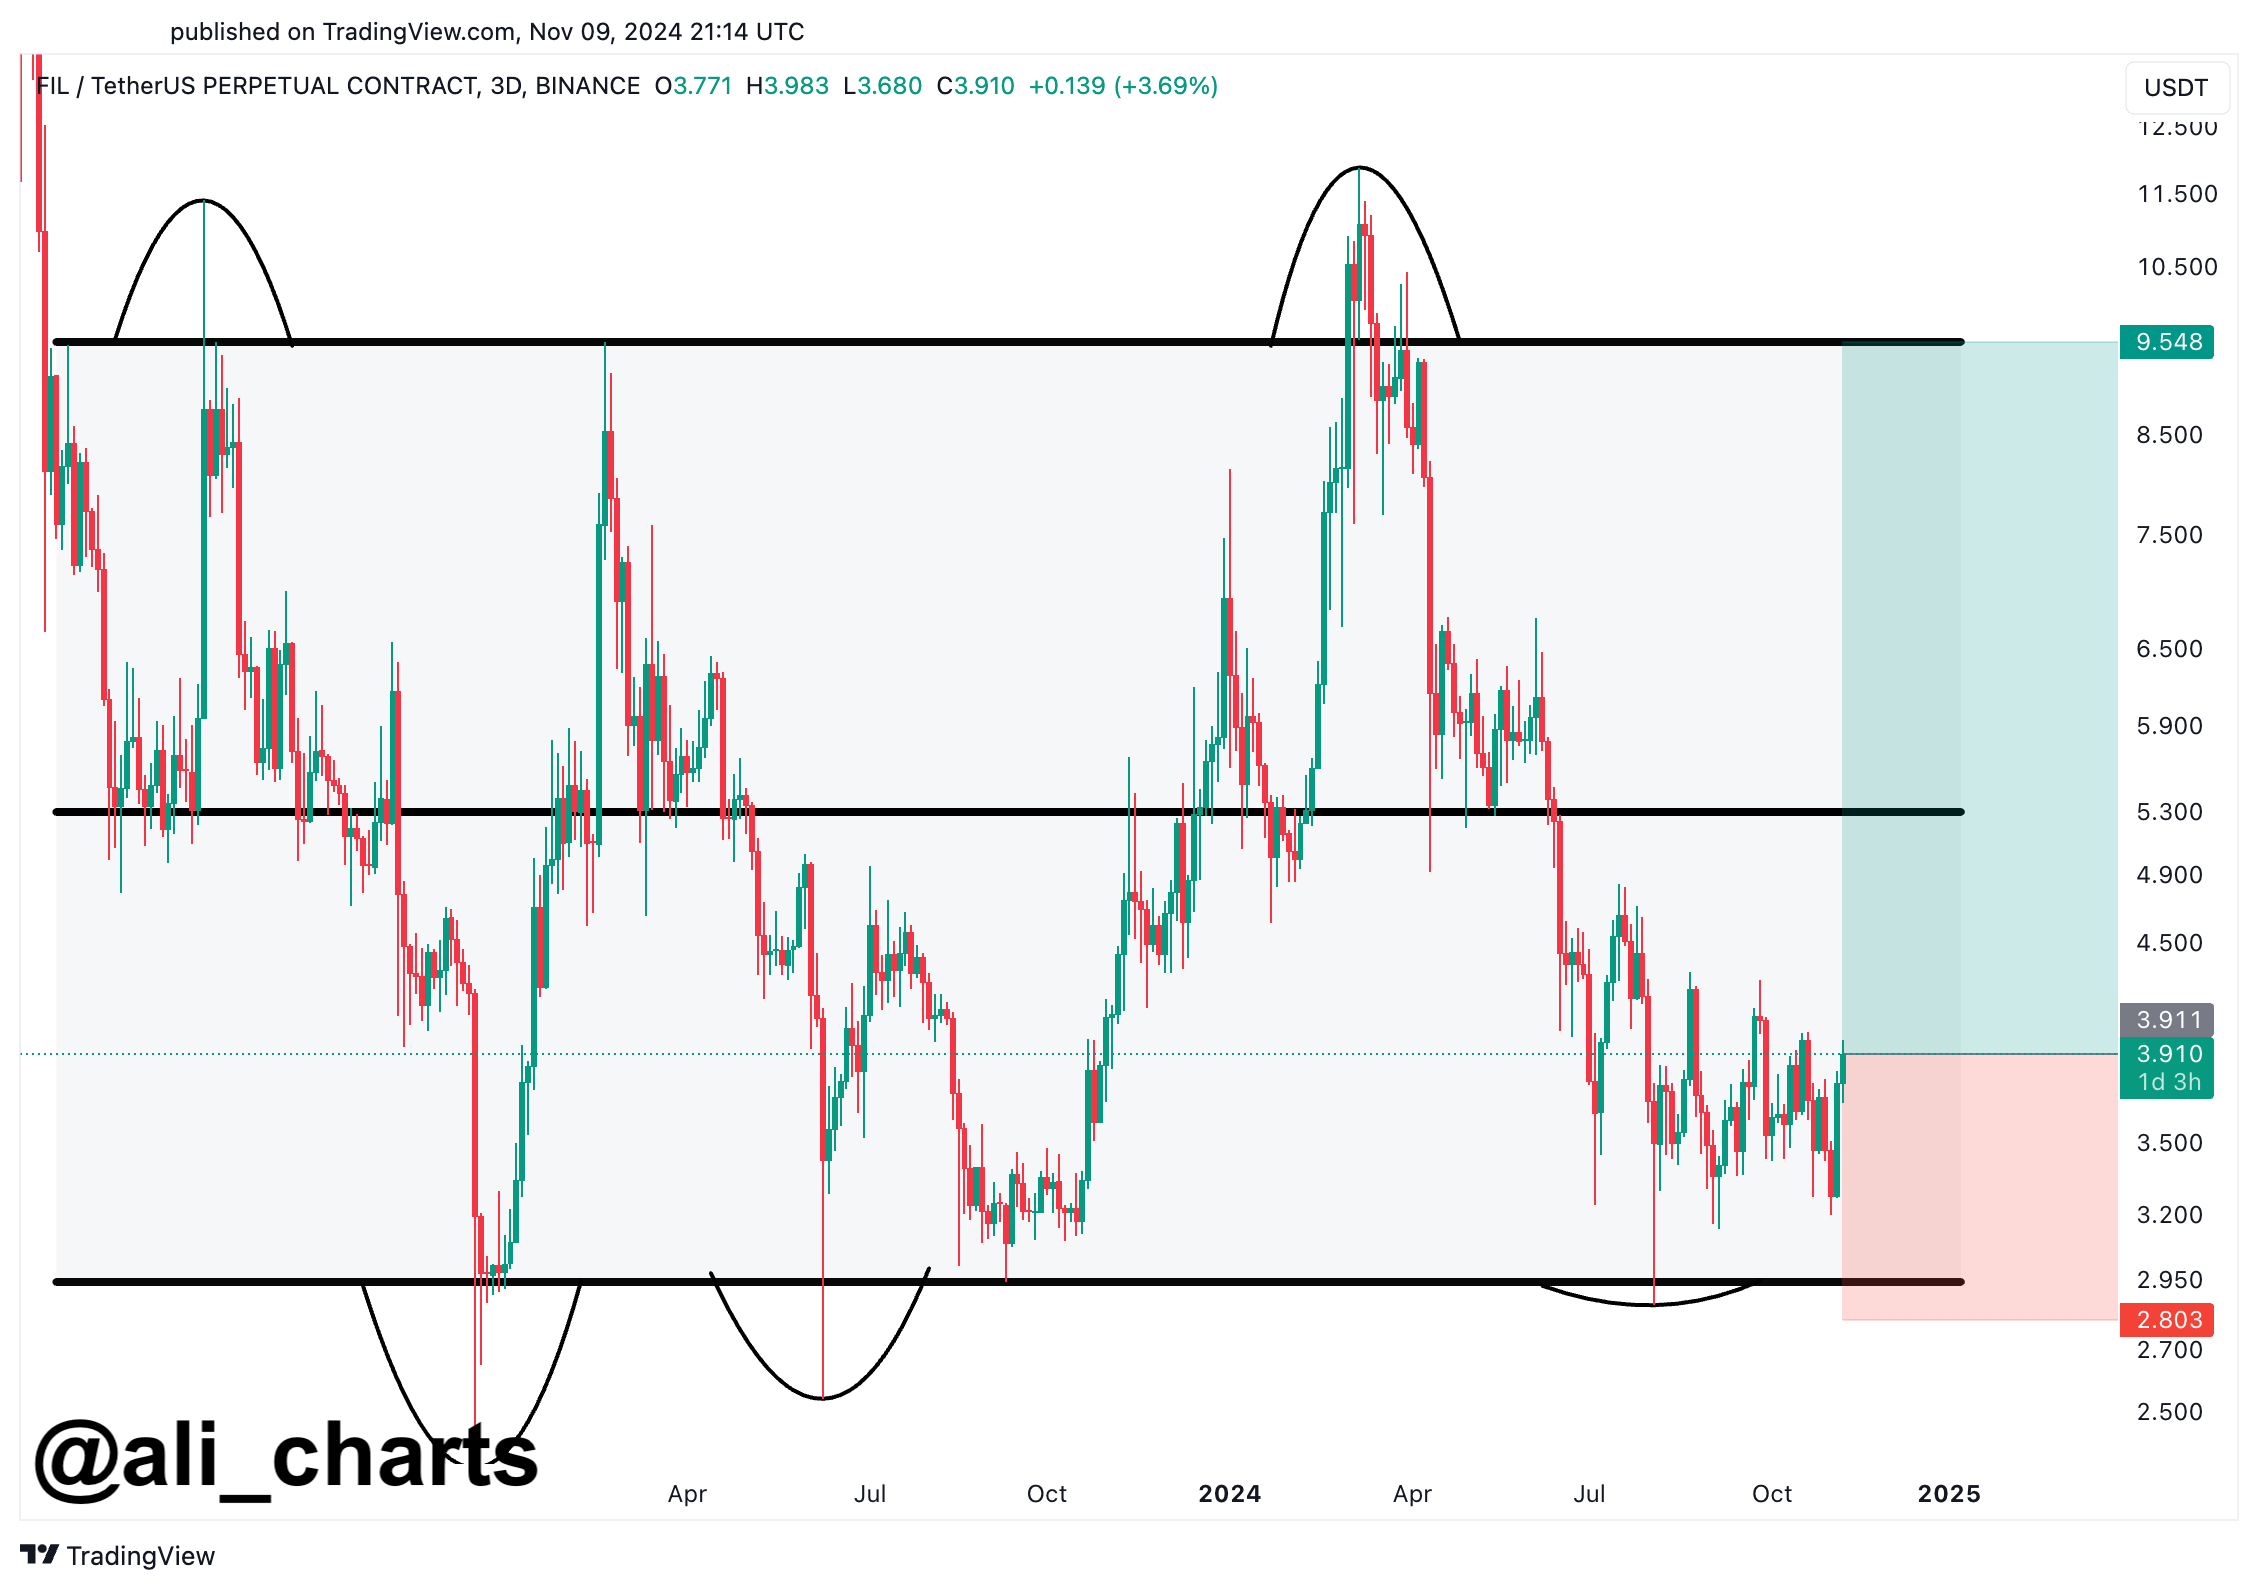
At time of writing, FIL is worth $4.32, up over 7% in the past day.
The trader is also keeping an eye on NOT, the community token for the popular Telegram-based tap-to-earn mining game Notcoin. Martinez says he’s bullish on NOT after the altcoin shattered the diagonal resistance of a falling wedge structure – a bullish reversal pattern.
“Notcoin NOT broke out of the falling wedge, and its price is projected to increase 76% to $0.012!”

At time of writing, NOT is worth $0.0076.
Don’t Miss a Beat – Subscribe to get email alerts delivered directly to your inbox
Check Price Action
Follow us on X, Facebook and Telegram
Surf The Daily Hodl Mix
 

Disclaimer: Opinions expressed at The Daily Hodl are not investment advice. Investors should do their due diligence before making any high-risk investments in Bitcoin, cryptocurrency or digital assets. Please be advised that your transfers and trades are at your own risk, and any losses you may incur are your responsibility. The Daily Hodl does not recommend the buying or selling of any cryptocurrencies or digital assets, nor is The Daily Hodl an investment advisor. Please note that The Daily Hodl participates in affiliate marketing.
Generated Image: DALLE3
Source link
Solana beats Ethereum in a key metric 3 months in a row

SCENE’s 2024 Person of the Year: Iggy Azalea

BTC Risks Falling To $20K If This Happens

Most Layer 2 solutions are still struggling with scalability

Here’s why Stellar Price Could Go Parabolic Soon

Perp-Focused HyperLiquid Experiences Record $60M in USDC Net Outflows

Experts say these 3 altcoins will rally 3,000% soon, and XRP isn’t one of them

Robert Kiyosaki Hints At Economic Depression Ahead, What It Means For BTC?

BNB Steadies Above Support: Will Bullish Momentum Return?

Metaplanet makes largest Bitcoin bet, acquires nearly 620 BTC

Tron’s Justin Sun Offloads 50% ETH Holdings, Ethereum Price Crash Imminent?

Investors bet on this $0.0013 token destined to leave Cardano and Shiba Inu behind

End of Altcoin Season? Glassnode Co-Founders Warn Alts in Danger of Lagging Behind After Last Week’s Correction

Can Pi Network Price Triple Before 2024 Ends?

XRP’s $5, $10 goals are trending, but this altcoin with 7,400% potential takes the spotlight
182267361726451435
Why Did Trump Change His Mind on Bitcoin?

Top Crypto News Headlines of The Week

New U.S. president must bring clarity to crypto regulation, analyst says

Will XRP Price Defend $0.5 Support If SEC Decides to Appeal?

Bitcoin Open-Source Development Takes The Stage In Nashville

Ethereum, Solana touch key levels as Bitcoin spikes

Bitcoin 20% Surge In 3 Weeks Teases Record-Breaking Potential

Ethereum Crash A Buying Opportunity? This Whale Thinks So

Shiba Inu Price Slips 4% as 3500% Burn Rate Surge Fails to Halt Correction

Washington financial watchdog warns of scam involving fake crypto ‘professors’

‘Hamster Kombat’ Airdrop Delayed as Pre-Market Trading for Telegram Game Expands

Citigroup Executive Steps Down To Explore Crypto
Mostbet Güvenilir Mi – Casino Bonus 2024

NoOnes Bitcoin Philosophy: Everyone Eats

 3 months ago
182267361726451435

 Donald Trump5 months ago
Why Did Trump Change His Mind on Bitcoin?
 24/7 Cryptocurrency News4 months ago
Top Crypto News Headlines of The Week
 News4 months ago
New U.S. president must bring clarity to crypto regulation, analyst says
 Price analysis4 months ago
Will XRP Price Defend $0.5 Support If SEC Decides to Appeal?
 Opinion5 months ago
Bitcoin Open-Source Development Takes The Stage In Nashville
 Bitcoin5 months ago
Ethereum, Solana touch key levels as Bitcoin spikes
 Bitcoin5 months ago
Bitcoin 20% Surge In 3 Weeks Teases Record-Breaking Potential

✓ Share: