
Bitcoin
Analyst Warns Of Imminent Bitcoin Plunge Below $54,000 To Fill CME Gap

After enduring a substantial drop to a seven-month low earlier this week, Bitcoin (BTC) showed resilience by reclaiming ground above the $57,000 threshold on Tuesday, sparking optimism among bullish investors who hoped that the worst of the downturn was behind them.
However, the leading cryptocurrency has quickly retraced over 3% in the past few hours, slipping back towards the $54,900 level, suggesting a possible continuation of the prevailing downtrend.
BTC’s CME Gap & Bearish Indicators
Crypto analyst Rekt Capital weighed in on the situation, noting Bitcoin’s repeated retracements following unsuccessful attempts to stabilize at higher levels. Rekt Capital pointed out that Bitcoin stands on the verge of filling the CME Gap positioned between $53,700 and $54,600.
While acknowledging the proximity of the current price at $54,900 to this gap, there’s uncertainty surrounding the necessity of filling it, especially considering its relatively minor size.
Related Reading
The analyst mused on the possibility that this downward movement could merely signify a volatile daily retest around the $55,800 support level, which aligns with the lows seen in early July.
However, if the CME Gap does require filling, doing so sooner rather than later, while the price remains in close proximity, could be a strategic move, according to Rekt’s analysis.
Adding to the bearish indicators, Julio Moreno, Head of Research at data analytics firm CryptoQuant, highlighted a significant observation regarding the Bull-Bear Market Cycle Indicator.
Moreno flagged a bear phase for the first time since January 2023. Previous instances of the indicator signaling bear phases coincided with major market events like the COVID-induced sell-off in March 2020 and the Chinese mining ban in May 2021, accurately predicting the onset of bearish trends in November 2021.
$50,000 Bitcoin Support At Risk?
Crypto firm Material Indicators has also shared bearish predictions in the near term for the Bitcoin price, raising red flags concerning Bitcoin’s bullish momentum. Observing a scenario where Bitcoin bulls are seemingly under siege, the firm notes a stabilization in BTC bids around the $50,000 mark.
However, the cautionary tone emerges as they brace for a potential dip towards a crucial support level at $45,000 if the $50,000 mark fails to hold firm.
Related Reading
Adding to the market sentiments, market expert Jesse Olson has detected a pending sell signal on Bitcoin’s weekly Heikin Ashi chart. This signal, if confirmed, would mark only the fifth such occurrence since 2021, indicating a significant shift in market dynamics.
Ultimately, it becomes increasingly apparent that Bitcoin must exhibit robust bullish momentum in the days ahead to counteract the intensification of the current downtrend.
Revisiting its all-time high levels of $73,700, achieved in March, now appears contingent upon sustained upward movements to offset the prevailing market pressures.
Featured image from DALL-E, chart from TradingView.com
Source link


Rich Dad Poor Dad author Robert Kiyosaki has issued a stark warning while hinting towards an economic depression ahead. In a recent X post, the renowned author said that the global market crash has already started, as he predicted earlier, which indicates that the financial market might enter a “depression” phase. Notably, this comes as the crypto market records immense volatility, sparking concerns over what’s next for Bitcoin (BTC).
Robert Kiyosaki Hints At Economic Depression Ahead
Robert Kiyosaki, in a recent X post, has revealed a stark warning of a looming economic depression. The Rich Dad Poor Dad author warned that a global market crash has already begun, citing Europe, China, and the U.S. as regions facing significant downturns.
In his post, Kiyosaki urged caution, advising individuals to safeguard their finances and maintain their jobs. “Global crash has started. Europe, China, USA going down. Depression ahead?” he asked while emphasizing the enduring value of assets like gold, silver, and Bitcoin. He added, “For many people, crashes are the best times to get rich.”
This warning aligns with Kiyosaki’s earlier prediction of what he called the “biggest crash in history.” Earlier this month, he encouraged his followers to prepare for financial turmoil, stating, “Please be proactive and get rich… before the BOOMER’s go BUST.”
However, this recent comment from Robert Kiyosaki indicates his sustained confidence in BTC. As the crypto market faces heightened volatility, Bitcoin could emerge as a hedge against traditional market instability, he noted. Besides, it also indicates that the flagship crypto, alongside gold and silver, might continue to gain traction amid this economic turmoil.
What’s Next For BTC?
Bitcoin price today has continued its volatile trading, losing nearly 1.5% over the last 24 hours to $95,323. The crypto touched a high and low of $97,260 and $93,690 in the last 24 hours, showcasing the highly volatile scenario in the market.
In addition, the US Spot Bitcoin ETF also recorded significant outflow, with BlackRock Bitcoin ETF witnessing its largest outflux since its launch. This has weighed on the investors’ sentiment, sparking concerns over a waning institutional interest.
However, despite that, many experts remained confident on the asset’s future trajectory. For context, in a recent X post, Peter Brandt shared a new BTC price target, indicating his confidence in the digital asset.
On the other hand, institutions like Metaplanet have also continued to boost their BTC holdings. These moves indicates that the institutions, as well as many investors, are bullish towards the long-term potential of the crypto. Besides, as Robert Kiyosaki said, the recent dip also provides a buying opportunity to investors, which might further boost Bitcoin to its new ATH ahead.
Rupam Roy
Rupam is a seasoned professional with three years of experience in the financial market, where he has developed a reputation as a meticulous research analyst and insightful journalist. He thrives on exploring the dynamic nuances of the financial landscape. Currently serving as a sub-editor at Coingape, Rupam’s expertise extends beyond conventional boundaries. His role involves breaking stories, analyzing AI-related developments, providing real-time updates on the crypto market, and presenting insightful economic news.
Rupam’s career is characterized by a deep passion for unraveling the complexities of finance and delivering impactful stories that resonate with a diverse audience.
Disclaimer: The presented content may include the personal opinion of the author and is subject to market condition. Do your market research before investing in cryptocurrencies. The author or the publication does not hold any responsibility for your personal financial loss.
Source link


Tokyo-listed Metaplanet has purchased another 9.5 billion yen ($60.6 million) worth of Bitcoin, pushing its holdings to 1,761.98 BTC.
Metaplanet, a publicly traded Japanese company, has acquired 619.7 Bitcoin as part of its crypto treasury strategy, paying an average of 15,330,073 yen per (BTC), with a total investment of 9.5 billion yen.
According to the company’s latest financial disclosure, Metaplanet’s total Bitcoin holdings now stand at 1,761.98 BTC, with an average purchase price of 11,846,002 yen (~$75,628) per Bitcoin. The company has spent 20.872 billion yen in total on Bitcoin acquisitions, the document reads.
The latest purchase is the largest so far for the Tokyo-headquartered company and comes just days after Metaplanet issued its 5th Series of Ordinary Bonds via private placement with EVO FUND, raising 5 billion yen (approximately $32 million).
The proceeds from this issuance, as disclosed earlier, were allocated specifically for purchasing Bitcoin. These bonds, set to mature in June 2025, carry no interest and allow for early redemption under specific conditions.
Metaplanet buys dip
The company also shared updates on its BTC Yield, a metric used to measure the growth of Bitcoin holdings relative to fully diluted shares. From Oct. 1 to Dec. 23, Metaplanet’s BTC Yield surged to 309.82%, up from 41.7% in the previous quarter.
Bitcoin itself has seen strong performance this year, climbing 120% and outperforming assets like the Nasdaq 100 and S&P 500 indices. However, it has recently pulled back from its all-time high of $108,427, trading at $97,000 after the Federal Reserve indicated only two interest rate cuts in 2025.
Despite the retreat, on-chain metrics indicate that Bitcoin is still undervalued based on its Market Value to Realized Value (MVRV-Z) score, which stands at 2.84 — below the threshold of 3.7 that historically signals an asset is overvalued.
Source link
Altcoin Season
End of Altcoin Season? Glassnode Co-Founders Warn Alts in Danger of Lagging Behind After Last Week’s Correction

The creators of the crypto analytics firm Glassnode are warning that altcoins could lose all bullish momentum following last week’s market correction.
Jan Happel and Yann Allemann, who go by the handle Negentropic on the social media platform X, tell their 63,400 followers that “altcoin season,” which they say began in late November, could come to an abrupt end after alts witnessed deep pullbacks over the last seven days.
According to the Glassnode co-founders, traders and investors will likely have a risk-off approach on altcoins unless Bitcoin recovers a key psychological price point.
“Is This the End of Altcoin Season?
Bitcoin dominance is surging after dipping below $100,000, while altcoins are losing critical supports. Dominance has risen and resumed its upward trend, signaling a stronger BTC environment.
If BTC stabilizes above $100,00, we might see a pump in altcoins now in accumulation zones. Until then, Bitcoin appears poised to lead, leaving altcoins lagging behind.”
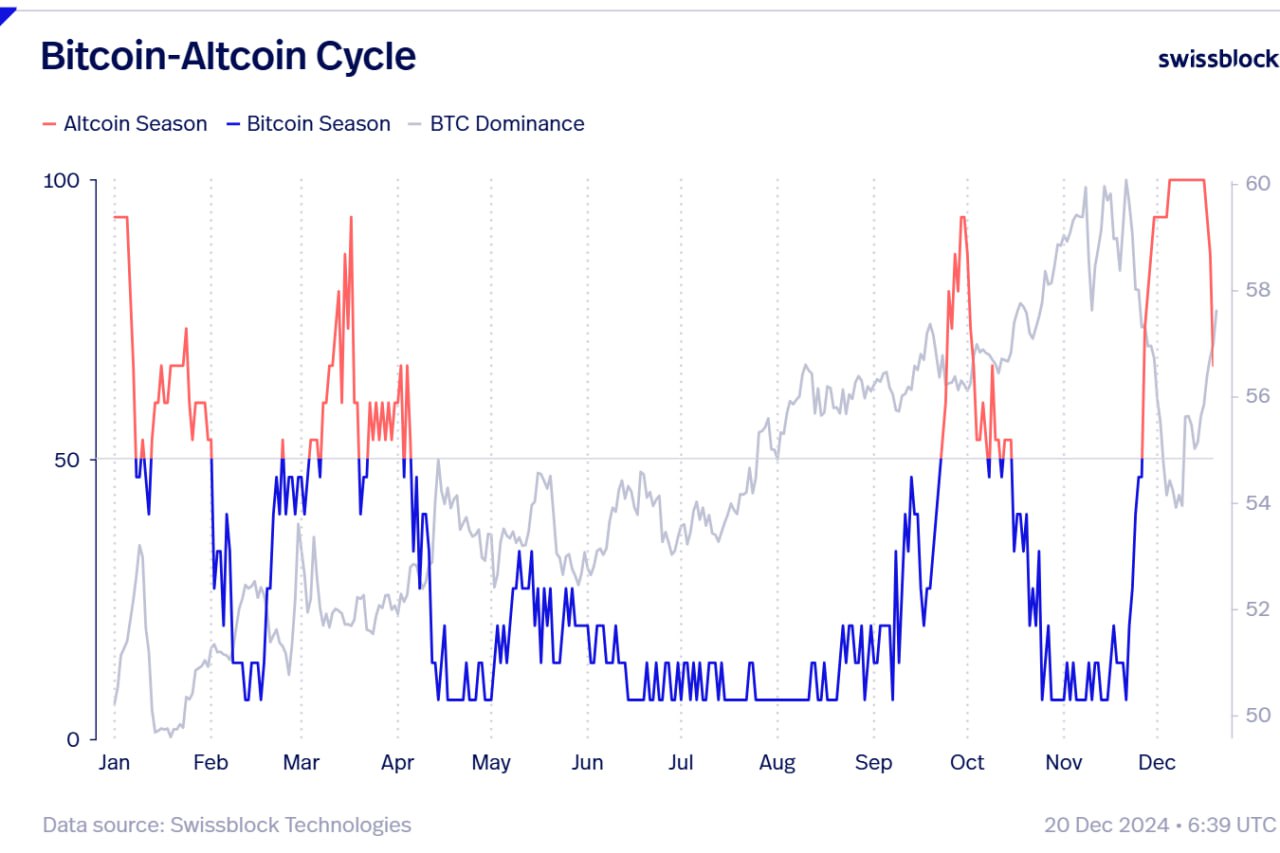
The Bitcoin Dominance (BTC.D) chart tracks how much of the total crypto market cap belongs to BTC. In the current state of the market, a surging BTC.D suggests that altcoins are losing value faster than Bitcoin.
At time of writing, BTC.D is hovering at 59%.
Looking at Bitcoin itself, the Glassnode executives say long-term Bitcoin holders are massively unloading their holdings as other investor cohorts pick up the slack.
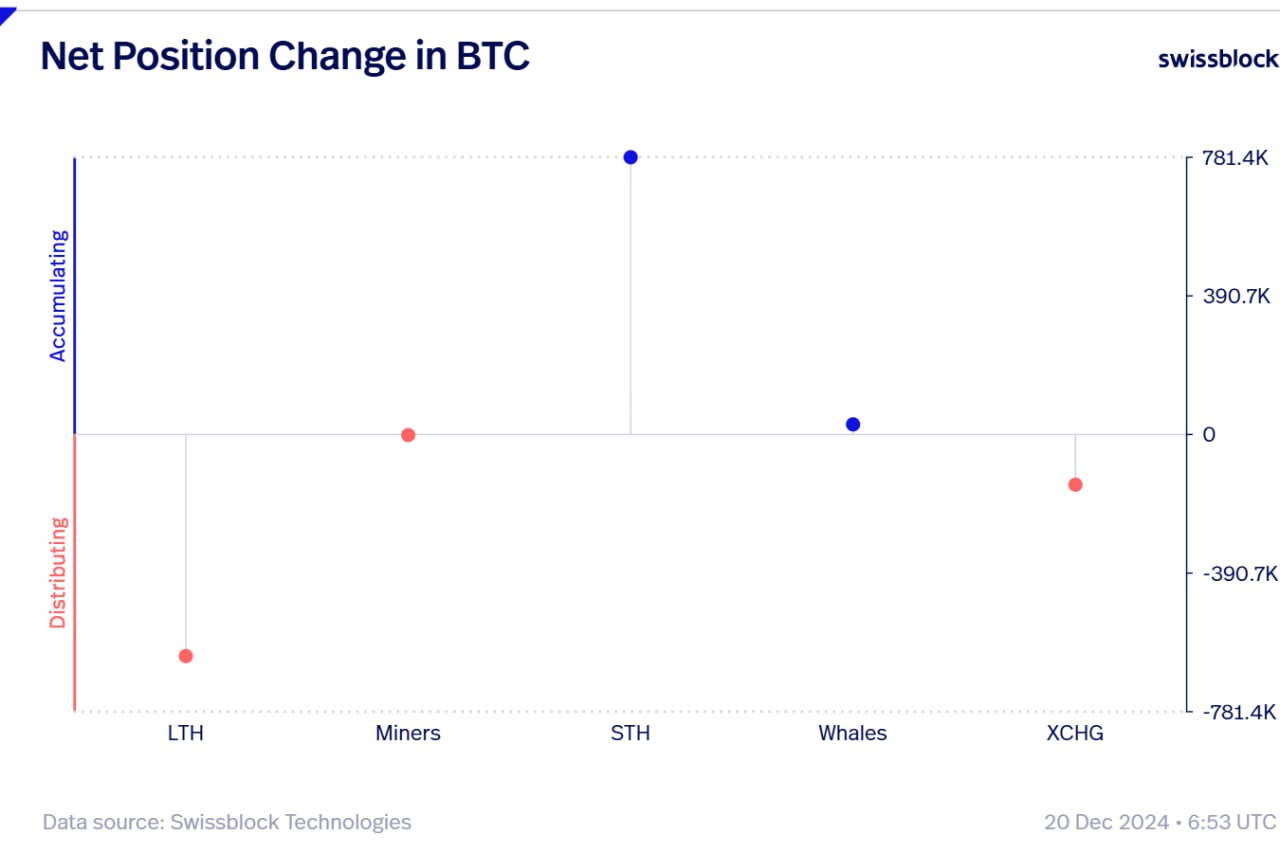
“The Board Keeps Shifting.
As BTC continues flowing out of exchanges during this dip, long-term holders are exiting forcefully, while short-term holders step in without hesitation.
Whales quietly accumulate, miners remain neutral, and selling pressure has merely reshuffled the board.
New hands are absorbing the sales.”
At time of writing, Bitcoin is worth $97,246.
Don’t Miss a Beat – Subscribe to get email alerts delivered directly to your inbox
Check Price Action
Follow us on X, Facebook and Telegram
Surf The Daily Hodl Mix
 

Disclaimer: Opinions expressed at The Daily Hodl are not investment advice. Investors should do their due diligence before making any high-risk investments in Bitcoin, cryptocurrency or digital assets. Please be advised that your transfers and trades are at your own risk, and any losses you may incur are your responsibility. The Daily Hodl does not recommend the buying or selling of any cryptocurrencies or digital assets, nor is The Daily Hodl an investment advisor. Please note that The Daily Hodl participates in affiliate marketing.
Generated Image: DALLE3
Source link

5 Tokens Ready For A 20X After Solana ETF Approval
Solana beats Ethereum in a key metric 3 months in a row

SCENE’s 2024 Person of the Year: Iggy Azalea

BTC Risks Falling To $20K If This Happens

Most Layer 2 solutions are still struggling with scalability

Here’s why Stellar Price Could Go Parabolic Soon

Perp-Focused HyperLiquid Experiences Record $60M in USDC Net Outflows

Experts say these 3 altcoins will rally 3,000% soon, and XRP isn’t one of them

Robert Kiyosaki Hints At Economic Depression Ahead, What It Means For BTC?

BNB Steadies Above Support: Will Bullish Momentum Return?

Metaplanet makes largest Bitcoin bet, acquires nearly 620 BTC

Tron’s Justin Sun Offloads 50% ETH Holdings, Ethereum Price Crash Imminent?

Investors bet on this $0.0013 token destined to leave Cardano and Shiba Inu behind

End of Altcoin Season? Glassnode Co-Founders Warn Alts in Danger of Lagging Behind After Last Week’s Correction

Can Pi Network Price Triple Before 2024 Ends?
182267361726451435
Why Did Trump Change His Mind on Bitcoin?

Top Crypto News Headlines of The Week

New U.S. president must bring clarity to crypto regulation, analyst says

Will XRP Price Defend $0.5 Support If SEC Decides to Appeal?

Bitcoin Open-Source Development Takes The Stage In Nashville

Ethereum, Solana touch key levels as Bitcoin spikes

Bitcoin 20% Surge In 3 Weeks Teases Record-Breaking Potential

Ethereum Crash A Buying Opportunity? This Whale Thinks So

Shiba Inu Price Slips 4% as 3500% Burn Rate Surge Fails to Halt Correction

Washington financial watchdog warns of scam involving fake crypto ‘professors’

‘Hamster Kombat’ Airdrop Delayed as Pre-Market Trading for Telegram Game Expands

Citigroup Executive Steps Down To Explore Crypto
Mostbet Güvenilir Mi – Casino Bonus 2024

NoOnes Bitcoin Philosophy: Everyone Eats

 3 months ago
182267361726451435

 Donald Trump5 months ago
Why Did Trump Change His Mind on Bitcoin?
 24/7 Cryptocurrency News4 months ago
Top Crypto News Headlines of The Week
 News4 months ago
New U.S. president must bring clarity to crypto regulation, analyst says
 Price analysis4 months ago
Will XRP Price Defend $0.5 Support If SEC Decides to Appeal?
 Opinion5 months ago
Bitcoin Open-Source Development Takes The Stage In Nashville
 Bitcoin5 months ago
Ethereum, Solana touch key levels as Bitcoin spikes
 Bitcoin5 months ago
Bitcoin 20% Surge In 3 Weeks Teases Record-Breaking Potential

✓ Share: