cryptocurrency
IRS lightens crypto reporting requirements for tax filings
Published
3 months agoon
By
admin

The Internal Revenue Service has simplified the reporting requirements in the latest iteration of Form 1099-DA, which crypto brokers and taxpayers will use to report digital asset transactions.
According to the Aug. 9 update, the new draft has removed several requirements that were part of the April version when the IRS first introduced the form.
Taxpayers are no longer required to provide information about wallet addresses and transaction IDs, along with the exact time of day for each transaction, requiring only the date. This revision comes in response to feedback from the cryptocurrency industry.
In April, the IRS first unveiled the draft Form 1099-DA, which not only required detailed transaction information but also mandated that brokers disclose whether they were kiosk operators, digital asset payment processors, hosted wallet providers, unhosted wallet providers, or “others.”
The draft was met with criticism, particularly for listing unhosted wallet providers as brokers. Critics pointed out that these providers do not have access to the nature of transactions or the identities of the parties involved.
I don’t think crypto will be pseudo-anonymous or privacy-preserving anymore, at least in the US.
Yesterday, the IRS issued the long-awaited draft Form 1099-DA, the first tax form specifically designed to collect your ID and detailed transaction data at scale from “brokers”.… pic.twitter.com/H4aTtm5fp9
— Shehan (@TheCryptoCPA) April 19, 2024
The latest update eliminates the requirement for taxpayers to specify the “broker type,” along with the other changes, to better align with the realities of the digital asset industry.
The crypto community welcomed the change, with some calling it a step in the right direction.
Attorney Drew Hinkes from the law firm K&L Gates described the updated form as “massively improved” because it requires “considerably less” data reporting.
The Blockchain Association, an industry advocacy group, had previously warned that the earlier requirements could have led to up to $254 billion in compliance costs.
If approved, the form is expected to take effect in the 2025 tax year, with filings due in April 2026. The IRS has also invited public comments on the draft form within 30 days.
Form 1099-DA originally stems from reporting rules proposed by the IRS and the Treasury Department in August 2023 as part of the Infrastructure Investment and Jobs Act passed in 2021. The idea was to treat crypto brokers like their traditional counterparts.
IRS Commissioner Danny Werfel said at the time that the rules were designed to close the tax gap and ensure consistent tax treatment across different asset classes.
The proposal’s definition of brokers was broad, including trading platforms, payment processors, and certain hosted wallets. Decentralized exchanges were also included in the reporting requirements.
Back then, the Treasury explained that the key issue wasn’t how a platform operate but ensuring that all digital asset transactions are reported, regardless of the platform.
Critics in the crypto sector were quick to raise concerns over the potential impact on defi platforms like Uniswap. Subsequently, in a final draft released in June 2024, decentralized exchanges and self-custody wallets were exempt from the reporting requirements.
Source link
You may like


Trump Picks Pro-Crypto Hedge Fund Manager Scott Bessent for Treasury Secretary


Crypto millionaires will be made by April 2025: 6 coins to hold


Cardano Price Hits $1 But Analyst Says This Is Just The Start


Legacy Media’s Transformation: Why Evolution Beats Extinction


Massive Ethereum Buying Spree – Taker Buy Volume hits $1.683B In One Hour


Ethereum lags behind Bitcoin but is expected to reach $14K, boosting RCOF to new high
Bitcoin Cash (BCH) added nearly 35% to its value in the past month and rallied 12% on Nov. 21. Bitcoin’s (BTC) observed a rally to $98,384 early on Nov. 21, with BCH and other top cryptocurrencies tagging along for the ride.
An analysis of on-chain and technical indicators and data from the derivatives market shows that BCH could extend gains and retest its mid-April 2024 peak of $569.10.
Bitcoin hits all-time high, fork from 2017 ignites hope for traders
Bitcoin hit a record high of $98,384 on Nov. 21, a key milestone as the cryptocurrency eyes a run to the $100,000 target. BTC was forked in 2017, creating a spin-off or alternative, Bitcoin Cash.
BCH hit a peak of $1,650 in May 2021. Since April 2024, BCH has been consolidating with no clear trend formation.
BCH price rallied nearly 30% since Nov. 15, on-chain indicators show that further rally is likely in the Bitcoin spin-off token.
Bitcoin Cash’s active addresses have climbed consistently since August 2024. Santiment data shows an uptrend in active addresses, meaning BCH traders have sustained demand for the token, supporting a bullish thesis for the cryptocurrency.
The ratio of daily on-chain transaction volume in profit to loss exceeds 2, is 2.141 on Thursday. BCH traded on-chain noted twice as many profitable transactions on the day, as the ones where losses were incurred. This is another key metric that paints a bullish picture for the token forked from Bitcoin.
Binance funding rate is positive since Nov. 10. In the past eleven days, traders have been optimistic about gains in BCH price, according to Santiment data.

The network realized profit/loss metric identifies the net gain or loss of all traders who traded the token within a 24 hour period. NPL metric for Bitcoin Cash shows traders have been taking profits on their holdings, small positive spikes on the daily price chart represent NPL.
Investors need to keep their eyes peeled for significant movements in NPL, large positive spikes imply heavy profit-taking activities that could increase selling pressure across exchange platforms.
84.48% of Bitcoin Cash’s supply is currently profitable, as of Nov. 21. This metric helps traders consider the likelihood of high profit-taking or exits from existing BCH holders, to time an entry/ exit in spot market trades.

Derivatives traders are bullish on BCH
Derivatives market data from Coinglass shows a 33% increase in open interest in Bitcoin Cash. Open interest represents the total number of active contracts that haven’t been settled, representing demand for the BCH token among derivatives traders.
Derivatives trade volume climbed 613% in the same timeframe, to $2.35 billion. Across exchanges, Binance and OKX, the long/short ratio is above 1, closer to 2, meaning traders remain bullish on BCH and expect prices to rally.

BCH futures open interest chart shows a steady increase in the metric, alongside BCH price gain since November 5, 2024. Open interest climbed from $190.74 million to $254.87 million between November 5 and 21.

Technical indicators show BCH could gain 18%
The BCH/USDT daily price chart on Tradingview.com shows that the token remains within the consolidation. The token is stuck within a range from $272.70 to $568.20. BCH could attempt to break past the upper boundary of the range, a daily candlestick close above $568.20 could confirm the bullish breakout.
The April 2024 high of $719.50 is the next major resistance for BCH and the second key level is at $805.80, a key level from May 2021.
The relative strength index reads 64, well below the “overvalued” zone above 70. RSI supports a bullish thesis for BCH. Another key momentum indicator, moving average convergence divergence flashes green histogram bars above the neutral line. This means BCH price trend has an underlying positive momentum.
The awesome oscillator is in agreement with the findings of RSI and MACD, all three technical indicators point at likelihood of gains.

A failure to close above the upper boundary of the range could invalidate the bullish thesis. BCH could find support at the midpoint of the range at $419.90 and the 50-day exponential moving average at $388.50.
Disclosure: This article does not represent investment advice. The content and materials featured on this page are for educational purposes only.
Source link
Blockchain
Sui Network blockchain down for more than two hours
Published
2 days agoon
November 21, 2024By
admin
The Sui Network is suspected to be down for more than two hours. The protocol has not produced any new transaction blocks since Nov. 21 UTC 9:15.
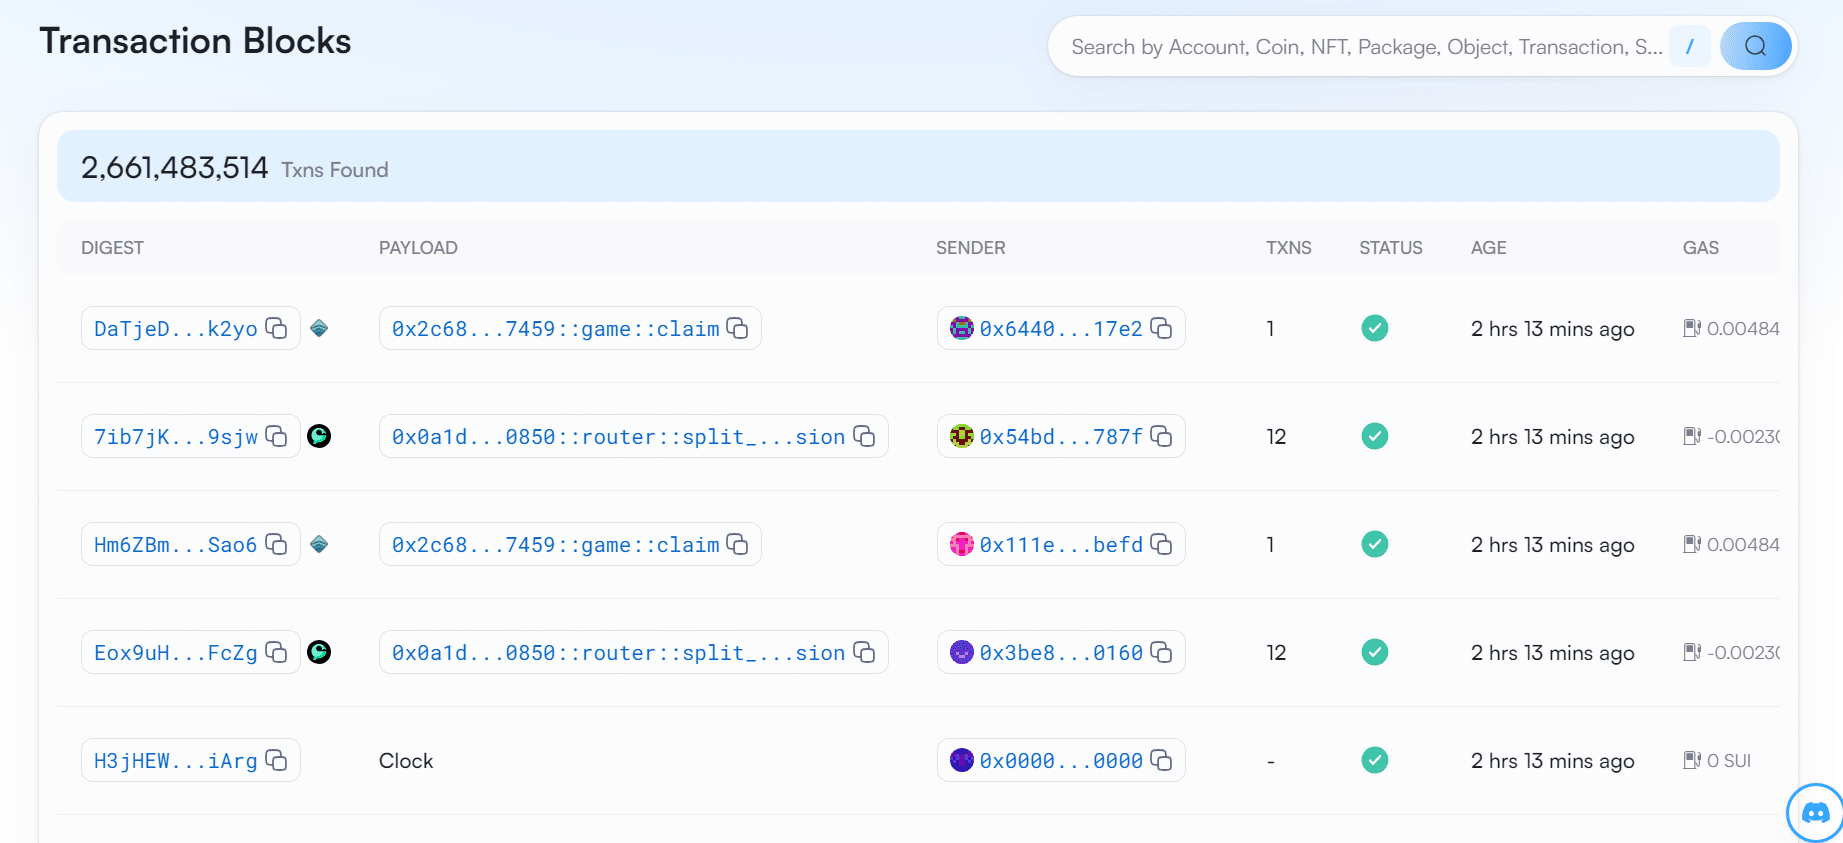
Based on the latest data from Sui Network’s explorer site Sui Vision, the decentralized layer-1 blockchain has stopped producing blocks for more than two hours.
At the time of writing, the last transaction block took place on Nov. 21 at 9:15 am UTC. Since then, no new blocks have been produced on the blockchain.
The Sui Network confirmed the outage on its official X account, stating that the blockchain is currently unable to process transactions. However, it claims that the problem has been identified and will be back to normal soon.
“We’ve identified the issue and a fix will be deployed shortly. We appreciate your patience and will continue to provide updates,” wrote the protocol on X.
Service Announcement: The Sui network is currently experiencing an outage and not processing transactions. We’ve identified the issue and a fix will be deployed shortly. We appreciate your patience and will continue to provide updates.
— Sui (@SuiNetwork) November 21, 2024
Sui’s blockchain outage has seemingly impacted the SUI token price. According to data from crypto.news, the Sui token has gone down by nearly 2% in the past hour. It is currently trading hands at $3.41. In the past 24 hours, SUI has plummeted by 7.29%.
Even though, the token has gone up by nearly 75% in the past month.
SUI currently ranks in the 18th place in the lineup of cryptocurrencies, holding a market cap of $9.7 billion and a fully diluted valuation of $34 billion. The Sui token has a circulating supply of $2,8 billion tokens.
The South Korean crypto exchange, Upbit, announced it will be temporary suspending deposits and withdrawals for the Sui token due to its block generating outage.
The notice informs users that if they deposit or withdraw Sui tokens after the announcement was posted, then there is a chance that their funds cannot be recovered.
Several crypto industry figures took to X to comment on the recent Sui Network outage. Most of them teased Sui’s goal of becoming Solana’s biggest competitor. Ironically, the Solana blockchain also has a track record of outages in the past, with the latest one recorded in February this year.
“Sui [is] just repeating Solana history,” said one X user.
“Hasn’t Solana gone down multiple times?” asked another X user.
“SUI blockchain is down. And they claimed to be a Solana Killer,” wrote crypto YouTuber Ajay Kashyap on his X post.
Source link
cryptocurrency
BONK hits new all-time high following Upbit listing
Published
3 days agoon
November 20, 2024By
admin
BONK has emerged as the top gainer among the leading 100 assets following a major announcement from the South Korean crypto exchange Upbit.
Bonk (BONK), the first Solana-based meme coin, surged 18% on Wednesday to hit a new all-time high of $0.000058. Its market cap soared to over $4.1 billion when writing, flipping Dogwifhat’s (WIF) $3.2 billion market cap to reclaim its position as the largest meme coin on the Solana blockchain.
Why is BONK going up?
The altcoin’s price uptick coincided with a jump in the meme coin’s futures open interest. According to data from CoinGlass, OI for BONK’s futures market rose to an all-time high of $53.5 million, more than 7 times its monthly low of $6.3 million, suggesting a growing demand from investors.
Bonk’s recent rally followed its listing on South Korea’s largest crypto exchange, Upbit. BONK’s daily trading volume shot up 95% amid the listing, hovering over $3.5 billion when writing.
Another key factor driving the altcoin’s gains is Bonk DAO’s announcement of a massive 1 trillion token burn scheduled for Christmas Day, which is set to reduce the total number of tokens in circulation, thereby increasing scarcity.
Whales have also been interested in the meme coin lately. According to data shared by Lookonchain, a whale with a history of profitable meme coin investments has spent 3.4 million USDC to buy 65.4 billion BONK tokens. Last week, another whale was seen picking up 29.32 billion BONK at $0.0000387.
Whale buying typically boosts retail investor confidence in an asset, potentially driving FOMO (fear of missing out) among those seeking quick gains.
Bullish momentum to continue
BONK’s rally hasn’t lost strength despite surging over 72% in the past week alone. On the 1-day BONK/USDT price chart, BONK’s EMA lines show a strong bullish trend, with the short-term 50-day EMA above the long-term 200-day EMA and the price staying above both lines.
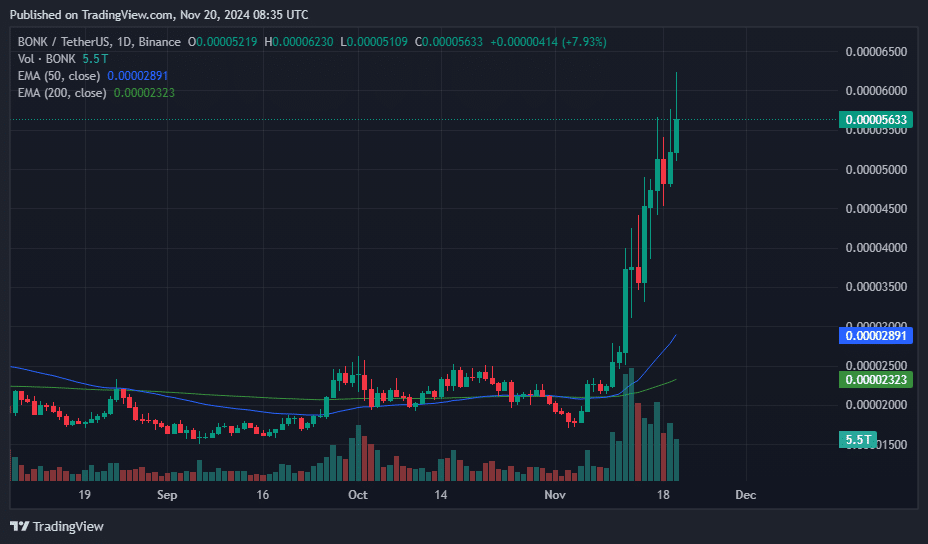
Based on this setup, the bullish trend is expected to continue in the short term as the buyers remain in control. However, the Relative Strength Index showed a reading of 82, which confirms the bullish momentum but puts the meme coin at overbought levels.
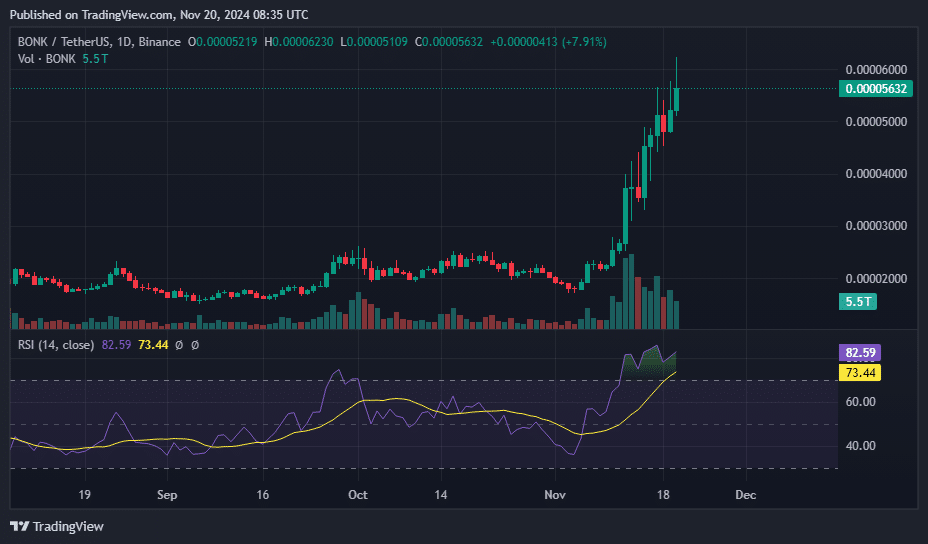
Despite the overbought status, an analyst suggests that BONK is undergoing a ‘Blue Sky breakout,’ which could sustain its upward trajectory in the coming days.
This speculation is supported by strong catalysts driving the uptrend and the current hype around meme coins. Separately, Bitcoin’s recent rally to new highs has amplified market-wide sentiment, further boosting interest in the meme coin sector, which gained 2.3% over the past day.
Source link

Trump Picks Pro-Crypto Hedge Fund Manager Scott Bessent for Treasury Secretary

Crypto millionaires will be made by April 2025: 6 coins to hold

Cardano Price Hits $1 But Analyst Says This Is Just The Start

Legacy Media’s Transformation: Why Evolution Beats Extinction

Massive Ethereum Buying Spree – Taker Buy Volume hits $1.683B In One Hour

Ethereum lags behind Bitcoin but is expected to reach $14K, boosting RCOF to new high

Bitcoin Miner MARA Buys Another 5771 BTC As Price Nears $100k

Jason "Spaceboi" Lowery's Bitcoin "Thesis" Is Incoherent Gibberish

Bankrupt Crypto Exchange FTX Set To Begin Paying Creditors and Customers in Early 2025, Says CEO

Top crypto traders’ picks for explosive growth by 2025

3 Tokens Ready to 100x After XRP ETF Gets Approval

Gary Gensler’s Departure Is No Triumph For Bitcoin

Magic Eden Token Airdrop Date Set as Pre-Market Value Hits $562 Million

Blockchain Association urges Trump to prioritize crypto during first 100 days

Pi Network Coin Price Surges As Key Deadline Nears
182267361726451435

Top Crypto News Headlines of The Week

Why Did Trump Change His Mind on Bitcoin?

New U.S. president must bring clarity to crypto regulation, analyst says

Ethereum, Solana touch key levels as Bitcoin spikes

Will XRP Price Defend $0.5 Support If SEC Decides to Appeal?

Bitcoin Open-Source Development Takes The Stage In Nashville

Bitcoin 20% Surge In 3 Weeks Teases Record-Breaking Potential

Ethereum Crash A Buying Opportunity? This Whale Thinks So

Shiba Inu Price Slips 4% as 3500% Burn Rate Surge Fails to Halt Correction

‘Hamster Kombat’ Airdrop Delayed as Pre-Market Trading for Telegram Game Expands

Washington financial watchdog warns of scam involving fake crypto ‘professors’

Citigroup Executive Steps Down To Explore Crypto
Mostbet Güvenilir Mi – Casino Bonus 2024

Bitcoin flashes indicator that often precedes higher prices: CryptoQuant
Trending

 2 months ago
182267361726451435

 24/7 Cryptocurrency News3 months ago
Top Crypto News Headlines of The Week

 Donald Trump4 months ago
Why Did Trump Change His Mind on Bitcoin?

 News3 months ago
New U.S. president must bring clarity to crypto regulation, analyst says

 Bitcoin4 months ago
Ethereum, Solana touch key levels as Bitcoin spikes

 Price analysis3 months ago
Will XRP Price Defend $0.5 Support If SEC Decides to Appeal?

 Opinion4 months ago
Bitcoin Open-Source Development Takes The Stage In Nashville

 Bitcoin4 months ago
Bitcoin 20% Surge In 3 Weeks Teases Record-Breaking Potential


