Bitcoin price
Is the Bitcoin Bull Cycle Over?
Published
3 months agoon
By
admin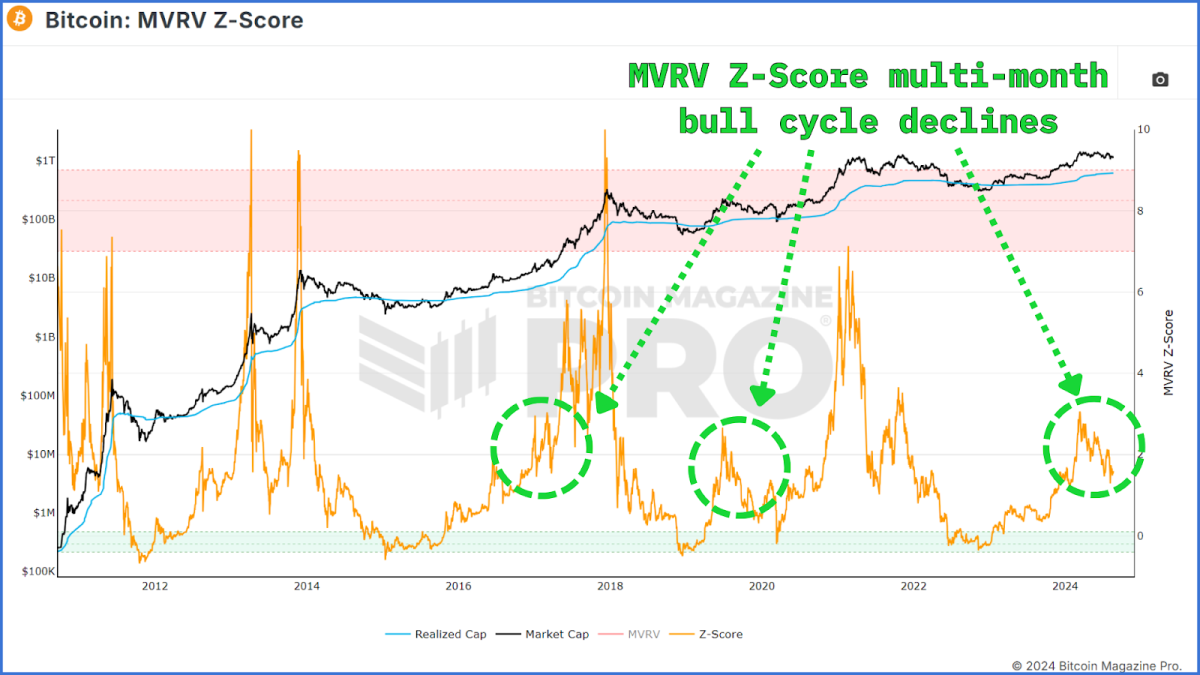
After reaching new all-time highs earlier this year, Bitcoin has entered a multi-month period of choppy price action, leading many to wonder if the bull cycle is over. In this article, we dive deep into key metrics and trends to understand if the market is just cooling off or if we’ve already seen the peak for this cycle.
Fundamentally Overvalued?
One of the most reliable tools for gauging Bitcoin’s market cycles is the MVRV Z-Score. This metric measures the difference between Bitcoin’s market cap and its realized cap, or cost-basis for all circulating BTC, helping investors determine whether Bitcoin is over or undervalued according to this ‘fundamental’ cost of BTC.
Recent data shows that the MVRV Z-Score has demonstrated a sustained downward movement, which might suggest that Bitcoin’s upward trajectory has ended. However, a historical analysis tells a different story. During previous bull cycles, including those in 2016-2017 and 2019-2020, similar declines in the MVRV Z-Score were observed. These drawdown periods were followed by significant rallies, leading to new all-time highs. Thus, while the current downtrend may seem concerning, it’s not necessarily indicative of the bull cycle being over.

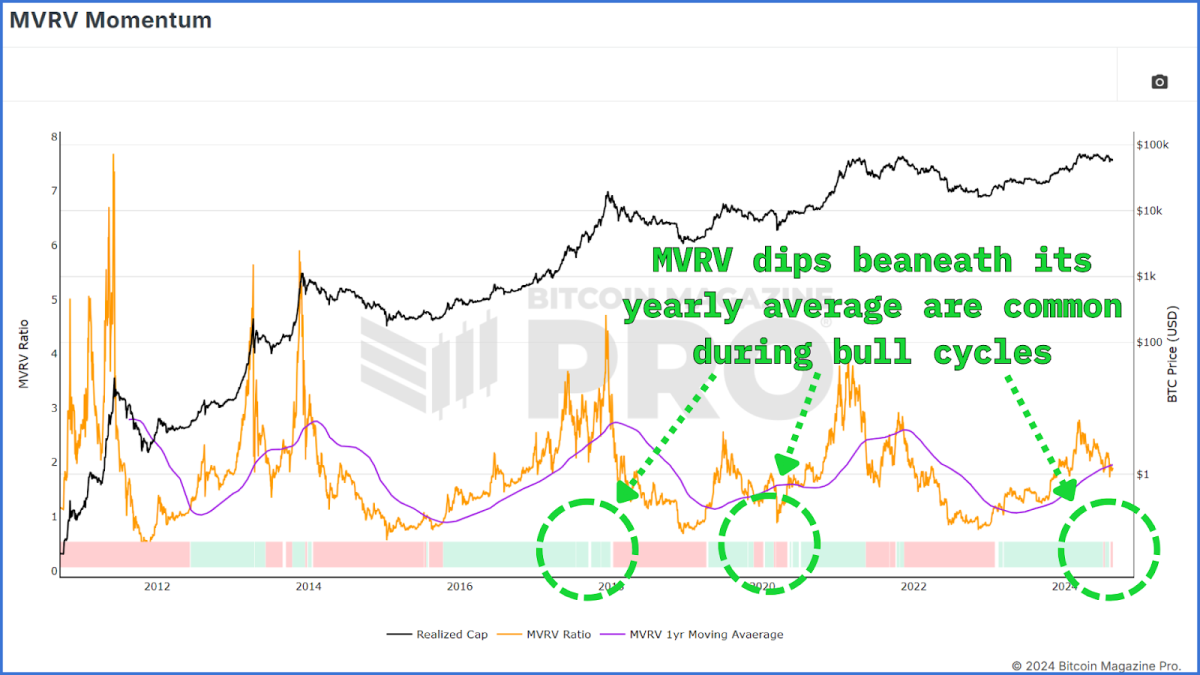
The MVRV Momentum Indicator helps distinguish between bull and bear cycles by applying a moving average to the raw MVRV data. It recently dipped below its moving average and turned red, which may signal the start of a bear cycle. However, historical data shows that similar dips have occurred without leading to a prolonged bear market.
Struggling Beneath Resistance?
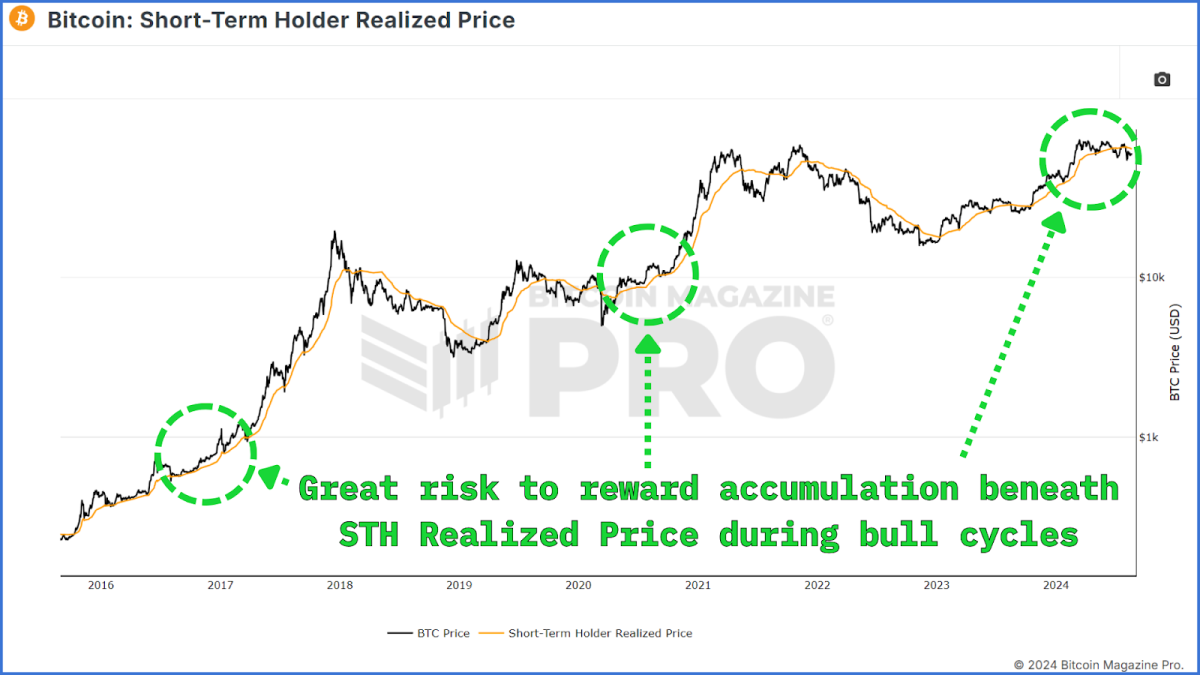
Another essential metric to consider is the Short-Term Holder (STH) Realized Price, which represents the average price at which recent market participants acquired their Bitcoin. Currently, the STH Realized Price is around $63,000, slightly above the current market price. This means that many new investors are holding Bitcoin at a loss.
However, during previous bull cycles, Bitcoin’s price dipped below the STH Realized Price multiple times without signaling the end of the bull market. These dips often presented opportunities for investors to accumulate Bitcoin at discounted prices before the next leg up.
Investor Capitulation?
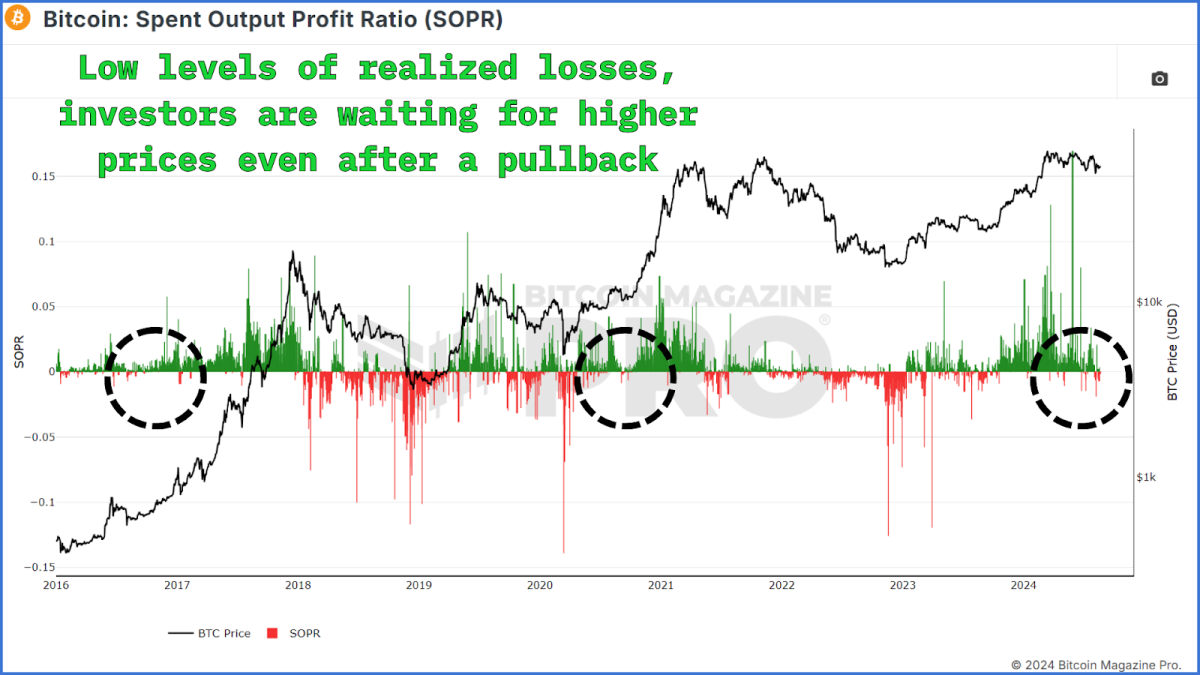
The Spent Output Profit Ratio (SOPR) assesses whether Bitcoin holders are selling at a profit or a loss. When the SOPR is below 0, it suggests that more holders are selling at a loss, which can signal market capitulation. However, recent SOPR data shows only a few instances of selling at a loss, which have been brief. This implies that there is no widespread panic among Bitcoin holders, typically seen during a bear market’s early stages.
In the past, brief periods of selling at a loss during a bull cycle have been followed by significant price increases, as seen in the 2020-2021 run-up. Therefore, the lack of sustained losses and capitulation in the SOPR data supports the view that the bull cycle is still intact.
Diminishing Returns?
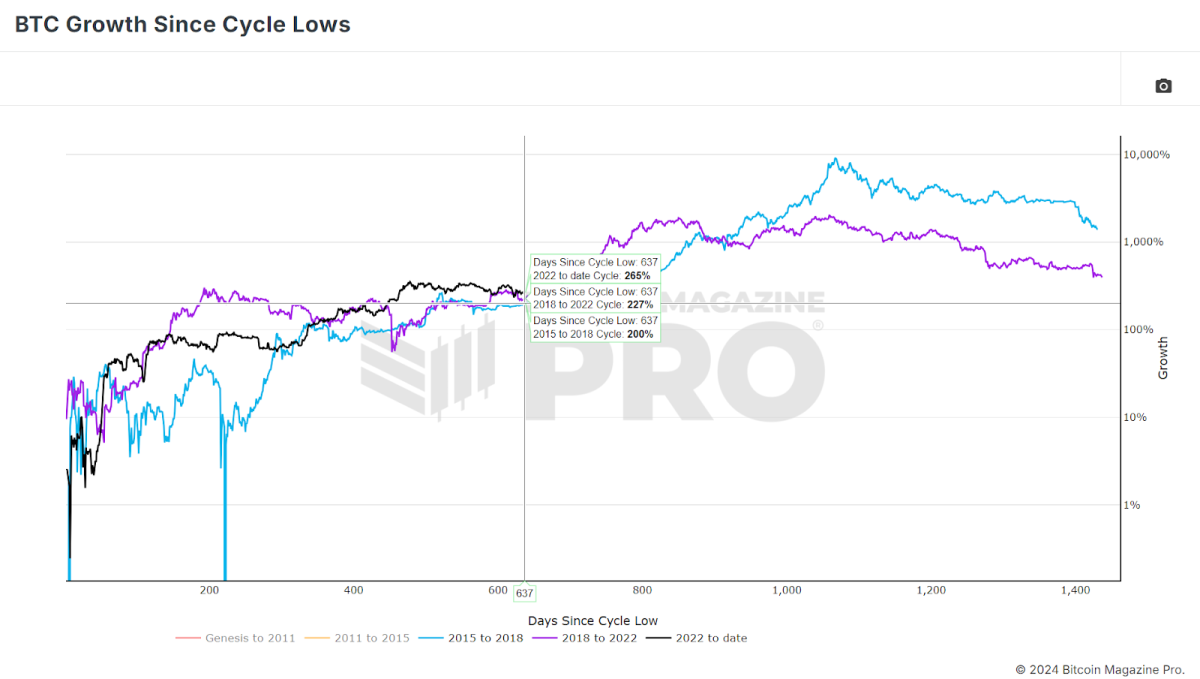
There’s a theory that each Bitcoin cycle has diminishing returns, with lower percentage gains than the previous cycle. If we compare the current cycle to previous ones, it’s clear that Bitcoin has already outperformed both the 2015-2018 and 2018-2022 cycles regarding percentage gains. This outperformance might suggest that Bitcoin has gotten ahead of itself, necessitating a cooling-off period.
However, it’s also important to remember that this cooling-off period doesn’t mean the end of the bull market. Historically, Bitcoin has experienced similar pauses before resuming its upward trajectory. Thus, while we might see more sideways or even downward price action in the short term, this doesn’t necessarily indicate that the bull market is over.
The Hash Ribbons Buy Signal
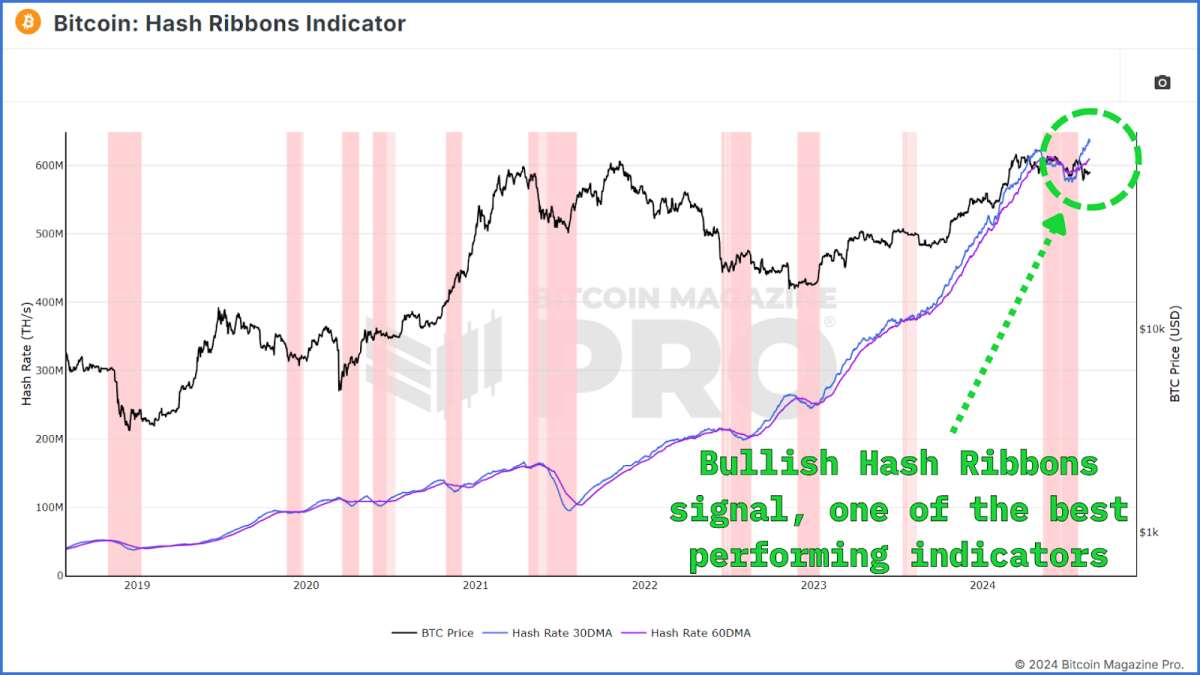
One of the most promising indicators for Bitcoin’s future price action is the Hash Ribbons Buy Signal. This signal occurs when the 30-day moving average of Bitcoin’s hash rate crosses above the 60-day moving average, indicating that miners are recovering after a period of capitulation. The Hash Ribbons Buy Signal has historically been a reliable indicator of bullish price action in the months that follow.
Recently, Bitcoin has shown this buy signal for the first time since the halving event earlier this year, suggesting that Bitcoin could see positive price action in the coming weeks and months.
Conclusion
In summary, while there are signs of weakness in the Bitcoin market, such as the dip in the MVRV Z-Score and the STH Realized Price, these metrics have shown similar behavior in previous bull cycles without signaling the end of the market. The lack of widespread capitulation, as indicated by the SOPR and the recent Hash Ribbons Buy Signal, provides further confidence that the bull cycle is still intact.
For a more in-depth look into this topic, check out a recent YouTube video here:
Source link
You may like


Legacy Media’s Transformation: Why Evolution Beats Extinction


Massive Ethereum Buying Spree – Taker Buy Volume hits $1.683B In One Hour


Ethereum lags behind Bitcoin but is expected to reach $14K, boosting RCOF to new high


Bitcoin Miner MARA Buys Another 5771 BTC As Price Nears $100k


Jason "Spaceboi" Lowery's Bitcoin "Thesis" Is Incoherent Gibberish


Bankrupt Crypto Exchange FTX Set To Begin Paying Creditors and Customers in Early 2025, Says CEO
24/7 Cryptocurrency News
How Will BTC React to $3B Buying Spree?
Published
2 days agoon
November 21, 2024By
admin
Bitcoin (BTC) price today trades at $97,606.0 as of 10 AM. BTC price hit a daily high of $97,837.0 today after rallying 4.41% on November 21.
Why Is Bitcoin Price Up Today?
Bitcoin price today is up 4.41% today and currently auctions around $97,606.0. Since the breakout from the seven-month consolidation and the $75k hurdle, the crypto market outlook has turned bullish. While a few altcoins shoot higher, the alt season is yet to begin.


*bitcoin price updated as of 10 AM.
Price of BTC trades at $97,606.0, bringing the year-to-date gain from 56% on October 20 to 108% as of November 18. Although many altcoins have shot up over triple digits, Bitcoin is catching up. Ethereum price’s YTD performance is lackluster, stands at 39%, and is well below BTC.
Although Bitcoin is the largest cryptocurrency by market capitalization, Bitcoin’s popularity is due to its first-mover advantage and its being a secure, decentralized network. In addition, many narratives, like digital gold, inflation hedges, and uncorrelated assets, have kept BTC at the forefront of the crypto market since its inception in 2009.
Bitcoin Price Eyes Bullish End to 2024
Industry veterans’ speculation of a bull run post-US elections was right, and Bitcoin is likely to end November 2024 on a positive note. Many even expect a six-digit target for BTC by the end of November, and this is due to the historical returns. History shows that Bitcoin has always performed massively in the fourth quarter.


With that said, if Bitcoin price hits a new ATH in November or December, Bitcoin’s market capitalization, which stands at $1,931.5 billion could push toward the $2 trillion mark.
Bitcoin: The Largest Cryptocurrency


While Bitcoin’s market cap hovers around $1,931.5 billion, with Ethereum, the duo controls nearly 65% of the total cryptocurrency market capitalization, which is $2.40 trillion. Despite the seven-month consolidation, Bitcoin’s $1.3 trillion market cap remains strong, anticipating it reaching $2 trillion in 2025.
BTC’s 24-hour Trading Volume
Being the top crypto has its benefits; more people tend to flock toward the asset. Likewise, BTC’s 24-hour trading volume stands at $99.0 billion. Binance, one of the largest cryptocurrency exchanges, contributes a major portion of this volume. Binance’s share of BTC’s 24-hour trading volume comprises spot and perpetuals trading. While spot volume hovers around 11%, perpetual volume is 41%. Exchanges like OKX, Bitget, etc, follow Binance.
Bitcoin Blockchain Upgrades
With a market cap of $1.3 trillion, it is necessary for the network to remain secure, decentralized, and scalable. This is possible by upgrading the Bitcoin network regularly.
Here are some notable upgrades the Bitcoin network has received or planned to receive since its inception in 2009.
Bitcoin Network Upgrades Since 2009
Here are some key milestone upgrades to the Bitcoin network over the past decade.
2017-2019
2015-2016
2013-2014
2010-2012
2009-2010
Bitcoin Price Forecast For Next Month
| Date | Price | Change |
|---|---|---|
| November 21, 2024 | $94,679 | 0.29% |
| November 22, 2024 | $99,364 | 5.25% |
| November 23, 2024 | $100,935 | 6.91% |
| November 24, 2024 | $101,744 | 7.77% |
| November 25, 2024 | $102,639 | 8.72% |
Based on Coingape’s Bitcoin price prediction, investors can expect a double-digit rally that leads to a peak of $104,725 as of November 26, leading to a correction. In a month from now, the largest crypto by market cap could be exchanging hands at around $100k.
Bitcoin Price Forecast Between 2025 and 2029
| January | $100,873.53 | $99,727.36 | $100,300.45 | 61.3% |
| February | $100,812.06 | $99,696.19 | $100,254.13 | 61.3% |
| March | $100,750.58 | $99,665.02 | $100,207.81 | 61.2% |
| April | $100,689.11 | $99,633.85 | $100,161.49 | 61.1% |
| May | $100,627.64 | $99,602.68 | $100,115.17 | 61% |
| June | $100,566.17 | $99,571.52 | $100,068.85 | 61% |
| July | $100,504.69 | $99,540.35 | $100,022.52 | 60.9% |
| August | $100,443.22 | $99,509.18 | $99,976.20 | 60.8% |
| September | $100,381.75 | $99,478.01 | $99,929.88 | 60.7% |
| October | $100,320.28 | $99,446.84 | $99,883.56 | 60.7% |
| November | $100,258.80 | $99,415.67 | $99,837.24 | 60.6% |
| December | $100,197.33 | $99,384.50 | $99,790.92 | 60.5% |
| All Time | $100,535.43 | $99,555.93 | $100,045.68 | 60.9% |
| January | $103,010.64 | $102,667.46 | $105,097.01 | 69% |
| February | $105,823.94 | $105,950.42 | $110,403.10 | 77.6% |
| March | $108,637.25 | $109,233.38 | $115,709.19 | 86.1% |
| April | $111,450.55 | $112,516.33 | $121,015.28 | 94.6% |
| May | $114,263.86 | $115,799.29 | $126,321.37 | 103.2% |
| June | $117,077.17 | $119,082.25 | $131,627.46 | 111.7% |
| July | $119,890.47 | $122,365.21 | $136,933.55 | 120.2% |
| August | $122,703.78 | $125,648.17 | $142,239.64 | 128.8% |
| September | $125,517.08 | $128,931.13 | $147,545.73 | 137.3% |
| October | $128,330.39 | $132,214.08 | $152,851.82 | 145.9% |
| November | $131,143.69 | $135,497.04 | $158,157.91 | 154.4% |
| December | $133,957 | $138,780 | $163,464 | 162.9% |
| All Time | $118,483.82 | $120,723.73 | $134,280.51 | 116% |
| January | $139,801.17 | $144,684.75 | $169,276.92 | 172.3% |
| February | $145,645.33 | $150,589.50 | $175,089.83 | 181.6% |
| March | $151,489.50 | $156,494.25 | $180,902.75 | 191% |
| April | $157,333.67 | $162,399 | $186,715.67 | 200.3% |
| May | $163,177.83 | $168,303.75 | $192,528.58 | 209.7% |
| June | $169,022 | $174,208.50 | $198,341.50 | 219% |
| July | $174,866.17 | $180,113.25 | $204,154.42 | 228.4% |
| August | $180,710.33 | $186,018 | $209,967.33 | 237.7% |
| September | $186,554.50 | $191,922.75 | $215,780.25 | 247.1% |
| October | $192,398.67 | $197,827.50 | $221,593.17 | 256.4% |
| November | $198,242.83 | $203,732.25 | $227,406.08 | 265.8% |
| December | $204,087 | $209,637 | $233,219 | 275.1% |
| All Time | $171,944.08 | $177,160.88 | $201,247.96 | 223.7% |
| January | $212,511.67 | $218,298 | $243,655 | 291.9% |
| February | $220,936.33 | $226,959 | $254,091 | 308.7% |
| March | $229,361 | $235,620 | $264,527 | 325.5% |
| April | $237,785.67 | $244,281 | $274,963 | 342.3% |
| May | $246,210.33 | $252,942 | $285,399 | 359% |
| June | $254,635 | $261,603 | $295,835 | 375.8% |
| July | $263,059.67 | $270,264 | $306,271 | 392.6% |
| August | $271,484.33 | $278,925 | $316,707 | 409.4% |
| September | $279,909 | $287,586 | $327,143 | 426.2% |
| October | $288,333.67 | $296,247 | $337,579 | 443% |
| November | $296,758.33 | $304,908 | $348,015 | 459.8% |
| December | $305,183 | $313,569 | $358,451 | 476.5% |
| All Time | $258,847.33 | $265,933.50 | $301,053 | 384.2% |
| January | $317,150.58 | $326,144.33 | $372,391.92 | 499% |
| February | $329,118.17 | $338,719.67 | $386,332.83 | 521.4% |
| March | $341,085.75 | $351,295 | $400,273.75 | 543.8% |
| April | $353,053.33 | $363,870.33 | $414,214.67 | 566.2% |
| May | $365,020.92 | $376,445.67 | $428,155.58 | 588.7% |
| June | $376,988.50 | $389,021 | $442,096.50 | 611.1% |
| July | $388,956.08 | $401,596.33 | $456,037.42 | 633.5% |
| August | $400,923.67 | $414,171.67 | $469,978.33 | 655.9% |
| September | $412,891.25 | $426,747 | $483,919.25 | 678.4% |
| October | $424,858.83 | $439,322.33 | $497,860.17 | 700.8% |
| November | $436,826.42 | $451,897.67 | $511,801.08 | 723.2% |
| December | $448,794 | $464,473 | $525,742 | 745.6% |
| All Time | $382,972.29 | $395,308.67 | $449,066.96 | 622.3% |
By 2025, Bitcoin price could hit the six-digit territory, and expect a massive bull run to kickstart in the years leading up to 2029. Coingape’s Bitcoin price prediction notes that BTC could trade between $82,213.41 and $660,471.83 by 2029.
Bitcoin Price Outlook between 2030 and 2050
2030
2031
2032
2033
2040
2050
| January | $465,154.42 | $481,462.17 | $546,469.67 | 779% |
| February | $481,514.83 | $498,451.33 | $567,197.33 | 812.3% |
| March | $497,875.25 | $515,440.50 | $587,925 | 845.6% |
| April | $514,235.67 | $532,429.67 | $608,652.67 | 879% |
| May | $530,596.08 | $549,418.83 | $629,380.33 | 912.3% |
| June | $546,956.50 | $566,408 | $650,108 | 945.7% |
| July | $563,316.92 | $583,397.17 | $670,835.67 | 979% |
| August | $579,677.33 | $600,386.33 | $691,563.33 | 1012.3% |
| September | $596,037.75 | $617,375.50 | $712,291 | 1045.7% |
| October | $612,398.17 | $634,364.67 | $733,018.67 | 1079% |
| November | $628,758.58 | $651,353.83 | $753,746.33 | 1112.4% |
| December | $645,119 | $668,343 | $774,474 | 1145.7% |
| All Time | $555,136.71 | $574,902.58 | $660,471.83 | 962.3% |
| January | $667,167.08 | $691,240.58 | $802,526.58 | 1190.8% |
| February | $689,215.17 | $714,138.17 | $830,579.17 | 1235.9% |
| March | $711,263.25 | $737,035.75 | $858,631.75 | 1281.1% |
| April | $733,311.33 | $759,933.33 | $886,684.33 | 1326.2% |
| May | $755,359.42 | $782,830.92 | $914,736.92 | 1371.3% |
| June | $777,407.50 | $805,728.50 | $942,789.50 | 1416.4% |
| July | $799,455.58 | $828,626.08 | $970,842.08 | 1461.5% |
| August | $821,503.67 | $851,523.67 | $998,894.67 | 1506.7% |
| September | $843,551.75 | $874,421.25 | $1,026,947.25 | 1551.8% |
| October | $865,599.83 | $897,318.83 | $1,054,999.83 | 1596.9% |
| November | $887,647.92 | $920,216.42 | $1,083,052.42 | 1642% |
| December | $909,696 | $943,114 | $1,111,105 | 1687.1% |
| All Time | $788,431.54 | $817,177.29 | $956,815.79 | 1439% |
| January | $946,061.92 | $979,838.83 | $1,150,786.08 | 1751% |
| February | $982,427.83 | $1,016,563.67 | $1,190,467.17 | 1814.8% |
| March | $1,018,793.75 | $1,053,288.50 | $1,230,148.25 | 1878.6% |
| April | $1,055,159.67 | $1,090,013.33 | $1,269,829.33 | 1942.4% |
| May | $1,091,525.58 | $1,126,738.17 | $1,309,510.42 | 2006.3% |
| June | $1,127,891.50 | $1,163,463 | $1,349,191.50 | 2070.1% |
| July | $1,164,257.42 | $1,200,187.83 | $1,388,872.58 | 2133.9% |
| August | $1,200,623.33 | $1,236,912.67 | $1,428,553.67 | 2197.7% |
| September | $1,236,989.25 | $1,273,637.50 | $1,468,234.75 | 2261.6% |
| October | $1,273,355.17 | $1,310,362.33 | $1,507,915.83 | 2325.4% |
| November | $1,309,721.08 | $1,347,087.17 | $1,547,596.92 | 2389.2% |
| December | $1,346,087 | $1,383,812 | $1,587,278 | 2453% |
| All Time | $1,146,074.46 | $1,181,825.42 | $1,369,032.04 | 2102% |
| January | $1,387,378.67 | $1,426,572.58 | $1,647,465.92 | 2549.9% |
| February | $1,428,670.33 | $1,469,333.17 | $1,707,653.83 | 2646.7% |
| March | $1,469,962 | $1,512,093.75 | $1,767,841.75 | 2743.5% |
| April | $1,511,253.67 | $1,554,854.33 | $1,828,029.67 | 2840.3% |
| May | $1,552,545.33 | $1,597,614.92 | $1,888,217.58 | 2937.1% |
| June | $1,593,837 | $1,640,375.50 | $1,948,405.50 | 3033.9% |
| July | $1,635,128.67 | $1,683,136.08 | $2,008,593.42 | 3130.7% |
| August | $1,676,420.33 | $1,725,896.67 | $2,068,781.33 | 3227.5% |
| September | $1,717,712 | $1,768,657.25 | $2,128,969.25 | 3324.3% |
| October | $1,759,003.67 | $1,811,417.83 | $2,189,157.17 | 3421.1% |
| November | $1,800,295.33 | $1,854,178.42 | $2,249,345.08 | 3517.9% |
| December | $1,841,587 | $1,896,939 | $2,309,533 | 3614.7% |
| All Time | $1,614,482.83 | $1,661,755.79 | $1,978,499.46 | 3082.3% |
| January | $1,912,592.58 | $1,975,978.17 | $2,362,093.25 | 3699.3% |
| February | $1,983,598.17 | $2,055,017.33 | $2,414,653.50 | 3783.8% |
| March | $2,054,603.75 | $2,134,056.50 | $2,467,213.75 | 3868.4% |
| April | $2,125,609.33 | $2,213,095.67 | $2,519,774 | 3952.9% |
| May | $2,196,614.92 | $2,292,134.83 | $2,572,334.25 | 4037.4% |
| June | $2,267,620.50 | $2,371,174 | $2,624,894.50 | 4122% |
| July | $2,338,626.08 | $2,450,213.17 | $2,677,454.75 | 4206.5% |
| August | $2,409,631.67 | $2,529,252.33 | $2,730,015 | 4291.1% |
| September | $2,480,637.25 | $2,608,291.50 | $2,782,575.25 | 4375.6% |
| October | $2,551,642.83 | $2,687,330.67 | $2,835,135.50 | 4460.1% |
| November | $2,622,648.42 | $2,766,369.83 | $2,887,695.75 | 4544.7% |
| December | $2,693,654 | $2,845,409 | $2,940,256 | 4629.2% |
| All Time | $2,303,123.29 | $2,410,693.58 | $2,651,174.63 | 4164.3% |
| January | $2,753,723.75 | $2,916,544.25 | $3,019,295.17 | 4756.4% |
| February | $2,813,793.50 | $2,987,679.50 | $3,098,334.33 | 4883.5% |
| March | $2,873,863.25 | $3,058,814.75 | $3,177,373.50 | 5010.6% |
| April | $2,933,933 | $3,129,950 | $3,256,412.67 | 5137.7% |
| May | $2,994,002.75 | $3,201,085.25 | $3,335,451.83 | 5264.9% |
| June | $3,054,072.50 | $3,272,220.50 | $3,414,491 | 5392% |
| July | $3,114,142.25 | $3,343,355.75 | $3,493,530.17 | 5519.1% |
| August | $3,174,212 | $3,414,491 | $3,572,569.33 | 5646.3% |
| September | $3,234,281.75 | $3,485,626.25 | $3,651,608.50 | 5773.4% |
| October | $3,294,351.50 | $3,556,761.50 | $3,730,647.67 | 5900.5% |
| November | $3,354,421.25 | $3,627,896.75 | $3,809,686.83 | 6027.7% |
| December | $3,414,491 | $3,699,032 | $3,888,726 | 6154.8% |
| All Time | $3,084,107.38 | $3,307,788.13 | $3,454,010.58 | 5455.6% |
The bullish explosive trend noted up to 2029 will continue for BTC based on CoinGape predictions and potentially push the average price of BTC in 2050 between $2.9 million and $3.3 million. Investors should note that these long-term predictions can change and, hence, should be taken with a grain of salt.
How Will Bitcoin Price React to $3 Billion Buying Spree?
Michael Saylor, the CEO and founder of MicroStrategy, has increased the size of its convertible note from $1.75 billion to $2.6 billion. This suggests that the company will continue its BTC buying spree.
According to the announcement, the offering will close today, November 21, and is aimed at high-net-worth investors with a maturity of 2029. The blog also added,
“The notes will be sold in a private offering only to persons reasonably believed to be qualified institutional buyers.”
Investors need to note that the latest offerings has not finished yet, as MicroStrategy announces the new offering.
On a side note, here’s Michael Saylor’s tweet from two days ago.
MicroStrategy has acquired 51,780 BTC for ~$4.6 billion at ~$88,627 per #bitcoin and has achieved BTC Yield of 20.4% QTD and 41.8% YTD. As of 11/17/2024, we hodl 331,200 $BTC acquired for ~$16.5 billion at ~$49,874 per bitcoin. $MSTR https://t.co/SRRtRrB2jO
— Michael Saylor⚡️ (@saylor) November 18, 2024
Although this is fundamentally bullish for Bitcoin, the implication of this might not be felt in the short term. The lack of influence on BTC’s value can be attributed to over-the-counter (OTC) deals. Institutions or high-net-worth individuals use methods to conceal their buys in the short term and do not affect the market price of the underlying asset.
Regardless, the outlook is bullish, and the momentum is strong, so it wouldn’t be surprising if Bitcoin hits $100,000 before November ends.
Source link
Bitcoin
The Case For A Future Valuation Of $1 Million
Published
3 days agoon
November 20, 2024By
admin
Since November 5, the day President-elect Donald Trump secured another term in office, Bitcoin has experienced a remarkable uptrend, reaching a new all-time high of $93,300.
Since then, BTC has been trading within a narrow range between $89,000 and $92,000, positioning for a potential move toward the $100,000 milestone. This raises an intriguing question whether a price of $1 million per coin is feasible over the next decade.
A Long-Term Vision For Investors
Market expert VirtualBacon has conducted an in-depth analysis of these possibilities, delving into the numbers, trends, and catalysts that could propel Bitcoin to experience a surge of nearly 1,000% from its current price levels.
Within the current market cycle, the expert forecasts that Bitcoin could hit $200,000 in the next one to two years. However, he notes that while this milestone is significant, altcoins may offer higher returns at a greater risk, often crashing by 80% to 90% in bear markets.
In contrast to altcoins, which face increasing regulatory scrutiny, Bitcoin stands out as a safer long-term investment. VirtualBacon argues that Bitcoin’s potential is not just confined to the next few years but spans a decade or more.
Related Reading
To understand why Bitcoin’s price could reach $1 million, VirtualBacon asserts that investors need to consider its fundamental utility as a store of value. Bitcoin’s fixed supply of 21 million coins, its global accessibility, and its resistance to censorship and manipulation make it a compelling alternative to traditional financial assets.
The expert suggests that if Bitcoin is to become recognized as the digital gold of the 21st century, reaching a market capitalization that rivals gold’s estimated $13 trillion is not merely a theoretical possibility but “a logical outcome.”
Key drivers for this potential growth include increasing participation from asset managers, corporate treasuries, central banks, and wealthy individuals. Recent data indicates that Bitcoin ETFs have seen record inflows, with $1 billion invested last week, reflecting growing institutional confidence.
Additionally, discussions among corporations, such as Microsoft considering Bitcoin reserves, further enhance its strategic value. Wealthy individuals are also beginning to adopt Bitcoin as a standard portfolio allocation, with even a modest 1% investment becoming commonplace among billionaires.
What Does Bitcoin Need To Reach $1 Million?
For Bitcoin to reach the $1 million mark, two critical factors must be analyzed: global wealth growth and portfolio allocation. VirtualBacon notes that in 2022, total global wealth was estimated at $454 trillion, and projections suggest this could grow to $750 trillion by 2034.
Currently, gold holds approximately 3.9% of global wealth, while Bitcoin is at a mere 0.35%. If Bitcoin’s allocation in global portfolios rose to just 3%, still significantly below gold’s share, its market cap could soar to $20 trillion, pushing the price to $1 million per coin.
Historically, gold’s market cap saw significant growth following the launch of exchange-traded funds in 2004, with its portfolio allocation increasing from 1.67% to 4.74% over the next decade.
Related Reading
If Bitcoin follows a similar trajectory, its allocation could rise from 0.35% to 1.05% or more, translating to a market cap of approximately $7.92 trillion, equating to about $395,000 per Bitcoin. Therefore, reaching $1 million doesn’t require Bitcoin to surpass gold; it must capture about 57% of gold’s projected market cap by 2034.
With gold representing 4.7% of global portfolios compared to Bitcoin’s 0.35%, a modest increase in Bitcoin’s share of global wealth to 3%—just 60% of gold’s allocation—could “easily” result in a $20 trillion market cap and a $1 million price point.
At the time of writing, BTC is trading at $92,240, up 7% every week.
Featured image from DALL-E, chart from TradingView.com
Source link
$100k
Why $100,000 Bitcoin Is Right Around The Corner
Published
4 days agoon
November 19, 2024By
admin


If you have been following Bitcoin news today, like I have, you can not be more bullish on Bitcoin. Seriously, what a time to be alive!
Just today:
- MicroStrategy purchased another 51,780 BTC for $4.6 billion and announced its plans to raise $1.75 billion to buy more bitcoin
- Semler Scientific bought another 215 BTC for $17.7 million
- Genius Group launched its Bitcoin treasury by purchasing 110 BTC for $10 million
- MARA Holdings announced a $700 million raise to buy more BTC
- Metaplanet issued ¥1.75B debt offering to buy more BTC
- Global healthcare group Cosmos Health adopted BTC as a treasury reserve asset
Insane, right?
The corporate Bitcoin adoption is going absolutely parabolic. The race among public companies to stack the most satoshis has kicked into hyperdrive.
Some other news:
- Donald Trump is meeting with Coinbase CEO Brian Armstrong and is expected to discuss appointments
- Donald Trump’s media $DJT in talks to purchase crypto trading platform Bakkt
- Options trading on BlackRock’s spot Bitcoin ETF could be listed as soon as tomorrow
It’s only Monday, and my head is already spinning! With this tidal wave of positive adoption, I’d be downright shocked if we don’t blast through $100,000 per Bitcoin this week.
I expect a flood of more bullish news and serious FOMO buying pressure this week. Seriously, tighten your seatbelts, folks—with this momentum, Bitcoin hitting a hundred grand is coming sooner than you imagined!
This article is a Take. Opinions expressed are entirely the author’s and do not necessarily reflect those of BTC Inc or Bitcoin Magazine.
Source link

Legacy Media’s Transformation: Why Evolution Beats Extinction

Massive Ethereum Buying Spree – Taker Buy Volume hits $1.683B In One Hour

Ethereum lags behind Bitcoin but is expected to reach $14K, boosting RCOF to new high

Bitcoin Miner MARA Buys Another 5771 BTC As Price Nears $100k

Jason "Spaceboi" Lowery's Bitcoin "Thesis" Is Incoherent Gibberish

Bankrupt Crypto Exchange FTX Set To Begin Paying Creditors and Customers in Early 2025, Says CEO

Top crypto traders’ picks for explosive growth by 2025

3 Tokens Ready to 100x After XRP ETF Gets Approval

Gary Gensler’s Departure Is No Triumph For Bitcoin

Magic Eden Token Airdrop Date Set as Pre-Market Value Hits $562 Million

Blockchain Association urges Trump to prioritize crypto during first 100 days

Pi Network Coin Price Surges As Key Deadline Nears

How Viable Are BitVM Based Pegs?

UK Government to Draft a Regulatory Framework for Crypto, Stablecoins, Staking in Early 2025

Bitcoin Cash eyes 18% rally
182267361726451435

Top Crypto News Headlines of The Week

Why Did Trump Change His Mind on Bitcoin?

New U.S. president must bring clarity to crypto regulation, analyst says

Ethereum, Solana touch key levels as Bitcoin spikes

Will XRP Price Defend $0.5 Support If SEC Decides to Appeal?

Bitcoin Open-Source Development Takes The Stage In Nashville

Bitcoin 20% Surge In 3 Weeks Teases Record-Breaking Potential

Ethereum Crash A Buying Opportunity? This Whale Thinks So

Shiba Inu Price Slips 4% as 3500% Burn Rate Surge Fails to Halt Correction

‘Hamster Kombat’ Airdrop Delayed as Pre-Market Trading for Telegram Game Expands

Washington financial watchdog warns of scam involving fake crypto ‘professors’

Citigroup Executive Steps Down To Explore Crypto
Mostbet Güvenilir Mi – Casino Bonus 2024

Bitcoin flashes indicator that often precedes higher prices: CryptoQuant
Trending

 2 months ago
182267361726451435

 24/7 Cryptocurrency News3 months ago
Top Crypto News Headlines of The Week

 Donald Trump4 months ago
Why Did Trump Change His Mind on Bitcoin?

 News3 months ago
New U.S. president must bring clarity to crypto regulation, analyst says

 Bitcoin4 months ago
Ethereum, Solana touch key levels as Bitcoin spikes

 Price analysis3 months ago
Will XRP Price Defend $0.5 Support If SEC Decides to Appeal?

 Opinion4 months ago
Bitcoin Open-Source Development Takes The Stage In Nashville

 Bitcoin4 months ago
Bitcoin 20% Surge In 3 Weeks Teases Record-Breaking Potential


