
bear market
Ethereum Foundation Transfers 95 Million ETH, Price Rally To Stall?


Cryptocurrencies attempted to shrug off geopolitical conflict-driven market slump ahead of October’s first weekend.
Major cryptocurrencies and the total digital asset market cap jumped north of 2% on Oct. 4 as ecosystem leaders like Bitcoin (BTC) and Ethereum (ETH) staged price recoveries by publishing time. Almost $36 billion flowed into Bitcoin, pushing BTC’s price above $62,300 and marking a 3% jump. Ether’s 4% appreciation raised ETH to over $2,400, and Solana (SOL) edged toward $145, per CoinGecko.
Memecoins, especially on Solana, surged with the market upswing heading into the weekend. Tokens like Gigachad (CHAD), Michi (MICHI), Popcat (POPCAT), and dogwifhat (WIF) spiked 20%-40% in the last 24 hours.
Weekly green close uncertain for crypto
Daily price upticks only slightly reversed the plunge triggered by military altercations in the Middle East. Global economies and assets shed hundreds of millions in hours as Iran launched missiles into Israel.
The resulting pullback fixed the total cryptocurrency market cap in a red candle on the weekly timeframe. Digital assets had cumulatively closed in green for three consecutive weeks during September, a month usually bearish for cryptos.
History backs green Q4
The overall digital asset market would require an 8% recovery to regain last month’s close, and expert consensus suggested a crypto market rise might be inbound. Bitcoin has enjoyed a bullish October the last three times BTC closed September with a green monthly candle. Nine out of 11 times, the asset has surged in Q3’s first month regardless of the previous month’s price action.
Indeed, Bitcoin has averaged price increases of 22%, 46%, and 5% in the final three months of every year since 2013.

Source link
Why are markets staying calm while the Middle East is on fire? Is Bitcoin really immune to geopolitical chaos, or are we missing something bigger here?
Missiles fly, Bitcoin steady
A year ago, Israeli Prime Minister Benjamin Netanyahu stood confidently at the UN General Assembly, celebrating what appeared to be growing peace in the Middle East. However, today, the landscape looks drastically different.
The ongoing war in Gaza is nearing its one-year mark, but the conflict has expanded beyond the region. With Iran now involved, tensions between Israel and Hezbollah have sharply escalated, raising fears of a broader regional war.
A major turning point occurred on Sep. 27, when Hezbollah’s leader, Hassan Nasrallah, was reportedly killed in an Israeli airstrike. Nasrallah suffocated after being trapped in his secret bunker, which had been hit by 80 tons of bunker-busting bombs.
The same strike also killed IRGC commander Abbas Nilforoshan in Beirut, dealing a serious blow to Iran-backed militias in the region.
These deaths significantly increased tensions, prompting Iran to retaliate just days later. On Oct. 1, Iran launched a large-scale missile attack on Israel, firing approximately 180 missiles — an escalation even more intense than the April barrage.
While many of the missiles were intercepted by Israeli defences, some found their targets, hitting military bases, restaurants, and schools. Iran’s Islamic Revolutionary Guard Corps claimed a 90% success rate for their strikes, which included the use of hypersonic missiles.
Amid these escalating hostilities, one might expect markets to react as they have in the past. Yet, the recent dynamics tell a different story.
The assassination of Hamas leader Ismail Haniyeh in July sent shockwaves through both traditional markets and the cryptocurrency space, with Bitcoin (BTC) tumbling in response.
However, despite the heightened tension after Nasrallah’s death and Iran’s missile attacks, the crypto markets — particularly Bitcoin — have defied the usual pattern of panic selling during the conflict.
So, why did the markets react so sharply in April and August but seem resilient to this latest flare-up? Let’s dive deeper into what has changed and what this could mean going forward.
From August’s sell-off to September’s rally
On Jul. 31, the Middle East’s political arena shifted dramatically when Haniyeh, the prominent Hamas leader, was assassinated in Tehran.
Haniyeh had been a major figure in Hamas since its early days in 1987. He’d even served as the prime minister of the Palestinian Authority and was the highest-ranking Hamas leader to be killed since the Israel-Hamas war began. His death struck a heavy blow to the Palestinian militant group and sent tensions soaring across the region.
As the news hit, markets reacted instantly. Bitcoin, which had been sitting at around $66,500, took a sharp nosedive, losing almost 10% of its value in just a few days. By Aug. 4, it had dropped to $60,500.
Global stock markets didn’t fare much better. Between Jul. 31 and Aug. 4, the NASDAQ tumbled from 17,600 to 16,200 points—a brutal 8% decline. The S&P 500 followed suit, dropping from 5,500 to 5,150—around 6.5%.
Investors were rattled. The markets, already shaky from macroeconomic pressures, spiralled further, and crypto assets started behaving just like high-risk tech stocks.
And the timing couldn’t have been worse. While this geopolitical shock unfolded, the global economy was facing worsening recession fears. Add to that the unwinding yen carry trade and murmurs of stagflation, and things looked pretty grim.
Then came Aug. 5, now known as “Crypto Black Monday.” Major crypto assets took another beating. Bitcoin plunged to $53,000, a staggering 20% drop from its highs in late July.

Ethereum (ETH) and Solana (SOL) were caught in the same downward spiral, with steep losses. Investors were scrambling, worried that a full-scale Middle Eastern war was about to erupt, only deepening those recession fears.
Fast forward to September 2024, and the conflict has escalated again. Hezbollah, Lebanon’s powerful Iran-backed armed group, ramped up its attacks on Israel.
On Sep. 20, Hezbollah launched a barrage of rockets into northern Israel, targeting cities such as Haifa, escalating tensions in the region.
In response, Israel retaliated with hundreds of airstrikes on Hezbollah positions in Lebanon, marking the deadliest exchange between the two since the 2006 Israel-Hezbollah war. The airstrikes resulted in over 490 Lebanese casualties, significantly heightening the conflict.
Then, on Oct. 1, Iran further escalated the situation by launching a large-scale missile attack on Israel, pushing the region closer to a broader confrontation.
Despite the severity of the escalating conflict, the crypto markets have responded differently this time. Rather than experiencing a stark downturn, Bitcoin has remained relatively stable, dropping only a few percentage points.
As of Oct. 2, BTC is trading around $61,800, reflecting a decline of about 3% in the past 24 hours but still holding above the critical $60,000 support level. Meanwhile, Ethereum has seen a steeper drop, declining by over 6% and trading at around $2,480.
Liquidity and central bank policies shield crypto
One key difference between the two periods is the broader macroeconomic environment. Back in August, global markets were still grappling with a storm of negative data.
Back then, China’s post-pandemic recovery was stalling, and the U.S. Federal Reserve had shown no signs of easing up on its tight monetary policy. Liquidity was drying up across the board.
Then came a surprise in August — the Bank of Japan (BoJ) raised interest rates for the first time since 2007. This decision sent shockwaves through global markets.
Why? Many investors had been taking advantage of Japan’s ultra-low interest rates by borrowing cheap yen and investing those funds into higher-yielding assets, a strategy known as the ‘yen carry trade.’ But when the BoJ hiked rates, the cost of borrowing yen increased, forcing investors to unwind those positions.
As a result, they quickly exited riskier assets, including crypto, which caused prices to nosedive. Bitcoin, Ethereum, and other cryptocurrencies were caught in the selling frenzy as liquidity drained from the markets.
Fast forward to October, and the situation looks different. On Sep. 18, the Federal Reserve made a surprising move by cutting rates by 50 basis points, injecting much-needed liquidity back into the global financial system.
At the same time, China has been rolling out a series of economic stimulus measures to reignite its faltering growth.
Historically, crypto tends to perform well when there’s plenty of liquidity in the markets, and that’s exactly what we’re seeing now. Bitcoin’s recent surge, alongside Ethereum’s rise, is largely due to the Fed’s pivot toward a more accommodative monetary policy.
But liquidity isn’t the only factor at play. In recent weeks, fears of a global recession have eased. U.S. jobs data has come in stronger than expected, and although inflation is still a concern, it appears to be moderating.
All of this has helped ease worries about a hard landing for the U.S. economy, giving investors a bit more confidence to hold onto riskier assets like crypto.
Another major difference between August and October is how institutional investors view Bitcoin. Since the Fed’s announcement, Bitcoin has seen strong inflows into spot BTC ETFs, with only a few days of outflows.
The total assets under management of all spot BTC ETFs have surged, now standing at over $50 billion. So, during times of political turmoil, like the ongoing conflicts in the Middle East, Bitcoin actually attracts inflows rather than triggers panic selling.
However, it’s worth noting that the rally we’re seeing now doesn’t mean the underlying problems are solved.
China’s economy is still struggling to gain traction, and the U.S. is not out of the woods yet, with the possibility of a soft recession still looming. The Fed’s rate cut has provided some temporary relief, but deeper structural issues remain unresolved.
Why markets have stayed calm amid rising geopolitical tensions
As tensions between Israel and Hezbollah heat up, surprisingly, though, the markets remain calm, almost indifferent to the escalating conflict.
To better understand this unusual market reaction, crypto.news reached out to industry experts, whose insights reveal a shift in how investors are approaching geopolitical risks in 2024.
Anna Kuzmina, Founder of What the Money, believes this apparent indifference may stem from the overwhelming flood of global news. With constant coverage of conflicts and crises across the world, investors might see this particular situation as less impactful than others.
“The current Middle East conflict’s limited impact on crypto and stock markets, compared to previous incidents, could be due to the sheer volume of geopolitical news flooding the market. Investors might simply see this conflict as contained or are more focused on inflation and interest rates.”
Kuzmina also highlighted how investor behavior has evolved over time. In the past, geopolitical tensions often sparked sharp reactions in the markets, but today, both global and regional markets seem better equipped to absorb such disruptions without panicking.
Adding to the conversation, Daria Morgen, Head of Research at Changelly, brought in another perspective. She notes that crypto investors, having endured prolonged periods of volatility, approach geopolitical risks with a different mindset.
“Crypto investors assess geopolitical risk differently than stock market investors. They often have a higher tolerance for volatility, shaped by the recent bear market and wild price fluctuations.”
Morgen cited the continuous nature of crypto trading as a key factor. Unlike traditional financial markets, which have set trading hours, the 24/7 nature of crypto allows investors more flexibility to reassess their positions without rushing into panic-driven decisions.
“They’ve learned to hold through volatility, and this conflict, while serious, doesn’t seem to be a catalyst for panic—at least not yet.”
While crypto traders seem to embrace patience, Kuzmina points out that participants in traditional stock markets often take a more defensive stance, typically shifting their portfolios toward safer assets when geopolitical uncertainty arises.
Morgen shares a similar view, explaining that crypto’s decentralized nature also plays a role. It offers a certain level of protection from the shocks that usually jolt traditional financial systems.
“Crypto investors see digital assets as a hedge against traditional market instabilities. That decentralized nature keeps crypto somewhat insulated from global political issues.”
Morgen stresses that while geopolitical conflicts can still move the markets, the majority of investors are more focused on immediate economic concerns that directly impact their portfolios.
“Immediate economic concerns like inflation and interest rates are overshadowing these conflicts. Investors react more to global events when they have clear, direct economic consequences.”
Kuzmina agrees, noting that in today’s information-heavy environment, investors have become increasingly selective about which news events trigger market moves.
“Investors are bombarded with information daily. They’ve become more selective, tuning out the noise unless it directly impacts their bottom line.”
While crypto markets may seem more adaptable in today’s geopolitical environment, they still remain vulnerable to changes in regulatory policies, which could disrupt this newfound stability.
What to expect next?
The Middle East is still a tinderbox, and while markets have remained calm so far, that doesn’t guarantee smooth sailing ahead.
For now, the key takeaway is to stay alert. The calm we’re seeing might be a sign of a maturing market, but it’s also a reminder that things can change fast.
Keeping an eye on global events, central bank policies, and market sentiment will be crucial in the coming weeks and months.
Disclosure: This article does not represent investment advice. The content and materials featured on this page are for educational purposes only.
Source link
Altcoins
Opportunities Appearing for High-Quality Altcoins, According to Real Vision Analyst Jamie Coutts – Here’s Why

A closely followed crypto analyst believes that top altcoin projects could soon surge toward higher prices based on one key metric.
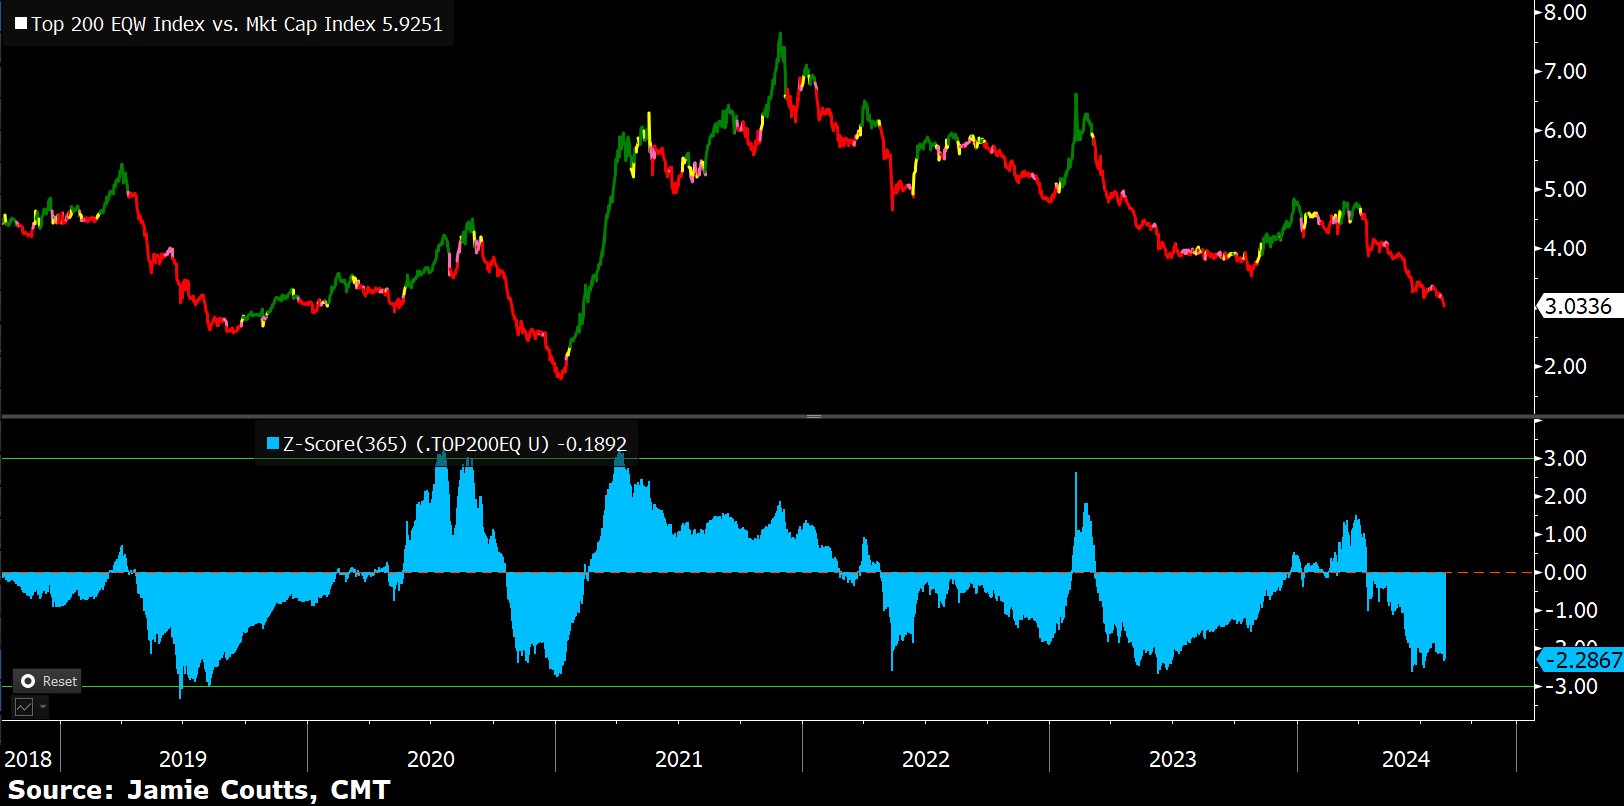
Jamie Coutts, the chief crypto analyst at Real Vision, says that “high quality” altcoins could be approaching a market bottom based on the top 200 equal weight index versus market cap ratio.
The top 200 equal weight index tracks the performance of the top 200 cryptocurrencies by market cap relative to Bitcoin (BTC).
He suggests that based on historical precedence, some alts may soon finish correcting and reverse course.
“My small-cap or alt-sentiment chart: the top 200 equal weight index versus market cap ratio chart (top) shows a continuation of the same theme from last month.
- Small cap underperformance is at extreme (blue sub-chart). Yes, opportunities for washed-out high-quality alts.
- While the ratio chart trend is down, until there is a reversal (turns green) an all-out ‘altseason’ is not possible.
- For now, small caps will struggle until BTC breaks the all-time high (still my base case for this year).”
The analyst also says that the broader altcoin market may not start to recover until late 2024 or early 2025 based on how many alts are underperforming against the top crypto asset.
“Another lens, my altseason indicator (number of assets outperforming BTC). Again, we are clearly at washed-out levels of negative alt sentiment with only 11% beating BTC in past 90 days.
Usually the bottoming process takes months to resolve before a recovery (expectation late Q4 or early 2025). My analysis points to this being akin to the 2020 pukes versus the end of cycle 2022 collapse.”

Don’t Miss a Beat – Subscribe to get email alerts delivered directly to your inbox
Check Price Action
Follow us on X, Facebook and Telegram
Surf The Daily Hodl Mix
 

Disclaimer: Opinions expressed at The Daily Hodl are not investment advice. Investors should do their due diligence before making any high-risk investments in Bitcoin, cryptocurrency or digital assets. Please be advised that your transfers and trades are at your own risk, and any losses you may incur are your responsibility. The Daily Hodl does not recommend the buying or selling of any cryptocurrencies or digital assets, nor is The Daily Hodl an investment advisor. Please note that The Daily Hodl participates in affiliate marketing.
Generated Image: Midjourney
Source link

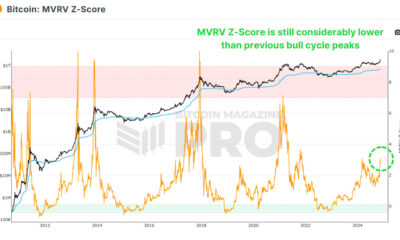
On-Chain Data Shows The Bitcoin Price Bull Run is Far From Over

Trump Picks Pro-Crypto Hedge Fund Manager Scott Bessent for Treasury Secretary

Crypto millionaires will be made by April 2025: 6 coins to hold

Cardano Price Hits $1 But Analyst Says This Is Just The Start

Legacy Media’s Transformation: Why Evolution Beats Extinction

Massive Ethereum Buying Spree – Taker Buy Volume hits $1.683B In One Hour

Ethereum lags behind Bitcoin but is expected to reach $14K, boosting RCOF to new high

Bitcoin Miner MARA Buys Another 5771 BTC As Price Nears $100k
Jason "Spaceboi" Lowery's Bitcoin "Thesis" Is Incoherent Gibberish

Bankrupt Crypto Exchange FTX Set To Begin Paying Creditors and Customers in Early 2025, Says CEO

Top crypto traders’ picks for explosive growth by 2025

3 Tokens Ready to 100x After XRP ETF Gets Approval
Gary Gensler’s Departure Is No Triumph For Bitcoin

Magic Eden Token Airdrop Date Set as Pre-Market Value Hits $562 Million

Blockchain Association urges Trump to prioritize crypto during first 100 days
182267361726451435

Top Crypto News Headlines of The Week
Why Did Trump Change His Mind on Bitcoin?

New U.S. president must bring clarity to crypto regulation, analyst says

Ethereum, Solana touch key levels as Bitcoin spikes

Will XRP Price Defend $0.5 Support If SEC Decides to Appeal?

Bitcoin Open-Source Development Takes The Stage In Nashville

Bitcoin 20% Surge In 3 Weeks Teases Record-Breaking Potential

Ethereum Crash A Buying Opportunity? This Whale Thinks So

Shiba Inu Price Slips 4% as 3500% Burn Rate Surge Fails to Halt Correction

‘Hamster Kombat’ Airdrop Delayed as Pre-Market Trading for Telegram Game Expands

Washington financial watchdog warns of scam involving fake crypto ‘professors’

Citigroup Executive Steps Down To Explore Crypto
Mostbet Güvenilir Mi – Casino Bonus 2024

Bitcoin flashes indicator that often precedes higher prices: CryptoQuant

 2 months ago
182267361726451435
 24/7 Cryptocurrency News3 months ago
Top Crypto News Headlines of The Week

 Donald Trump4 months ago
Why Did Trump Change His Mind on Bitcoin?
 News3 months ago
New U.S. president must bring clarity to crypto regulation, analyst says
 Bitcoin4 months ago
Ethereum, Solana touch key levels as Bitcoin spikes
 Price analysis3 months ago
Will XRP Price Defend $0.5 Support If SEC Decides to Appeal?
 Opinion4 months ago
Bitcoin Open-Source Development Takes The Stage In Nashville
 Bitcoin4 months ago
Bitcoin 20% Surge In 3 Weeks Teases Record-Breaking Potential
