Markets
Bitcoin Price Poised for a Weak September, Analysts Say
Published
3 months agoon
By
admin
Bitcoin may be heading for a challenging September, according to a new report, which points to seasonal trends, exhaustion signals, and macroeconomic factors as indicators of potential weakness for the world’s largest cryptocurrency in the coming month.
“We are entering a seasonally weak period in September for risk assets broadly. A correction usually impacts the most volatile assets the hardest, albeit temporarily,” technical analysis firm Fairlead Strategies said in its weekly report.
The analysis identifies several technical indicators suggesting Bitcoin (BTC) might face downward pressure. One key factor is the appearance of short-term exhaustion signals.

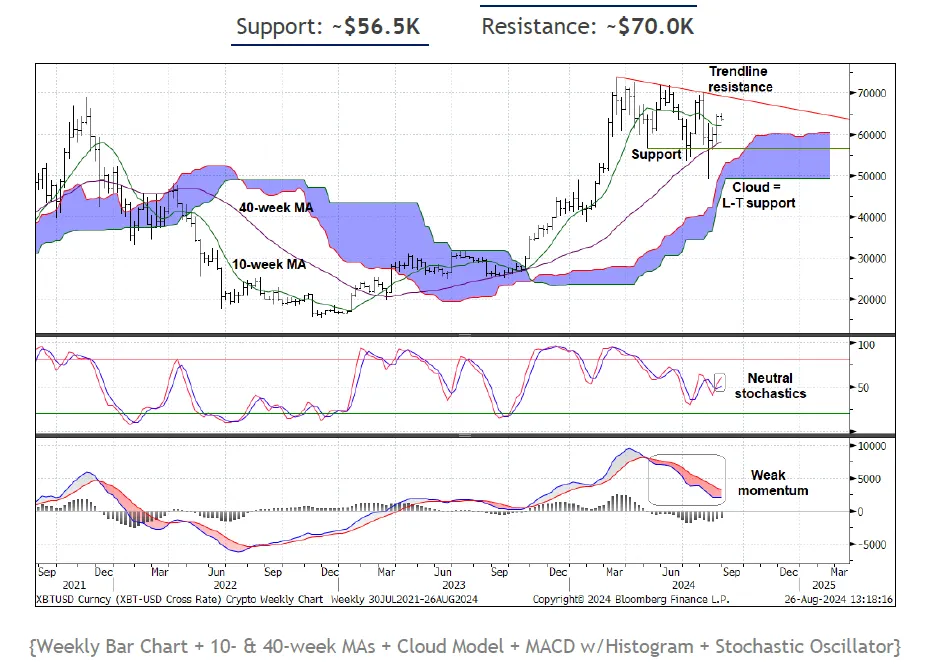
“There are now minor signs of upside exhaustion per the DeMARK Indicators, and once the daily stochastics turn below 80%, it would increase risk that support (~$56,500) is retested,” the report notes.
The DeMARK Indicator is a proprietary tool used to identify potential market reversals, while stochastics measure momentum by comparing closing prices to price ranges over time. Adding to the bearish outlook, Fairlead expects anemic mid-term momentum for Bitcoin.
“Intermediate-term momentum is weak, and a monthly counter-trend signal from the DeMARK Indicators supports another two months of corrective price action,” the report explains.
This suggests the potential for continued downward or sideways movement in Bitcoin’s price beyond just September. The firm also points to broader market conditions that could impact Bitcoin’s performance. Notably, the report mentions potential strength in the U.S. dollar as a headwind.
“The Dollar Index, which tends to hold a slight negative correlation with Bitcoin, looks primed for a near-term rebound,” the analysis states. Typically, a stronger dollar correlates with weaker Bitcoin prices.
Despite these short-term concerns, Fairlead Strategies maintains a long-term bullish stance on Bitcoin. The report identifies key price levels to watch, including “trendline resistance near $70,000.” As of this writing, Bitcoin is trading at $62,145, down just over 2% in the last day.
The report also looks at how other popular cryptocurrencies are performing compared to Bitcoin.

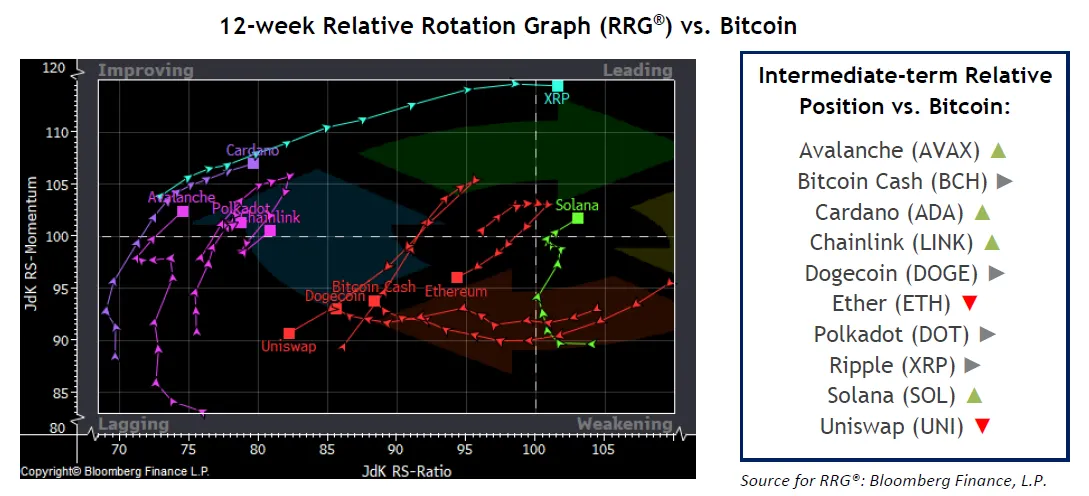
A 12 week-chart called the Relative Rotation Graph (RRG) shows improvement for Avalanche (AVAX), Chainlink (LINK), and Solana (SOL). This means that over the past few months, these three cryptocurrencies have been gaining strength and might perform better than Bitcoin in the near future.
However, not all cryptocurrencies are showing positive signs, with the report noting that Ethereum (ETH) and Uniswap (UNI) “remain least favorably positioned, pointing down and to the left.”
Edited by Andrew Hayward
Daily Debrief Newsletter
Start every day with the top news stories right now, plus original features, a podcast, videos and more.
Source link
You may like


Legacy Media’s Transformation: Why Evolution Beats Extinction


Massive Ethereum Buying Spree – Taker Buy Volume hits $1.683B In One Hour


Ethereum lags behind Bitcoin but is expected to reach $14K, boosting RCOF to new high


Bitcoin Miner MARA Buys Another 5771 BTC As Price Nears $100k


Jason "Spaceboi" Lowery's Bitcoin "Thesis" Is Incoherent Gibberish


Bankrupt Crypto Exchange FTX Set To Begin Paying Creditors and Customers in Early 2025, Says CEO

Bitcoin Cash (BCH) added nearly 35% to its value in the past month and rallied 12% on Nov. 21. Bitcoin’s (BTC) observed a rally to $98,384 early on Nov. 21, with BCH and other top cryptocurrencies tagging along for the ride.
An analysis of on-chain and technical indicators and data from the derivatives market shows that BCH could extend gains and retest its mid-April 2024 peak of $569.10.
Bitcoin hits all-time high, fork from 2017 ignites hope for traders
Bitcoin hit a record high of $98,384 on Nov. 21, a key milestone as the cryptocurrency eyes a run to the $100,000 target. BTC was forked in 2017, creating a spin-off or alternative, Bitcoin Cash.
BCH hit a peak of $1,650 in May 2021. Since April 2024, BCH has been consolidating with no clear trend formation.
BCH price rallied nearly 30% since Nov. 15, on-chain indicators show that further rally is likely in the Bitcoin spin-off token.
Bitcoin Cash’s active addresses have climbed consistently since August 2024. Santiment data shows an uptrend in active addresses, meaning BCH traders have sustained demand for the token, supporting a bullish thesis for the cryptocurrency.
The ratio of daily on-chain transaction volume in profit to loss exceeds 2, is 2.141 on Thursday. BCH traded on-chain noted twice as many profitable transactions on the day, as the ones where losses were incurred. This is another key metric that paints a bullish picture for the token forked from Bitcoin.
Binance funding rate is positive since Nov. 10. In the past eleven days, traders have been optimistic about gains in BCH price, according to Santiment data.

The network realized profit/loss metric identifies the net gain or loss of all traders who traded the token within a 24 hour period. NPL metric for Bitcoin Cash shows traders have been taking profits on their holdings, small positive spikes on the daily price chart represent NPL.
Investors need to keep their eyes peeled for significant movements in NPL, large positive spikes imply heavy profit-taking activities that could increase selling pressure across exchange platforms.
84.48% of Bitcoin Cash’s supply is currently profitable, as of Nov. 21. This metric helps traders consider the likelihood of high profit-taking or exits from existing BCH holders, to time an entry/ exit in spot market trades.

Derivatives traders are bullish on BCH
Derivatives market data from Coinglass shows a 33% increase in open interest in Bitcoin Cash. Open interest represents the total number of active contracts that haven’t been settled, representing demand for the BCH token among derivatives traders.
Derivatives trade volume climbed 613% in the same timeframe, to $2.35 billion. Across exchanges, Binance and OKX, the long/short ratio is above 1, closer to 2, meaning traders remain bullish on BCH and expect prices to rally.

BCH futures open interest chart shows a steady increase in the metric, alongside BCH price gain since November 5, 2024. Open interest climbed from $190.74 million to $254.87 million between November 5 and 21.

Technical indicators show BCH could gain 18%
The BCH/USDT daily price chart on Tradingview.com shows that the token remains within the consolidation. The token is stuck within a range from $272.70 to $568.20. BCH could attempt to break past the upper boundary of the range, a daily candlestick close above $568.20 could confirm the bullish breakout.
The April 2024 high of $719.50 is the next major resistance for BCH and the second key level is at $805.80, a key level from May 2021.
The relative strength index reads 64, well below the “overvalued” zone above 70. RSI supports a bullish thesis for BCH. Another key momentum indicator, moving average convergence divergence flashes green histogram bars above the neutral line. This means BCH price trend has an underlying positive momentum.
The awesome oscillator is in agreement with the findings of RSI and MACD, all three technical indicators point at likelihood of gains.

A failure to close above the upper boundary of the range could invalidate the bullish thesis. BCH could find support at the midpoint of the range at $419.90 and the 50-day exponential moving average at $388.50.
Disclosure: This article does not represent investment advice. The content and materials featured on this page are for educational purposes only.
Source link
Bitcoin Magazine Pro
The Bitcoin Pi Cycle Top Indicator: How to Accurately Time Market Cycle Peaks
Published
17 hours agoon
November 22, 2024By
admin
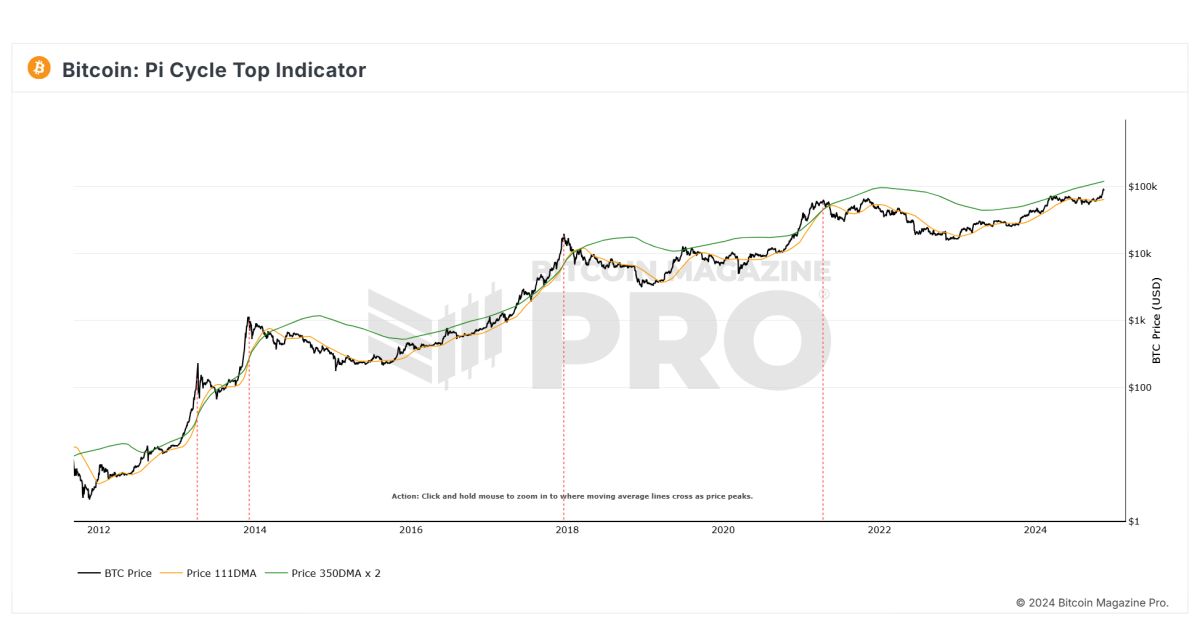
The Bitcoin Pi Cycle Top Indicator has gained legendary status in the Bitcoin community for its uncanny accuracy in identifying market cycle peaks. Historically, it has timed every single Bitcoin cycle high with remarkable precision—often within just three days. Could it work its magic again this cycle? Let’s dive deeper into how it works and its significance in navigating Bitcoin’s market cycles.
What is the Pi Cycle Top Indicator?
The Pi Cycle Top Indicator is a tool designed to identify Bitcoin’s market cycle tops. Created by Philip Swift, Managing Director of Bitcoin Magazine Pro in April 2019, this indicator uses a combination of two moving averages to forecast cycle highs:
- 111-Day Moving Average (111DMA): Represents the shorter-term price trend.
- 350-Day Moving Average x 2 (350DMA x 2): A multiple of the 350DMA, which captures longer-term trends.
When the 111DMA rises sharply and crosses above the 350DMA x 2, it historically coincides with Bitcoin’s market cycle peak.
The Mathematics Behind the Name
Interestingly, the ratio of 350 to 111 equals approximately 3.153—remarkably close to Pi (3.142). This mathematical quirk gives the indicator its name and highlights the cyclical nature of Bitcoin’s price action over time.
Why Has It Been So Accurate?
The Pi Cycle Top Indicator has been effective in predicting the peaks of Bitcoin’s three most recent market cycles. Its ability to pinpoint the absolute tops reflects Bitcoin’s historically predictable cycles during its adoption growth phase. The indicator essentially captures the point where the market becomes overheated, as reflected by the steep rise of the 111DMA surpassing the 350DMA x 2.
How Can Investors Use This Indicator?
For investors, the Pi Cycle Top Indicator serves as a warning sign that the market may be approaching unsustainable levels. Historically, when the indicator flashes, it has been advantageous to sell Bitcoin near the top of the market cycle. This makes it a valuable tool for those seeking to maximize gains and minimize losses.
However, as Bitcoin matures and integrates further into the global financial system—bolstered by developments like Bitcoin ETFs and institutional adoption—the effectiveness of this indicator may diminish. It remains most relevant during Bitcoin’s early adoption phase.
A Glimpse Into the Future
The big question now is: will the Pi Cycle Top Indicator remain accurate in this cycle? With Bitcoin entering a new era of adoption and market dynamics, its cyclical patterns may evolve. Yet, this tool has proven its worth repeatedly over Bitcoin’s first 15 years, offering investors a reliable gauge of market tops.
Final Thoughts
The Pi Cycle Top Indicator is a testament to Bitcoin’s cyclical nature and the power of mathematical models in understanding its price behavior. While its past accuracy has been unparalleled, only time will tell if it can once again predict Bitcoin’s next market cycle peak. For now, it remains an indispensable tool for those navigating the thrilling highs and lows of Bitcoin.
Explore the full chart and stay informed.
Source link
$100
Bitcoin Nears $100,000 As Trump Council Expected To Implement BTC Reserve
Published
1 day agoon
November 22, 2024By
admin

What an enormous day it has been today.
Gary Gensler officially announced that he is stepping down from his position as Chairman of the Securities and Exchange Commission (SEC), and minutes later, Reuters reported that Donald Trump’s “crypto council” is expected to “establish Trump’s promised bitcoin reserve.” A bitcoin reserve, that would see the United States purchase 200,000 bitcoin per year, for five years until it has bought 1,000,000 bitcoin.

Right after both of those, Bitcoin continued its upward momentum and broke $99,000, with $100,000 feeling like it can happen at any second now.
It is hard to contain my bullishness thinking about the United States purchasing 200,000 BTC per year. They essentially have to compete with everyone else in the world who is also accumulating bitcoin and attempting to front run them. There are only 21 million bitcoin and that is a LOT of demand.
To put this into context, so far this year the US spot bitcoin ETFs have accumulated a combined total of over 1 million BTC. At the time of launch the price was ~$44,000 and now bitcoin is practically at $100,000. And that’s all ETFs combined. Imagine what will happen when just one entity wants to buy a total of 1 million coins, having to compete with everyone else accumulating large amounts as well?
I mean MicroStrategy literally just completed another $3 BILLION raise to buy more bitcoin, and will continue raising until it purchases $42 billion more in bitcoin. The United States are most likely going to be purchasing their coins (if this legislation is officially signed into law) at very high prices. The demand is insane and only rising in the foreseeable future.
With two months left to go until Trump officially takes office, it remains to be seen if this bill becomes law, but at the moment things are looking really good. As Senator Cynthia Lummis stated, “This is our Louisiana Purchase moment!” and would be an absolutely historic moment for Bitcoin, Bitcoiners, and the future financial dominance of the United States of America.
This is the solution.
This is the answer.
This is our Louisiana Purchase moment!#Bitcoin2024 pic.twitter.com/RNEiLaB16U
— Senator Cynthia Lummis (@SenLummis) July 27, 2024
This article is a Take. Opinions expressed are entirely the author’s and do not necessarily reflect those of BTC Inc or Bitcoin Magazine.
Source link

Legacy Media’s Transformation: Why Evolution Beats Extinction

Massive Ethereum Buying Spree – Taker Buy Volume hits $1.683B In One Hour

Ethereum lags behind Bitcoin but is expected to reach $14K, boosting RCOF to new high

Bitcoin Miner MARA Buys Another 5771 BTC As Price Nears $100k

Jason "Spaceboi" Lowery's Bitcoin "Thesis" Is Incoherent Gibberish

Bankrupt Crypto Exchange FTX Set To Begin Paying Creditors and Customers in Early 2025, Says CEO

Top crypto traders’ picks for explosive growth by 2025

3 Tokens Ready to 100x After XRP ETF Gets Approval

Gary Gensler’s Departure Is No Triumph For Bitcoin

Magic Eden Token Airdrop Date Set as Pre-Market Value Hits $562 Million

Blockchain Association urges Trump to prioritize crypto during first 100 days

Pi Network Coin Price Surges As Key Deadline Nears

How Viable Are BitVM Based Pegs?

UK Government to Draft a Regulatory Framework for Crypto, Stablecoins, Staking in Early 2025

Bitcoin Cash eyes 18% rally
182267361726451435

Top Crypto News Headlines of The Week

Why Did Trump Change His Mind on Bitcoin?

New U.S. president must bring clarity to crypto regulation, analyst says

Ethereum, Solana touch key levels as Bitcoin spikes

Will XRP Price Defend $0.5 Support If SEC Decides to Appeal?

Bitcoin Open-Source Development Takes The Stage In Nashville

Bitcoin 20% Surge In 3 Weeks Teases Record-Breaking Potential

Ethereum Crash A Buying Opportunity? This Whale Thinks So

Shiba Inu Price Slips 4% as 3500% Burn Rate Surge Fails to Halt Correction

‘Hamster Kombat’ Airdrop Delayed as Pre-Market Trading for Telegram Game Expands

Washington financial watchdog warns of scam involving fake crypto ‘professors’

Citigroup Executive Steps Down To Explore Crypto
Mostbet Güvenilir Mi – Casino Bonus 2024

Bitcoin flashes indicator that often precedes higher prices: CryptoQuant
Trending

 2 months ago
182267361726451435

 24/7 Cryptocurrency News3 months ago
Top Crypto News Headlines of The Week

 Donald Trump4 months ago
Why Did Trump Change His Mind on Bitcoin?

 News3 months ago
New U.S. president must bring clarity to crypto regulation, analyst says

 Bitcoin4 months ago
Ethereum, Solana touch key levels as Bitcoin spikes

 Price analysis3 months ago
Will XRP Price Defend $0.5 Support If SEC Decides to Appeal?

 Opinion4 months ago
Bitcoin Open-Source Development Takes The Stage In Nashville

 Bitcoin4 months ago
Bitcoin 20% Surge In 3 Weeks Teases Record-Breaking Potential


