layer 1
Why is Solana down by 30% from its 2024 high?
Published
3 months agoon
By
admin
Solana price has remained in a deep bear market, falling by over 30% from its highest point in 2024.
Solana (SOL), the fifth-largest cryptocurrency in the industry, was trading at $145, down from its year-to-date high of $210. Its valuation has retreated from a YTD high of $86 billion to $68 billion.
SOL is in a bear market because of its correlation with Bitcoin (BTC) and other altcoins. Bitcoin has dropped by almost 20% from the YTD high while coins like Ethereum (ETH), Avalanche (AVAX), and Cardano (ADA) are down by over 30%.
Altcoins like Solana typically make bigger moves than Bitcoin. They perform better when Bitcoin is rising and significantly underperform when it is in a downtrend. For example, BTC rose by 70% between Jan. 1 and March 24, while SOL and ETH rose by over 80% during the same period.
Solana has also retreated as it faces substantial competition from Tron (TRX), which recently launched SunPump, a meme coin generator. The DEX volume on Solana in the past seven days has fallen by almost 9% while Tron’s has risen by over 210% to $1.70 billion.
Most of Solana’s meme coins have also retreated. Dogwifhat has dropped by almost 70% from its highest level this year, while Book of Meme (BOME) has fallen by 80% from its all-time high.
Tron has also overtaken Solana in DeFi total value locked, the number of active addresses, and stablecoins. Tron has over $8.3 billion in assets, 2.47 million in addresses, and almost $60 billion in stablecoins. In comparison, Solana has $5.16 billion, 1.74 million, and $3.9 billion, respectively.
Solana’s futures open interest has fallen
Meanwhile, Solana’s open interest in the futures market has been in a downtrend. Most recently, the interest peaked at $3 billion in July and has pulled back to $2 billion, signaling waning demand.

Solana has also dropped because of the ongoing performance of spot Ethereum ETFs. The latest data shows that they have not become popular. They have had cumulative outflows of $481 million and have shed assets in five of the last six weeks.
Therefore, if the trend continues, there is a likelihood that companies like Blackrock, Fidelity, and Franklin Templeton will not apply for a spot Solana ETF. The SEC has also been reluctant to approve these funds. Earlier this month, the agency turned down Cboe Global Markets’ 19b-4 filing for a Solana fund.
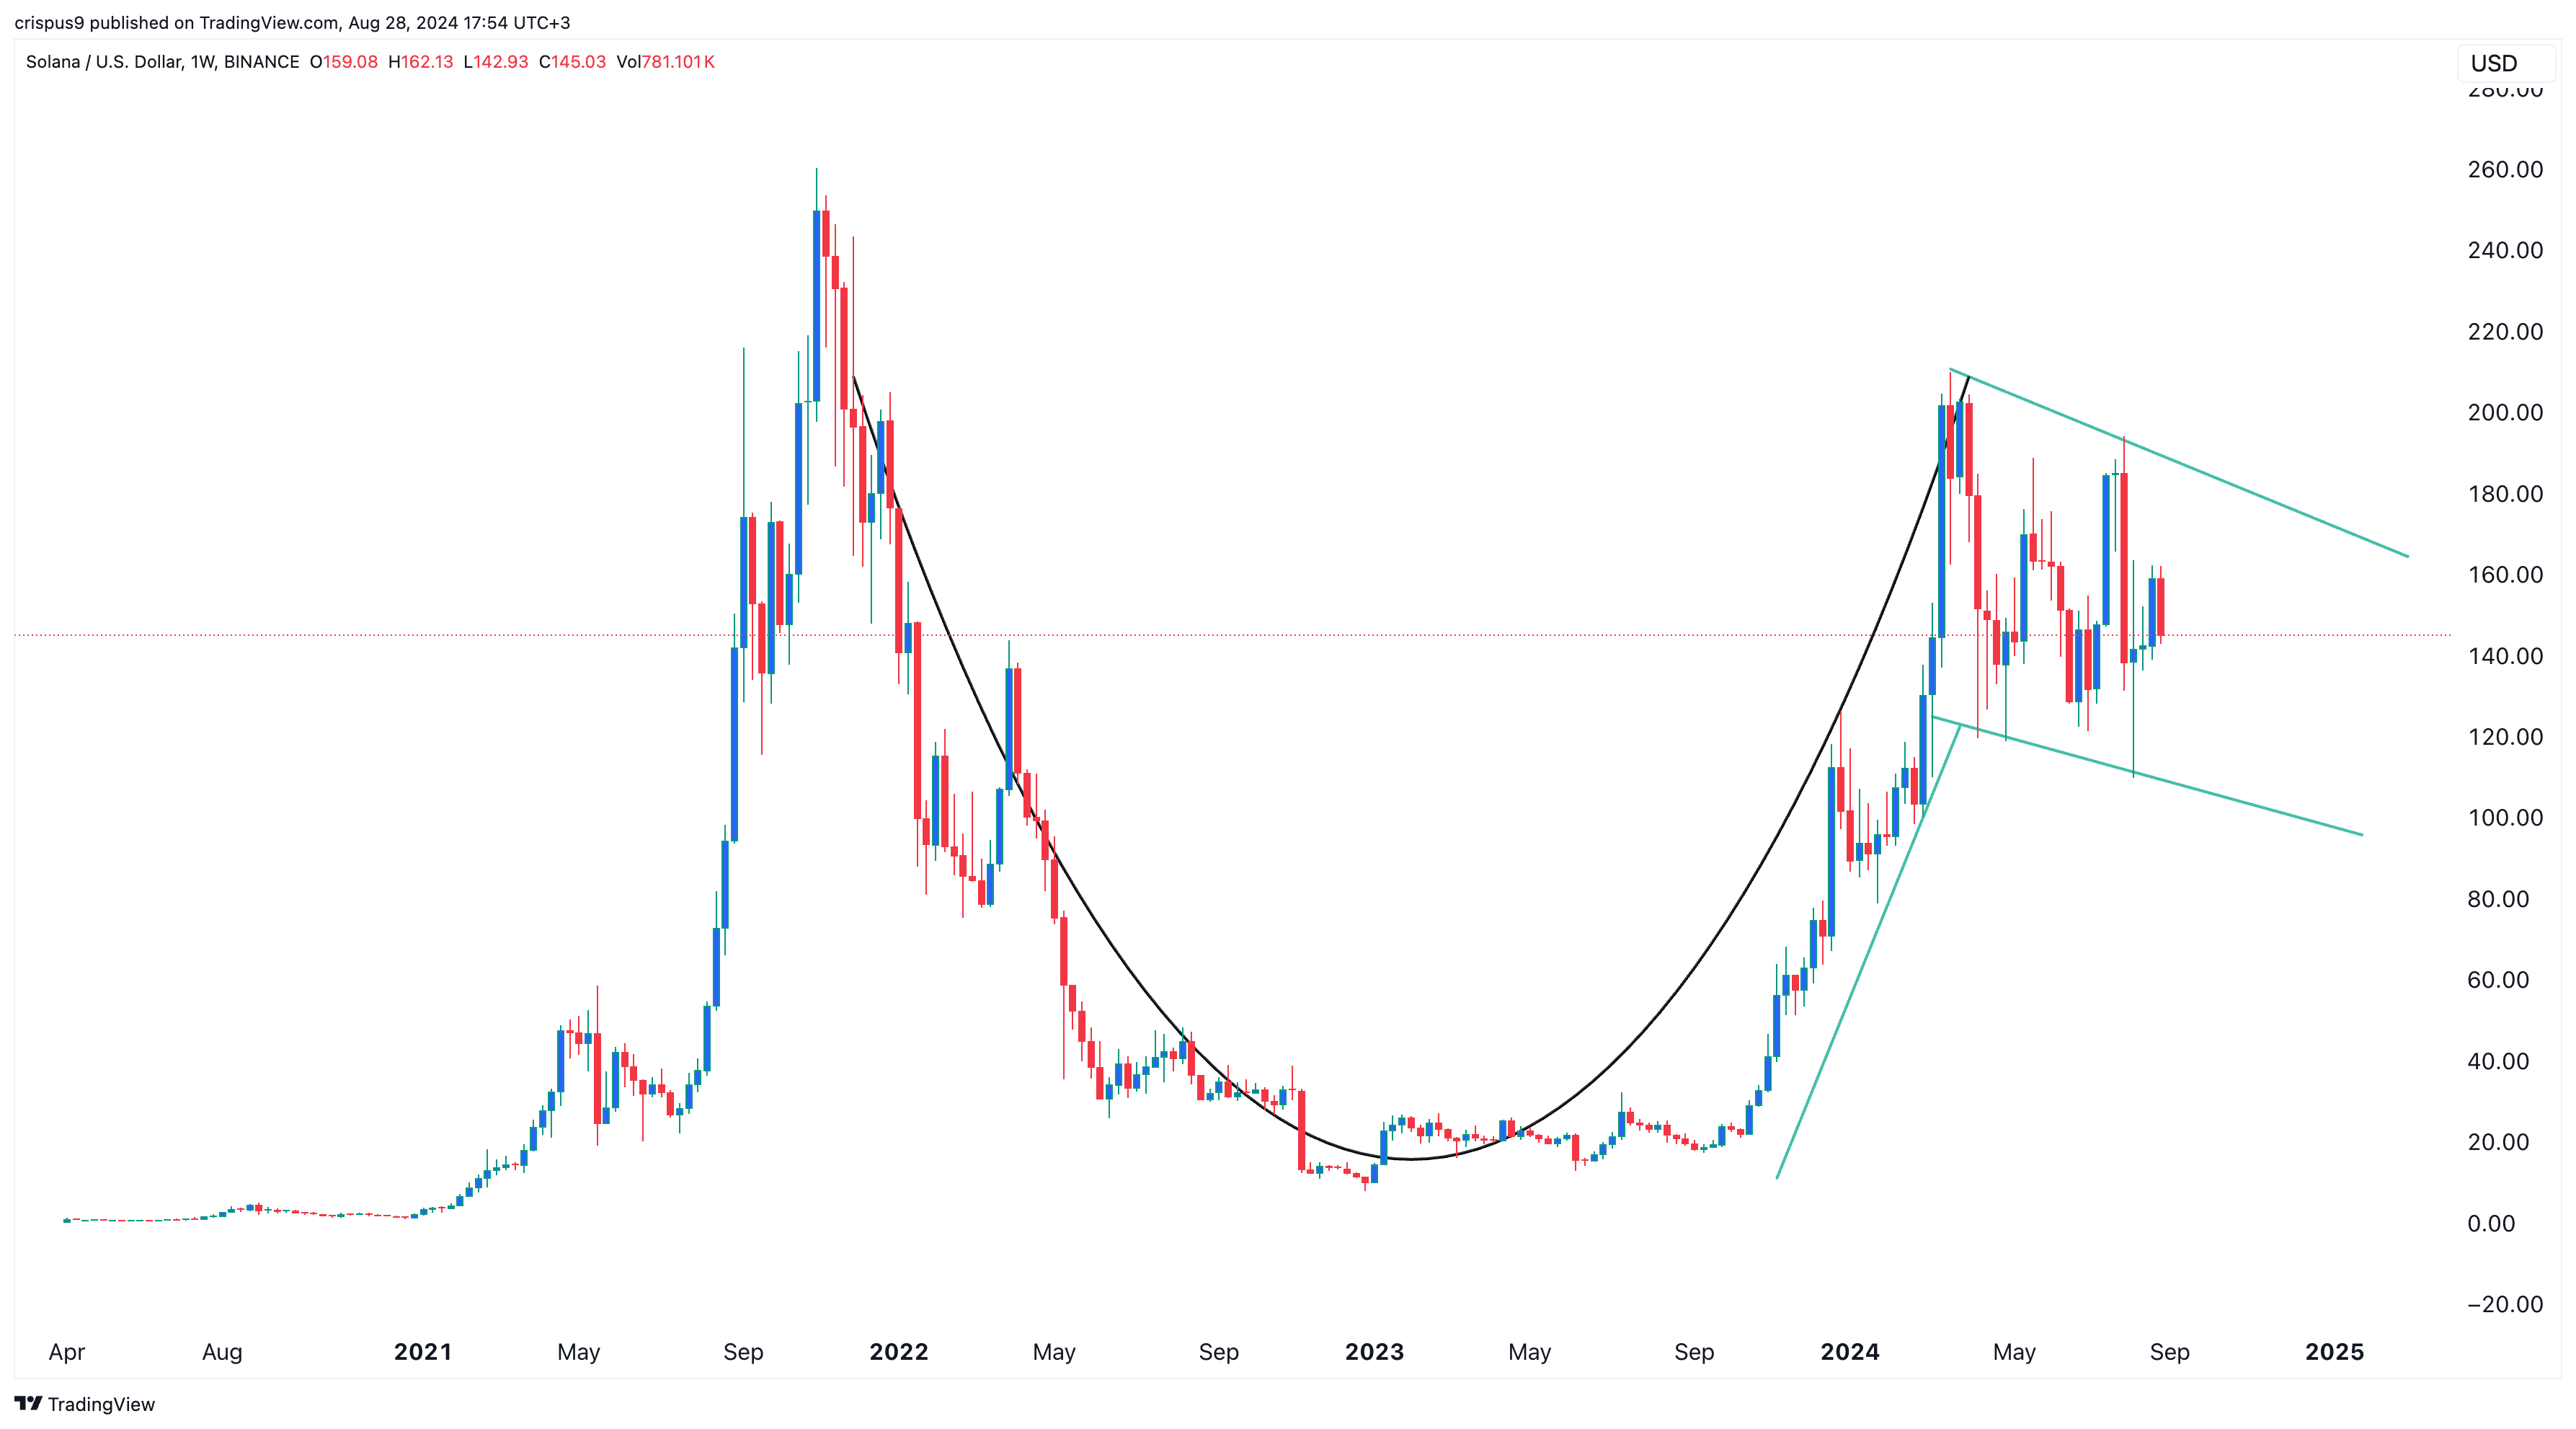
Technically, as shown above, the pullback is likely part of the formation of a bullish flag pattern. It is also part of the hand section of the cup and handle pattern on the weekly chart. If these patterns work out well, Solana will likely bounce back later this year.
Source link
You may like

The Bitcoin Pi Cycle Top Indicator: How to Accurately Time Market Cycle Peaks


Bitcoin Approaches $100K; Retail Investors Stay Steady


Solana Hits New ATH On Huge Whale Accumulation, More Gains Ahead?


Microsoft Should Buy $78 Billion Worth of Bitcoin


Ethereum Believers May Be Staring Down Opportunity As ETH Reaches Another Low Against Bitcoin: CryptoQuant CEO


UK government is ready for crypto regulations next year
Hedera
Hedera’s HBAR momentum has just began, analyst says
Published
7 days agoon
November 15, 2024By
admin
Hedera Hashgraph was one of the best-performing cryptocurrencies on Friday, November 15, as a popular crypto analyst made his bullish case.
Hedera Hashgraph (HBAR) price rose to $0.0767, its highest level since July 17, and 66% above its lowest level this month.
In an X post, a trader known as Maverick, who has over 145,000 followers, said that HBAR’s climb had just begun. He believes that it can surge to the year-to-date high of $0.1813, which is about 182% higher than the current level.
$HBAR Breaking Barriers!
After nearly 250-day downtrend, @hedera is on a stellar rally:
📈+40% in the last 7 days
📈+16% in the last 24 hours
📊112% spike in trading volume to $563M in 24 hoursMomentum surged after Canary Capital’s Hedera ETF filing, marking a pivotal… pic.twitter.com/N5F3j2I1U3
— Maverick (@degen_maverick) November 15, 2024
Maverick cites the rising Hedera Hashgraph’s volume and the recent application of a spot ETF by Canary Capital as a potential catalyst. There is a likelihood that Donald Trump’s Securities and Exchange Commission would easily approve such an ETF.
Another potential catalyst for Hedera Hashgraph is that its futures open interest has been in a strong uptrend. It jumped to $66.7 million, up from $26.6 million in September, a sign that it is seeing strong demand.
Still, Hedera Hashgraph has numerous challenges. For one, while it counts large companies like Ubisoft, Dell, Boeing, Google, and Deutsche Bank as members of its governance council, its ecosystem is fairly small.
For example, it has a DeFi total value locked of just $44 million, making it much smaller than newer blockchains like Sui and Base Blockchain. DEX networks in its ecosystem handled tokens worth $35.4 million in the last seven days, making it the 32nd biggest chain in the industry.
HBAR price could hit $0.1 soon
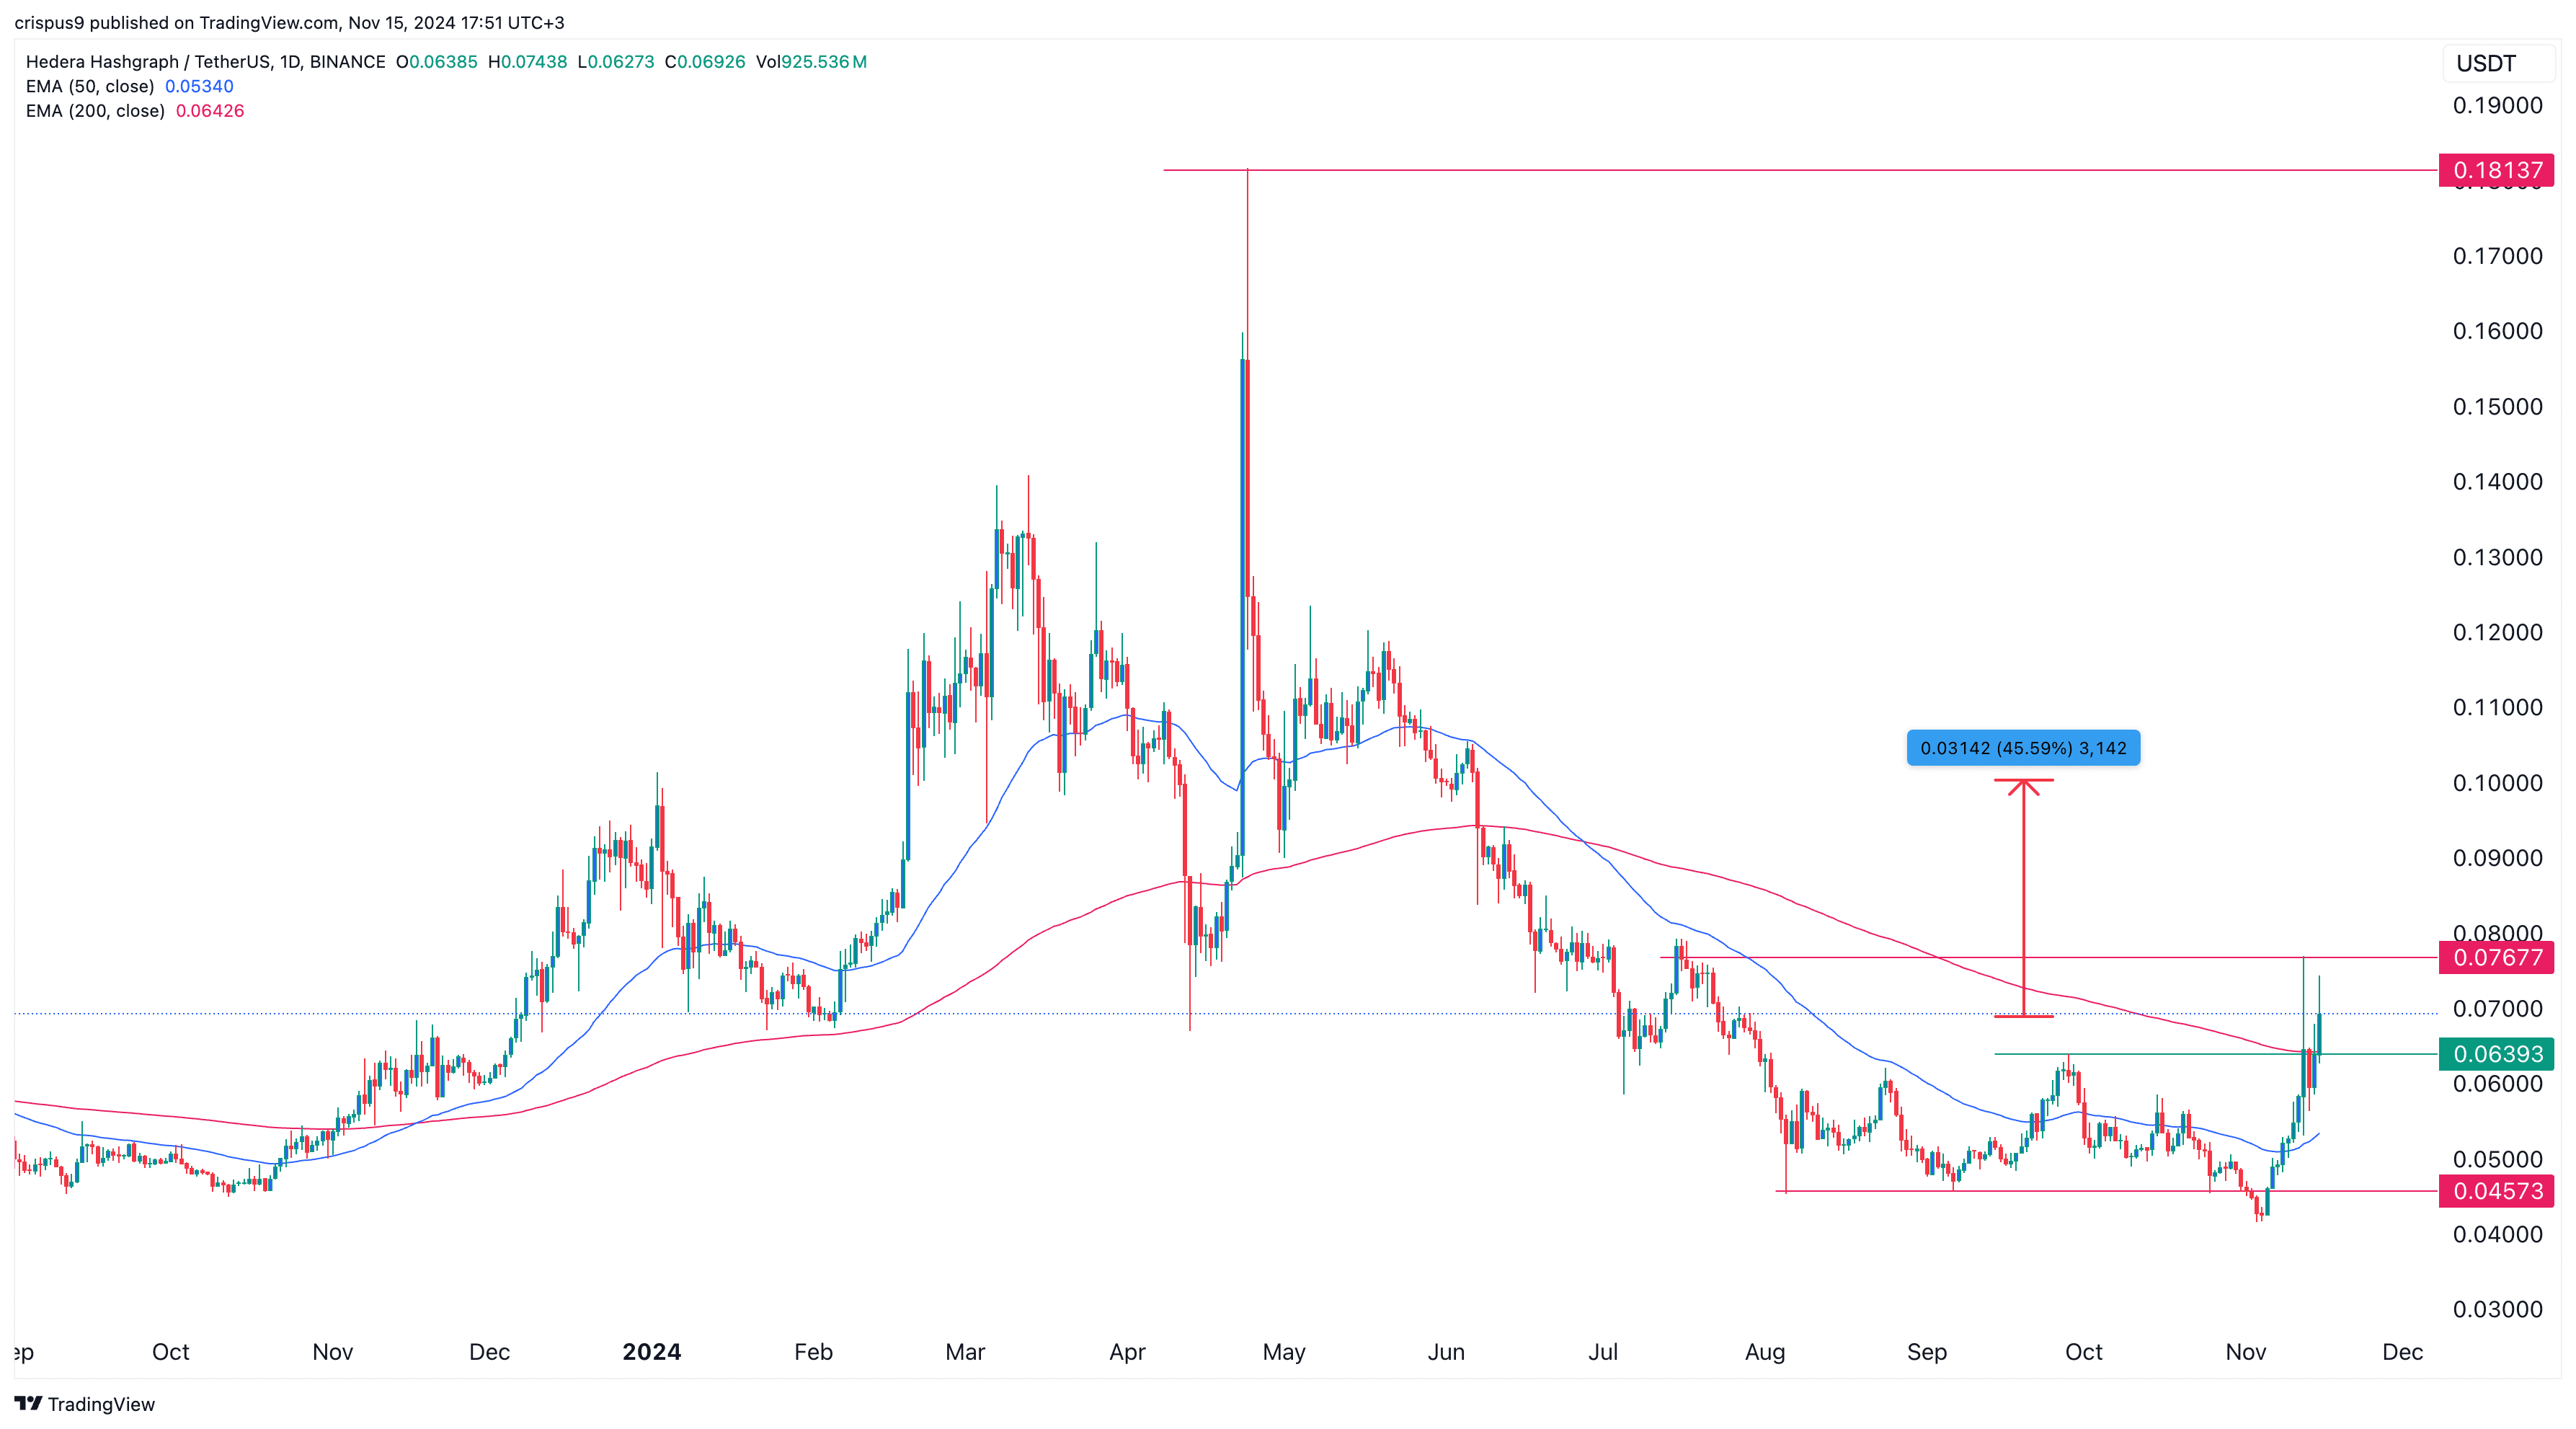
The daily chart shows that the Hedera Hashgraph price has bounced back in the past few days. This recovery happened after it formed a double-bottom pattern around the support at $0.045. In most periods, this is one of the most bullish patterns in the market.
Hedera has also soared above the key resistance level at $0.063, the neckline of this pattern. It has also jumped above the 50-day and 200-day moving averages.
Therefore, the path of the least resistance for the coin is bullish, with the next psychological level to watch being at $0.10, which is about 45% above the current level. The stop-loss of this trade will be at $0.055.
Source link
layer 1
Polkadot price forms a rare pattern, 76% jump possible
Published
2 weeks agoon
November 8, 2024By
admin
Polkadot price may be preparing for a major bullish breakout as a rare pattern that has been forming since August nears its completion.
Polkadot (DOT), a top layer-1 network, was trading at $4.30 on Friday, Nov. 8 after rising for four consecutive days. It has jumped by 18% from its lowest point this year month, meaning that it is approaching a bull market.
Crypto analysts are bullish on Polkadot despite of its weak fundamentals. One of the main themes has been a falling wedge pattern that has been forming since Aug. 1. In an X post, a crypto analyst known as Globe of Crypto, estimated that the coin could jump to between $9 and $10 when the break out happens. If this happens, it will see DOT token more than double.
A potential catalyst for the Polkadot price is the new connection of the network to other chains like Ethereum, Optimism, Arbitrum, Base, and Binance Smart Chain. This connection, which has been enabled by Hyperbridge, means that users can move assets across these chains without relying on middlemen.
Meanwhile, there are signs that open interest in the futures market is picking up momentum. DOT’s open interest rose to over $269 million, its highest level since June 17. It has had a strong comeback after bottoming at $179 million in September.
Still, the biggest challenge for Polkadot is that it has not gained a lot of traction among developers. Its ecosystem growth has been relatively weak such that it has been passed by other newer networks like Base and Sui.
Polkadot price analysis
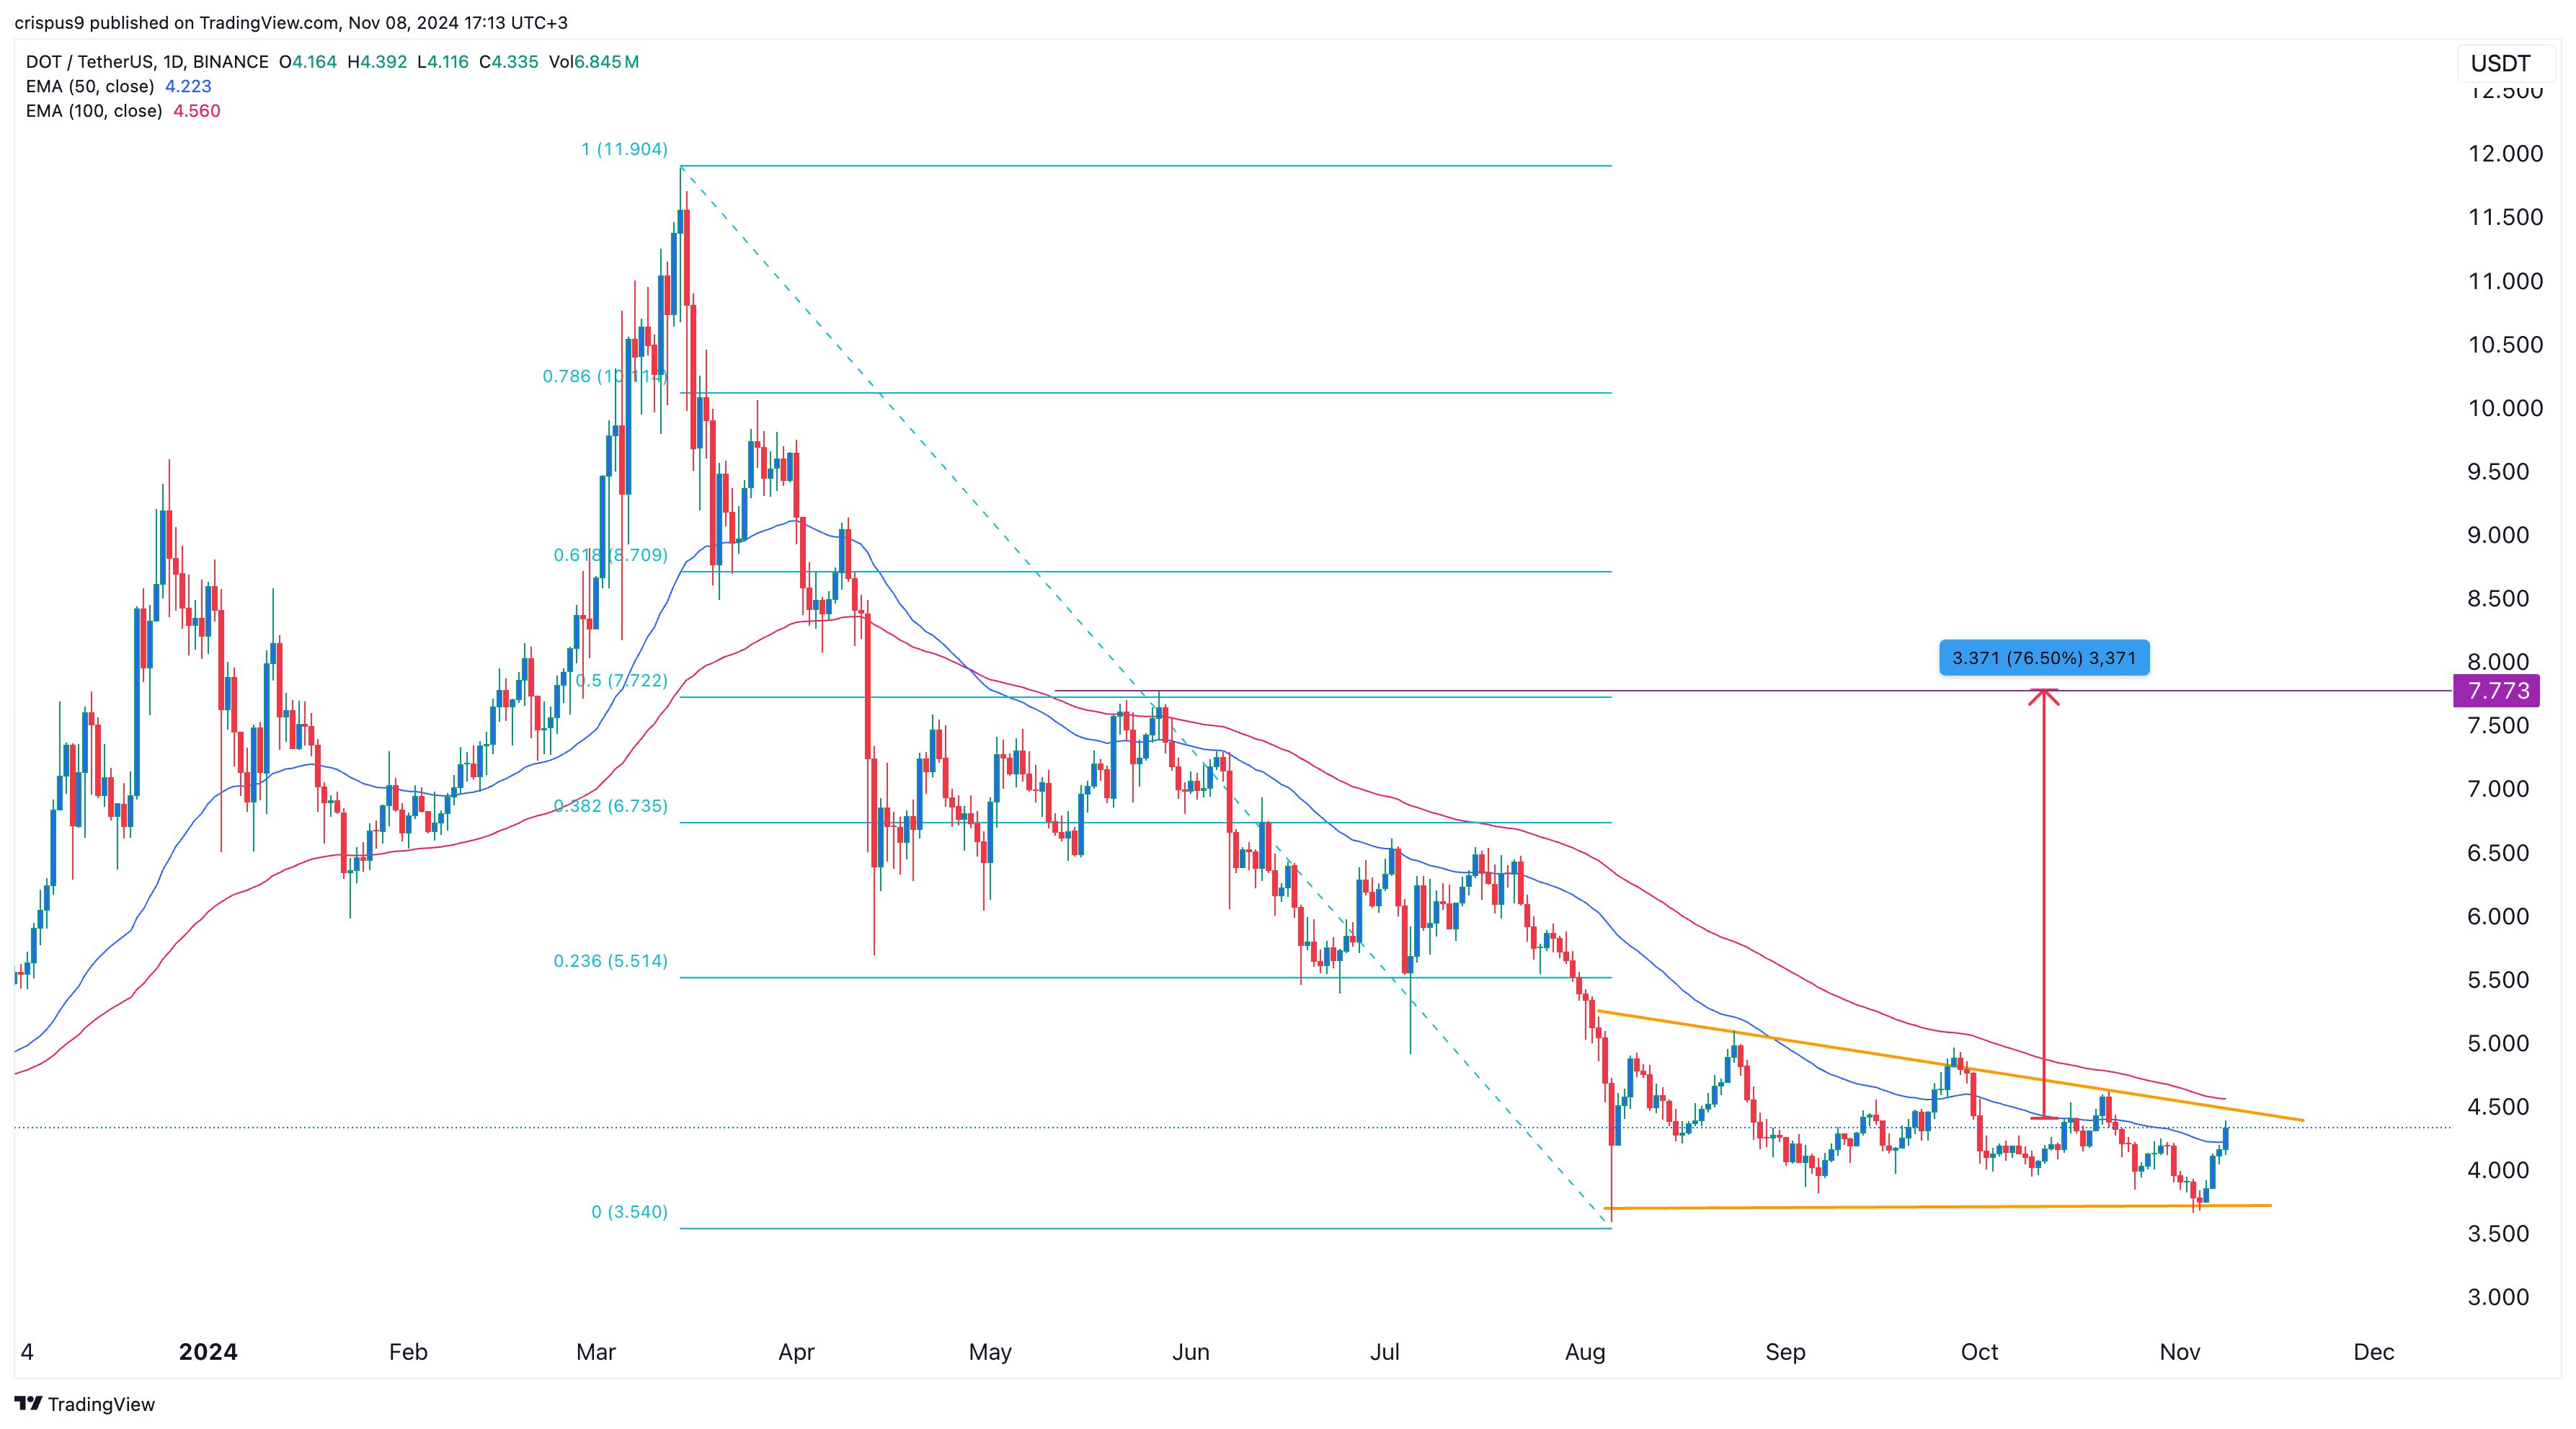
The daily chart shows that the DOT price has been in a tight range in the past few months. In this period, it has constantly remained below the 50-day and 100-day moving averages.
On the positive side, it has formed a falling wedge pattern, which is now nearing the confluence level. Such a move, especially at a time when oscillators like the Relative Strength Index (RSI) and Stochastic have pointed upwards, is a sign that the coin will soon have a bullish breakout.
If this happens, Polkadot price may jump to $7.77, its highest swing since May 27 and the 50% Fibonacci Retracement point. If this happens, the token will jump by 76.50% from the current level. This view will become invalid if it moves below this month’s low at $3.66.
Source link
layer 1
Toncoin nears a dreaded pattern despite strong on-chain metrics
Published
2 months agoon
October 1, 2024By
admin
The Toncoin token remained in a bear market and was at risk of forming the dreaded death cross pattern, despite strong on-chain metrics.
Toncoin (TON) was trading at $5.81 on Monday, Sep. 30, down by over 30% from the year-to-date high.
Strong on-chain metrics
Additional data showed that the number of on-chain activated wallets has risen to over 20.8 million, a significant increase from January’s low of 1.1 million.
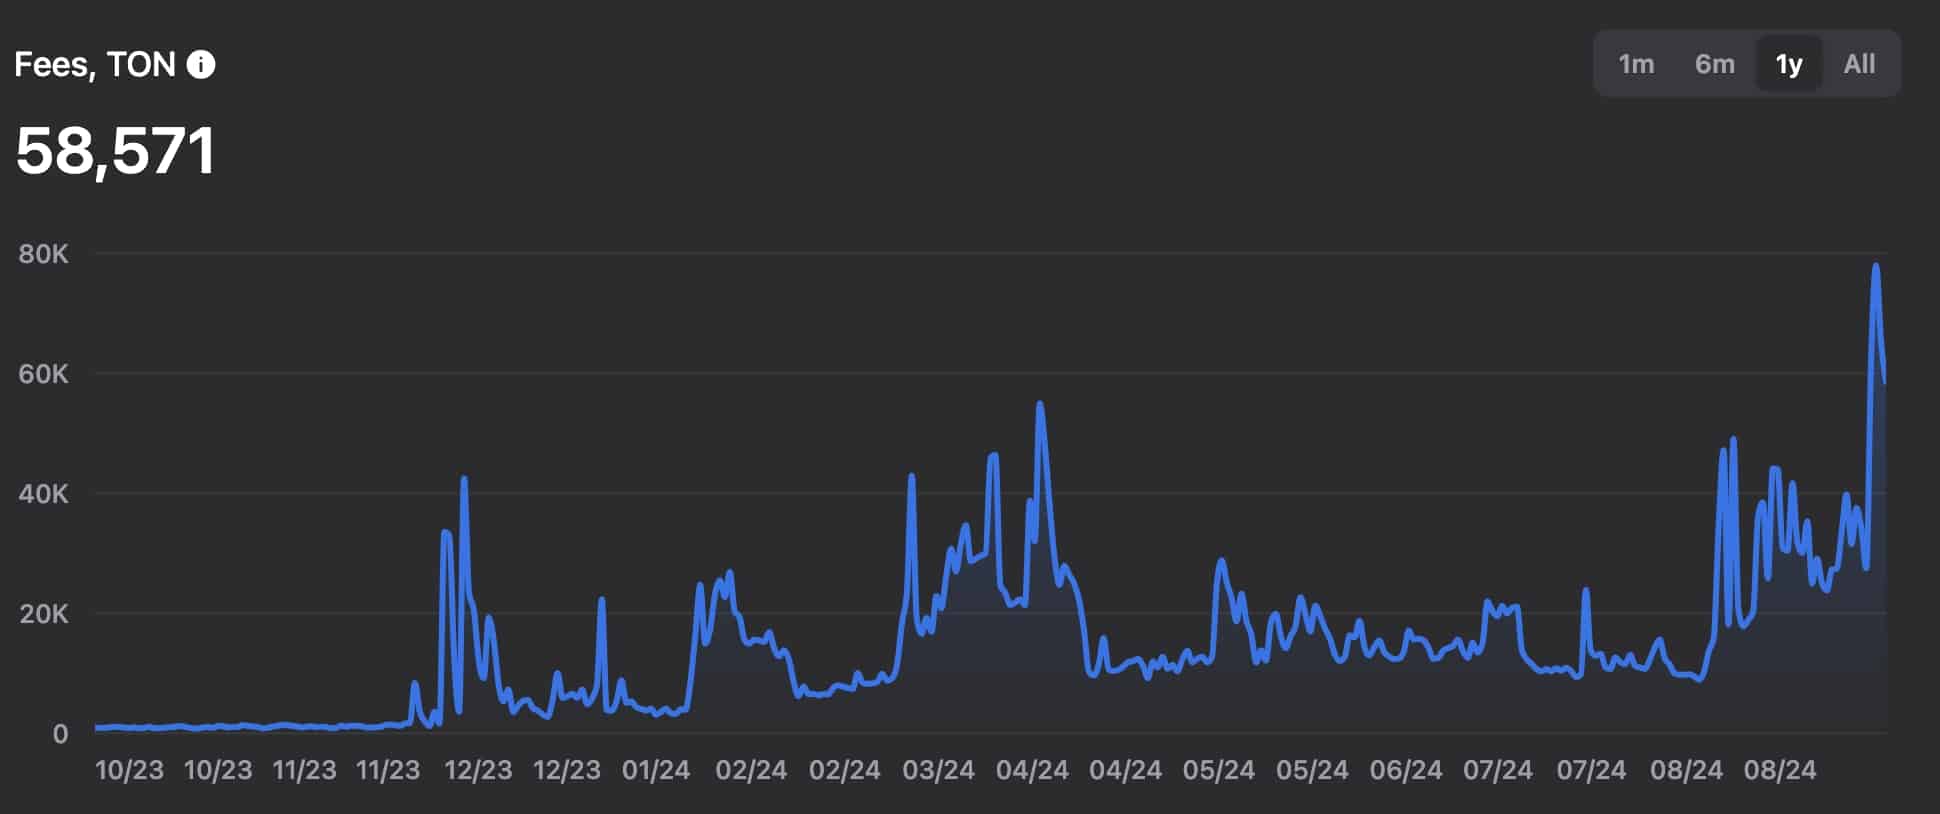
Moreover, the number of Toncoins burned daily has continued to rise, reaching the year-to-date high of almost 39,000. These burns have coincided with a sharp decline in the number of minted Toncoins, which has dropped to 39,000 from this month’s high of over 50,000.
Role in DeFi is fading
Toncoin’s price has likely retreated due to its waning role in the decentralized finance industry, where the total value locked in the network has dropped from over $765 million in July to $427 million.
TON has moved from being a top ten player in the DeFi industry to becoming the 20th-biggest chain. Smaller chains such as Core, Mode, Mantle, and Linea have surpassed it in recent weeks.
Toncoin has also dropped because of Pavel Durov’s recent arrest in France and the performance of its tap-to-earn tokens. Hamster Kombat, which launched its airdrop last week, has dropped by almost 60% from its highest level.
Similarly, Notcoin (NOT) dropped by 71%, while Catizen (CATI) has fallen by 50% from their all-time highs. Most of all the recently launched Telegram’s tap-to-earn tokens have dropped to record lows.
Meanwhile, Toncoin’s futures open interest dropped to $260 million on Sep. 30, down from the year-to-date high of over $360 million. This figure has reached its lowest point since Sep. 12, indicating waning demand.
Toncoin price analysis
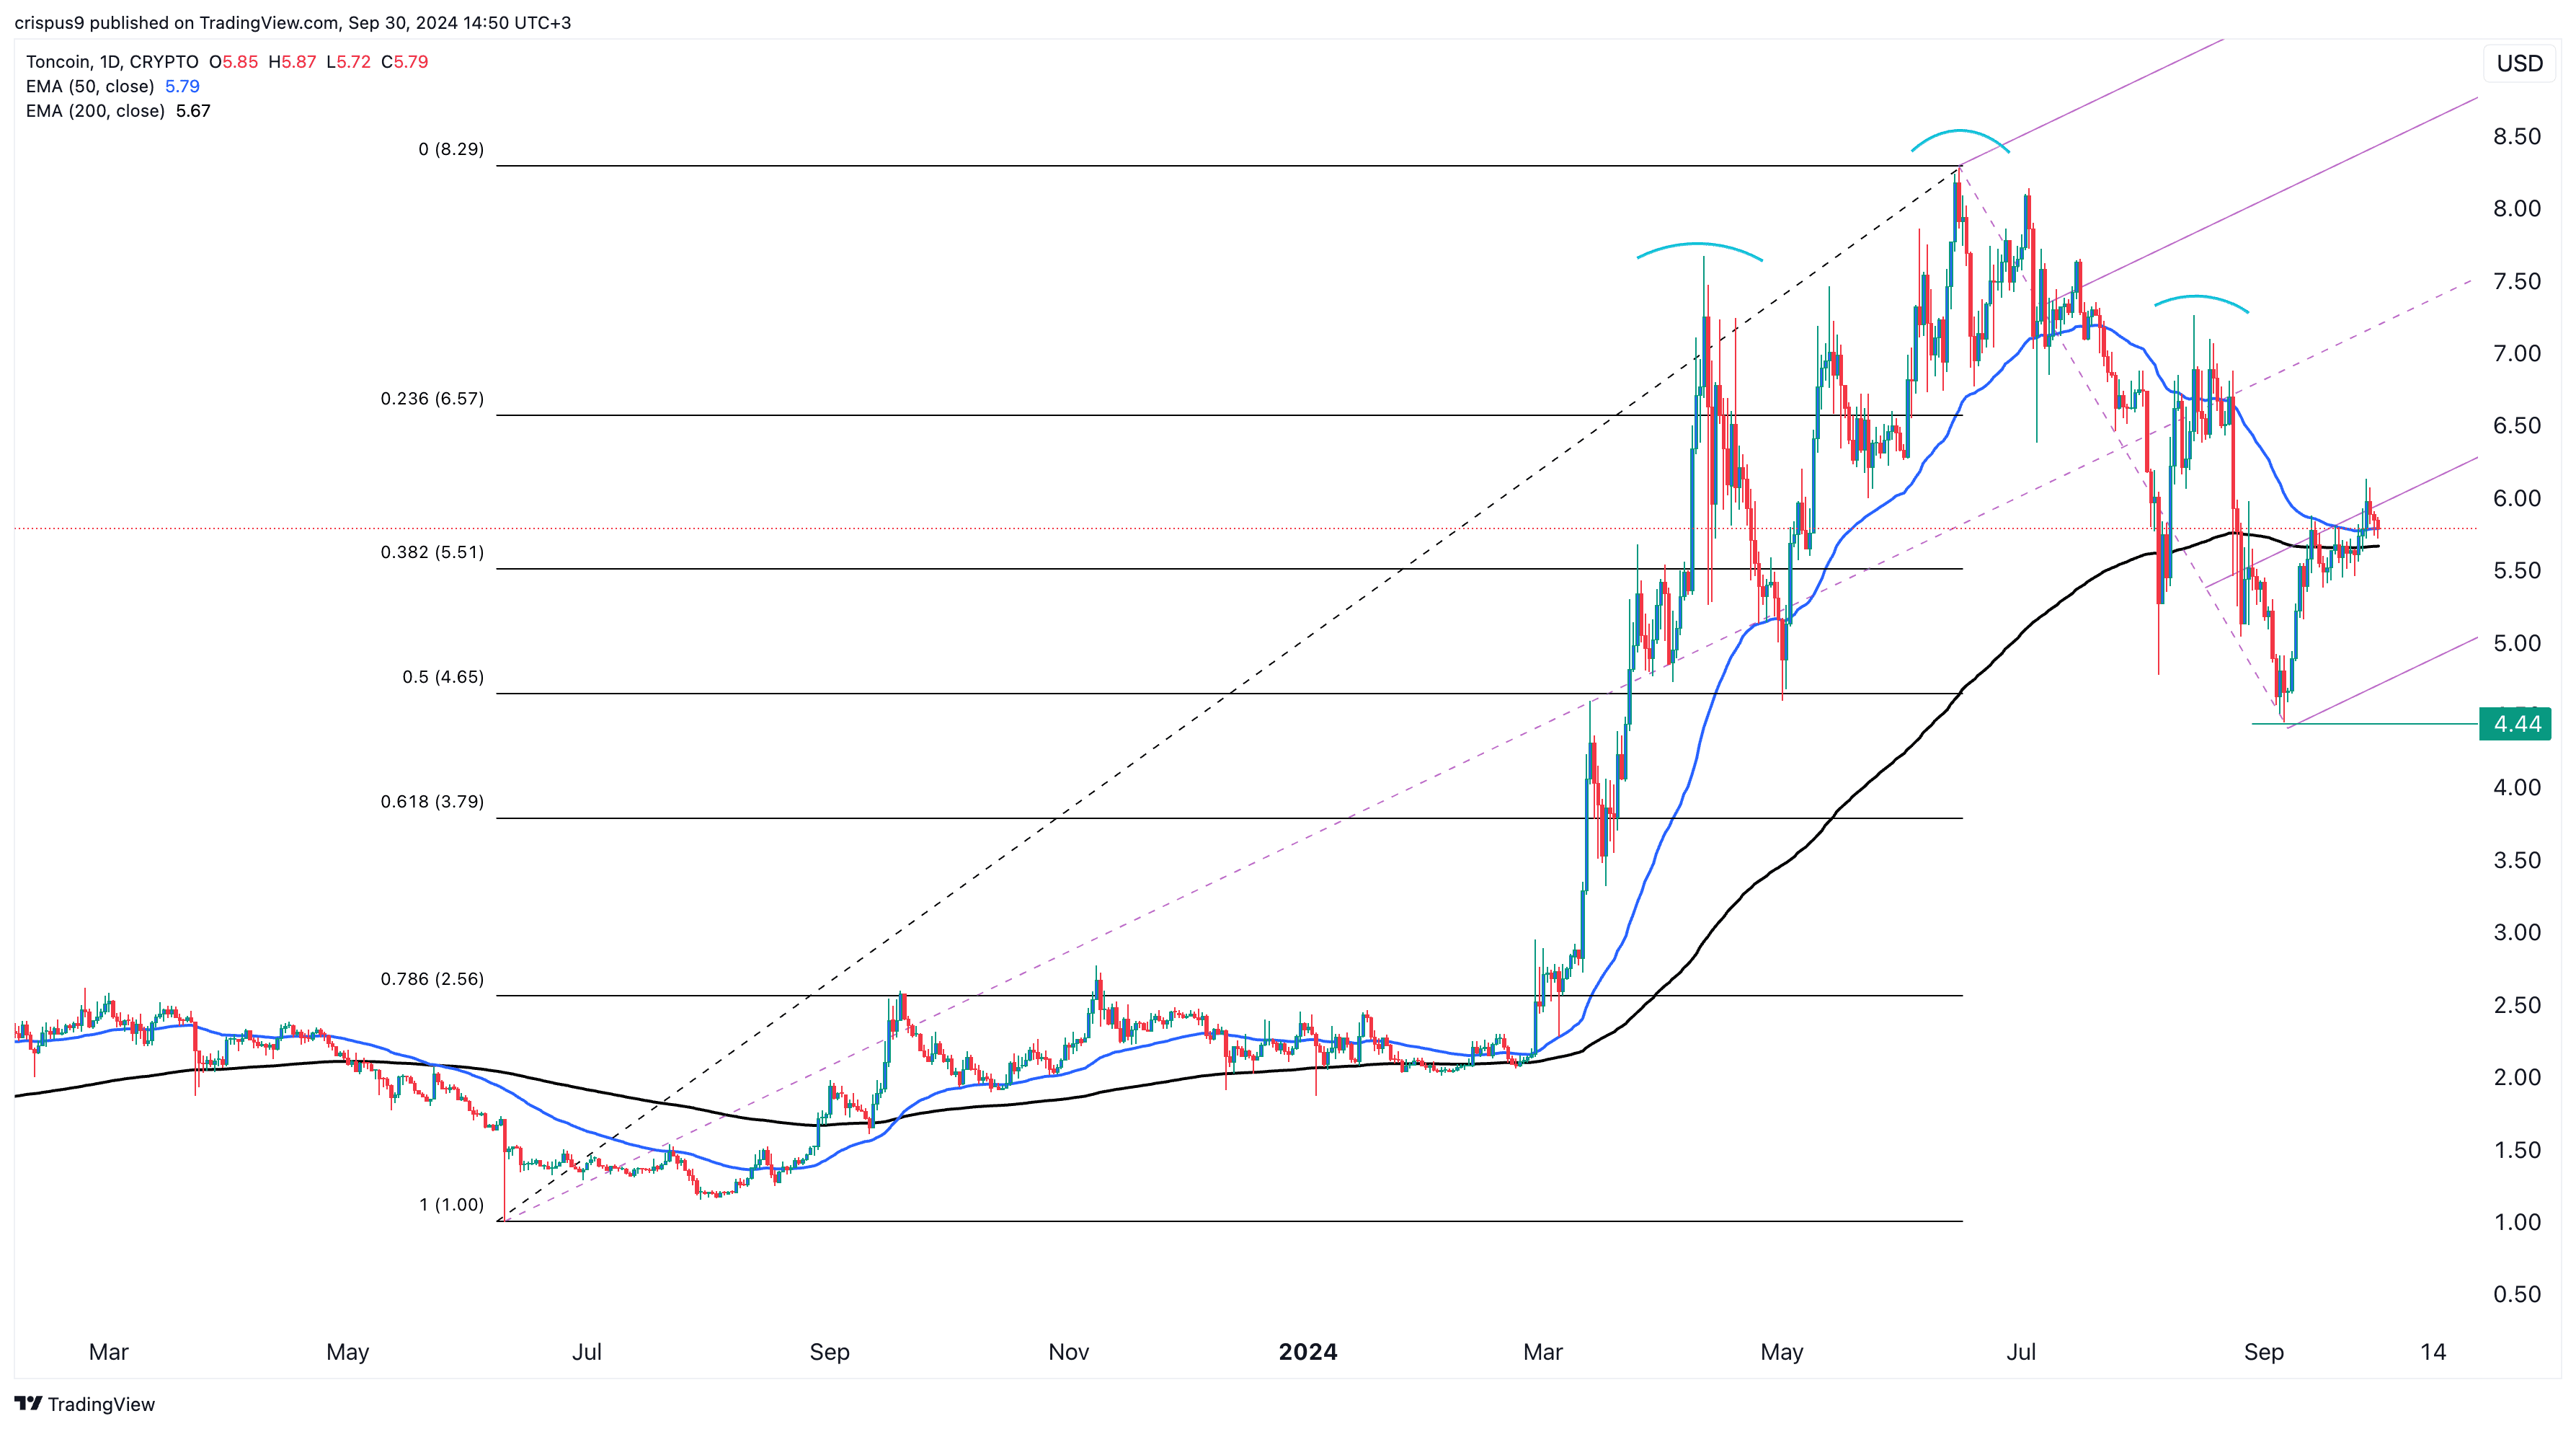
Toncoin’s token has dropped by over 30% from its year-to-date high, and the 50-day and 200-day Exponential Moving Averages are close to forming a death cross pattern. The last time it formed this pattern in May of last year, it resulted in a drop of over 50%.
TON has also formed a head and shoulders and a rounded top pattern. It remains below the first support level of the Andrew’s pitchfork tool and the 23.6% Fibonacci Retracement level.
Therefore, Toncoin may have a bearish breakout to the next key support at $4.45, its lowest point in September, unless it moves above the 50-day and 200-day moving averages.
Source link

The Bitcoin Pi Cycle Top Indicator: How to Accurately Time Market Cycle Peaks
Bitcoin Breakout At $93,257 Barrier Fuels Bullish Optimism

Bitcoin Approaches $100K; Retail Investors Stay Steady

Solana Hits New ATH On Huge Whale Accumulation, More Gains Ahead?

Microsoft Should Buy $78 Billion Worth of Bitcoin

Ethereum Believers May Be Staring Down Opportunity As ETH Reaches Another Low Against Bitcoin: CryptoQuant CEO

UK government is ready for crypto regulations next year

“Crypto Dad” Chris Giancarlo Emerges Top For White House Crypto Czar Role

Bitcoin Nears $100,000 As Trump Council Expected To Implement BTC Reserve

Know Your Missiles: Russia’s Experimental Hypersonic Missile Is A New Kind of Killing Machine

Polkadot investor predicts a 30,000% rally for this $0.04 token by 2025

Donald Trump Proposed Crypto Advisory Council To Set Up Strategic Bitcoin Reserve

Want Greater Bitcoin Adoption? Engage With Your Government.

Why the Media Loves the Worst of Crypto

HashCats prepares for Token Generation Event after completing mining season
182267361726451435

Top Crypto News Headlines of The Week

Why Did Trump Change His Mind on Bitcoin?

New U.S. president must bring clarity to crypto regulation, analyst says

Ethereum, Solana touch key levels as Bitcoin spikes

Bitcoin Open-Source Development Takes The Stage In Nashville

Will XRP Price Defend $0.5 Support If SEC Decides to Appeal?

Bitcoin 20% Surge In 3 Weeks Teases Record-Breaking Potential

Ethereum Crash A Buying Opportunity? This Whale Thinks So

Shiba Inu Price Slips 4% as 3500% Burn Rate Surge Fails to Halt Correction

‘Hamster Kombat’ Airdrop Delayed as Pre-Market Trading for Telegram Game Expands

Washington financial watchdog warns of scam involving fake crypto ‘professors’

Citigroup Executive Steps Down To Explore Crypto
Mostbet Güvenilir Mi – Casino Bonus 2024

Bitcoin flashes indicator that often precedes higher prices: CryptoQuant
Trending

 2 months ago
182267361726451435

 24/7 Cryptocurrency News3 months ago
Top Crypto News Headlines of The Week

 Donald Trump4 months ago
Why Did Trump Change His Mind on Bitcoin?

 News3 months ago
New U.S. president must bring clarity to crypto regulation, analyst says

 Bitcoin4 months ago
Ethereum, Solana touch key levels as Bitcoin spikes

 Opinion4 months ago
Bitcoin Open-Source Development Takes The Stage In Nashville

 Price analysis3 months ago
Will XRP Price Defend $0.5 Support If SEC Decides to Appeal?

 Bitcoin4 months ago
Bitcoin 20% Surge In 3 Weeks Teases Record-Breaking Potential


