Markets
Bitcoin Price Action: What to Expect Next
Published
2 months agoon
By
admin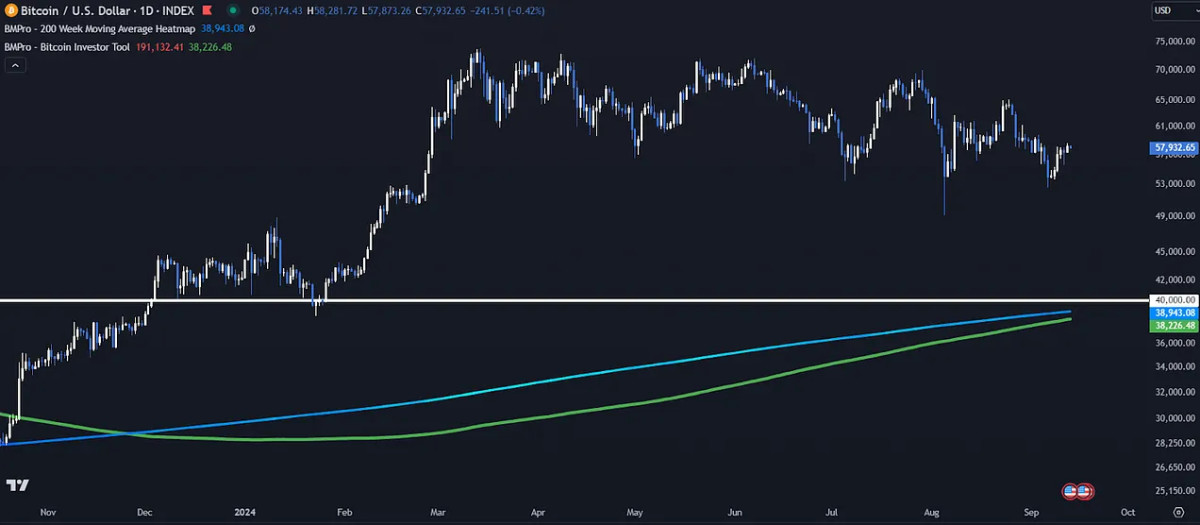
Bitcoin’s recent price movements have caused concern among investors about what might come next. However, by looking at key indicators such as the 200-week moving average, Pi Cycle Top Indicator, and the Golden Ratio Multiplier, we can gain insights into potential support and resistance levels for Bitcoin.
Leaning Bearish?
In recent weeks, Bitcoin’s price has fluctuated, dipping as low as $53,000 before stabilizing in the middle of our newly formed $50,000 to $60,000 range. If this bearish price action is to continue and price breaks to lower lows the 200-week moving average heatmap (blue line), a historically critical support level, is currently close to $39,000 but fast approaching $40,000 (white line). This round psychological level also aligns with the Bitcoin Investor Tool (green line), which has also converged with the 200-week moving average, could serve as potential downside targets.

Nearby Targets
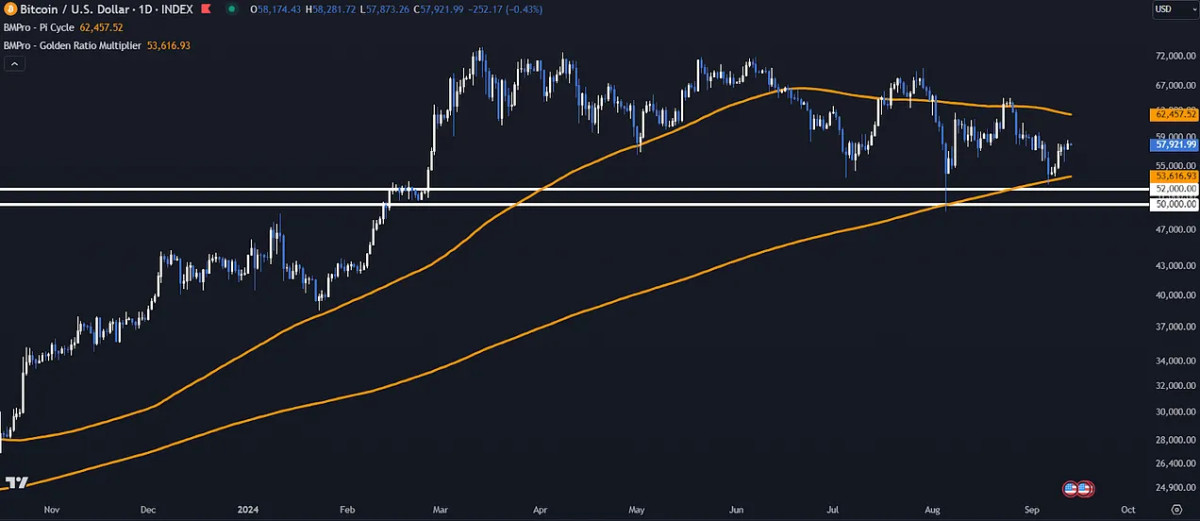
Above current price there are several important levels closer to the current price that investors need to keep an eye on. The Pi Cycle Top Indicator (upper orange line) suggests a crucial resistance level around $62,000, based on the 111-day moving average. The Golden Ratio Multiplier (lower orange line) indicates that the 350-day moving average, currently around $53,000, has been a solid level of support during this market cycle, especially as this is close to the technical $52,000 support and significant psychological support of $50,000.
More Chop?
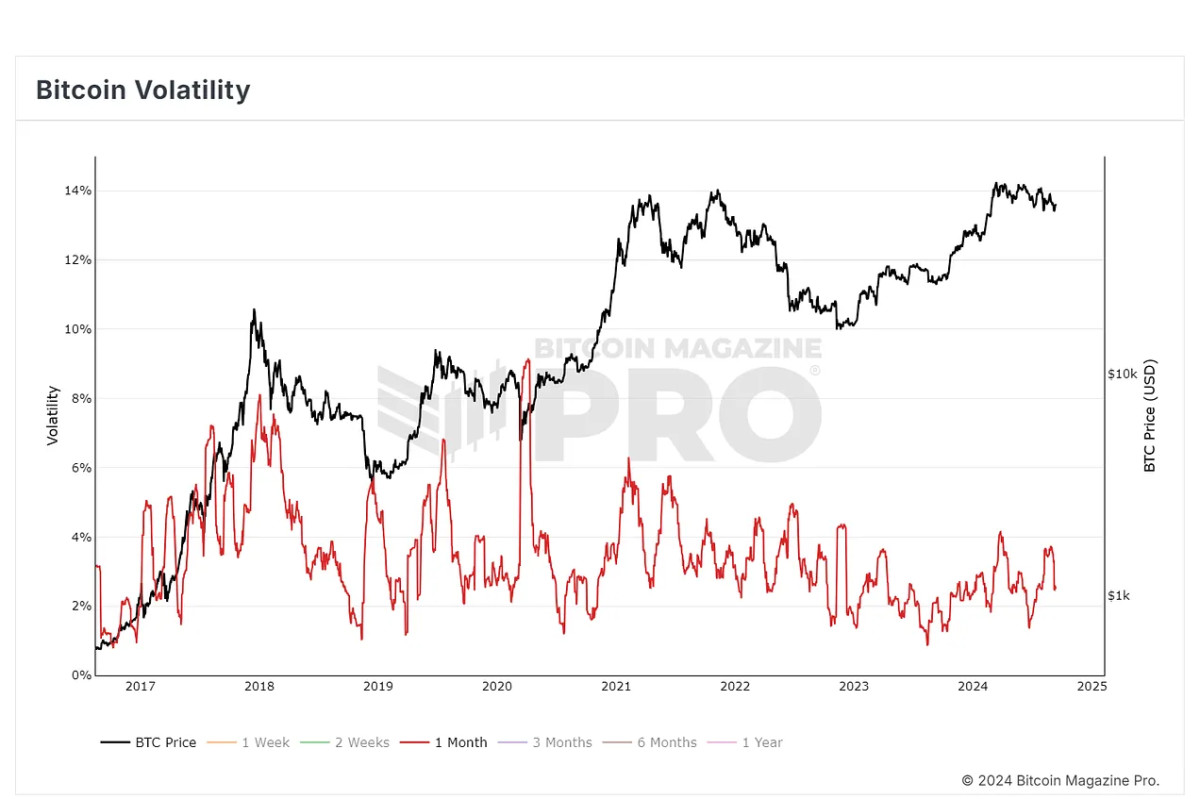
In the short term, Bitcoin could very well continue ranging between the low $50,000 region and the $60,000 resistance, similar to the range we had formed between $70,000 and $60,000 that led to fairly stagnant price action for a majority of 2024. Despite recent downturns, Bitcoin’s long-term outlook is still promising. In the past, Bitcoin has experienced similar periods of fluctuating prices before eventually reaching new highs. However, this process can take some time, potentially weeks or even months, before a sustainable trend reversal occurs following periods of low volatility.
Conclusion
For long-term investors, it’s important to remain calm and not be swayed by day-to-day price changes. Over-trading often leads to poor decisions and losses, and the key is to stick to a strategy, whether it involves accumulating at support levels or taking profits at resistance.
Bitcoin’s recent price action has not been ideal, but with some simple technical analysis and a clear understanding of support and resistance levels, investors can prepare and react rather than over overreact to natural market fluctuations.
For a more in-depth look into this topic, check out our recent YouTube video here: Bitcoin Price Action: What to Expect Next
Source link
You may like


Want Greater Bitcoin Adoption? Engage With Your Government.


Why the Media Loves the Worst of Crypto


HashCats prepares for Token Generation Event after completing mining season


Gary Gensler To Step Down As US SEC Chair In January


The Chart That Shows Bitcoin’s Bull Run Won’t Stop at $100,000


$2 Million PEPE Purchase Sees 105 Billion Tokens Snapped Up
Markets
The Chart That Shows Bitcoin’s Bull Run Won’t Stop at $100,000
Published
5 hours agoon
November 21, 2024By
admin
Peak Bitcoin, hardly.

https://x.com/pete_rizzo_/
As I wrote in Forbes in 2021, the world is waking up to a new reality in regards to Bitcoin – the unlikely truth that Bitcoin’s programming has cyclical effects on its economy.
This has led to at least 4 distinct market cycles where Bitcoin has been branded a bubble, skeptics have rung their hands, and each time, Bitcoin recovers more or less 4 years later to set new all-time highs above its previously “sky-high” valuation.
I personally watched Bitcoin go from $50 to $1,300 in 2013. Then, from $1,000 to $20,000 in 2017, and I watched it go from $20,000 to $70,000 in 2021.
So, I’m just here to relate that, from my past experience, this market cycle is just heating up.
For those who have been in Bitcoin, there’s one tried-and-true and that’s Google Search. As long as I’ve been in Bitcoin, this has been the best indicator of the strength of the market.
Search is low, you’re probably in a bear market. Search heading back to all-time highs? This means new entrants are getting engaged, learning about Bitcoin, and becoming active buyers.
Remember, this is a habit change. Bitcoin HODLers are slowing shifting their assets to a wholly new economy. So, Google Trends search then, represents a snapshot of Bitcoin’s immigration. It shows how many new sovereign citizens are moving their money here.
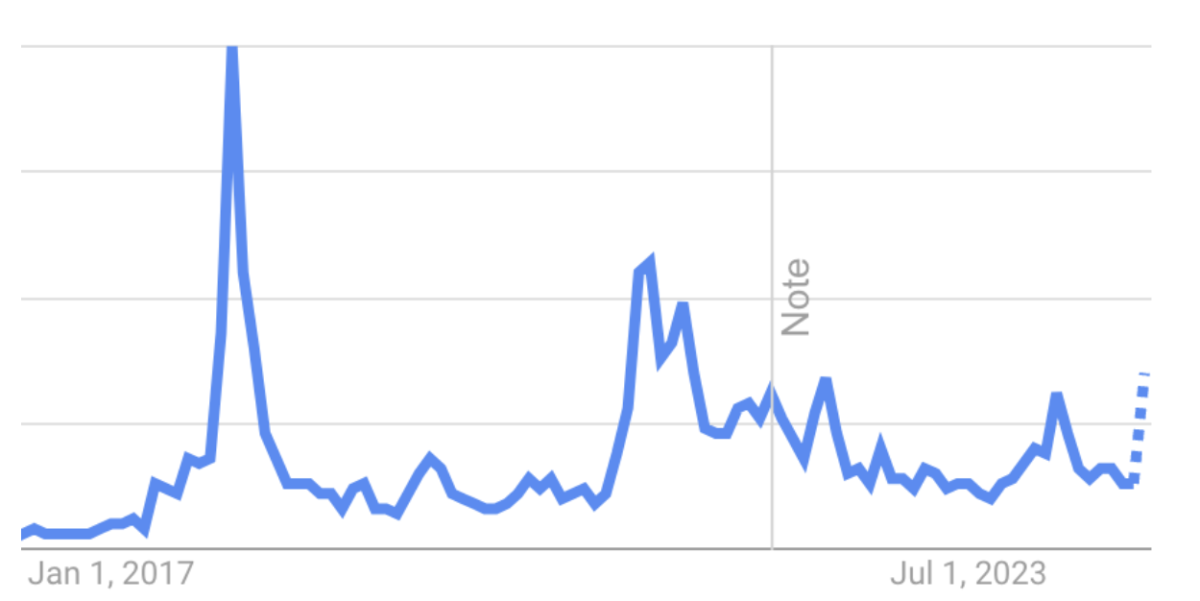
And it’s something that all who are worried about whether bitcoin’s price topping out in 2024 should pay attention to.
Last year was the Bitcoin halving, and historically, the year following previous halvings has led to price appreciation. Maybe you’re tempted to think, “this time is different” – not me. I look at search and I see a chart that continues to accelerate into price discovery. Trust me when I say no one I know is selling bitcoin.
As shown above, buyer interest is accelerating, and these new buyers have to buy that Bitcoin from somewhere. Add nation states, US states, and a coming Trump administration set to ease the burden on the industry?
Well, I think the chart above says it all really.
This article is a Take. Opinions expressed are entirely the author’s and do not necessarily reflect those of BTC Inc or Bitcoin Magazine.
Source link
Bitcoin
Bitcoin Nears $96K, Continuing Wild ‘Trump Trade’ Rally
Published
17 hours agoon
November 21, 2024By
admin

BTC traded above $95,900 in early Asian hours, less than 6% from a landmark $100,000 figure that would push it above a $2 trillion market capitalization.
Source link
Bitcoin
Bitcoin Boosts MicroStrategy (MSTR) to Higher Trading Volume Than Tesla and Nvidia
Published
1 day agoon
November 20, 2024By
admin

Today, MicroStrategy (MSTR) surpassed a $100 billion market cap to become the 93rd largest publicly-traded company in the U.S.
At the time of writing, MSTR has done more trading volume than both stock giants Tesla and Nvidia today, and has traditional stock traders like the Wall Street Bets community losing their minds.
Wow $MSTR is the most traded stock in America today.. to best $TSLA and $NVDA is crazy. It's been years since a stock has traded more than one of those two (it may have actually been $GME to last do it). It's also about double $SPY! Wild times.. pic.twitter.com/bUr8nycMX3
— Eric Balchunas (@EricBalchunas) November 20, 2024
This is absolutely mindblowing considering MicroStrategy was a mere $1 billion company when it first bought bitcoin for its treasury about four and a half years ago.
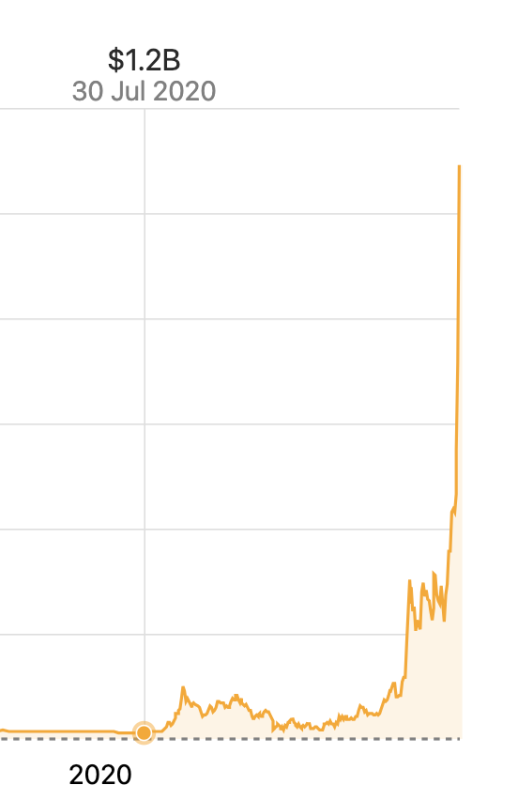
The big question I’m asking myself is, how and when does this end? Assuming MSTR continues to pump until the peak of this bull market, it’s anyone’s guess on how high MSTR may go.
But how hard will it crash in the bear market, considering it is essentially a leveraged trade on bitcoin? Dare I even suggest that this time may be different, and that the downside of the next bitcoin bear market won’t be as brutal as the 70%+ corrections we’re historically used to seeing?
Even with the spot bitcoin ETFs, and the notion that the US may lead the charge of nation states buying up mass amounts of bitcoin, I’m still not convinced that we don’t eventually see a massive downturn in bitcoin’s price. And I’m mentally preparing for a normal bitcoin bear market to commence after this bull market finishes sometime in the next year or so.
But back to MSTR — Michael Saylor has thus far proven that the Bitcoin for Corporations strategy works in stunning fashion. Public companies have been coming out of the woodwork this past week announcing that they’ve purchased bitcoin for their balance sheet or plan to do so, and it seems this trend will continue as the CEO of Rumble asked his X audience if he should add BTC to their balance sheet (almost 94% of his 42,522 voters voted “yes”).
Lets put this in a poll format…
Should Rumble add Bitcoin to its balance sheet?
— Chris Pavlovski (@chrispavlovski) November 19, 2024
Michael Saylor even offered to help explain how and why Rumble should adopt a corporate BTC strategy.
Institutional bitcoin adoption is here and it’s only going to grow for the foreseeable future. As companies figure out the logic behind adopting bitcoin as a strategic reserve asset, the number of publicly-traded companies that adopt this strategy is going to explode.
Companies that add bitcoin to their balance sheet will rise above most other companies — even top big tech giants — in terms of trading volume, as MicroStrategy has, until all companies add bitcoin to their balance sheet. I try to put myself in the shoes of a trader, with knowledge on Bitcoin and think to myself, “Why on earth would I buy any company’s stock if they don’t have bitcoin on their balance sheet?” I wouldn’t — it would be way too boring.
Putting BTC on the balance sheet helps create volatility, and therefore opportunity for stock traders, which is good for the traders, stock price, and company overall. If you are a publicly-traded company, it is a no brainer to adopt bitcoin as a treasury reserve asset.
This article is a Take. Opinions expressed are entirely the author’s and do not necessarily reflect those of BTC Inc or Bitcoin Magazine.
Source link

Want Greater Bitcoin Adoption? Engage With Your Government.

Why the Media Loves the Worst of Crypto

HashCats prepares for Token Generation Event after completing mining season

Gary Gensler To Step Down As US SEC Chair In January

The Chart That Shows Bitcoin’s Bull Run Won’t Stop at $100,000

$2 Million PEPE Purchase Sees 105 Billion Tokens Snapped Up

XRP price expected to reach $7, Dogecoin $3, and PCHAIN $1 from $0.004

Bitcoin Miner MARA Holdings Raises $1B To Buy More Bitcoin

Sui Network blockchain down for more than two hours

Analyst Says Six-Figure Bitcoin Price Incoming – But Warns One Factor Could Delay BTC Rally Till Next Year

How Will BTC React to $3B Buying Spree?

ECB official calls for urgency on digital euro amid global CBDC race

The Story Behind a Crypto Trader Turning $378K into $35.2M

Justin Sun Goes Bananas: Snags Controversial “Comedian” Artwork for $6.4 Million

Get ready for new spot ETFs, hints President Nate Geraci
182267361726451435

Top Crypto News Headlines of The Week

Why Did Trump Change His Mind on Bitcoin?

New U.S. president must bring clarity to crypto regulation, analyst says

Ethereum, Solana touch key levels as Bitcoin spikes

Bitcoin Open-Source Development Takes The Stage In Nashville

Will XRP Price Defend $0.5 Support If SEC Decides to Appeal?

Bitcoin 20% Surge In 3 Weeks Teases Record-Breaking Potential

Ethereum Crash A Buying Opportunity? This Whale Thinks So

Shiba Inu Price Slips 4% as 3500% Burn Rate Surge Fails to Halt Correction

‘Hamster Kombat’ Airdrop Delayed as Pre-Market Trading for Telegram Game Expands

Washington financial watchdog warns of scam involving fake crypto ‘professors’

Citigroup Executive Steps Down To Explore Crypto
Mostbet Güvenilir Mi – Casino Bonus 2024

Bitcoin flashes indicator that often precedes higher prices: CryptoQuant
Trending

 2 months ago
182267361726451435

 24/7 Cryptocurrency News3 months ago
Top Crypto News Headlines of The Week

 Donald Trump4 months ago
Why Did Trump Change His Mind on Bitcoin?

 News3 months ago
New U.S. president must bring clarity to crypto regulation, analyst says

 Bitcoin4 months ago
Ethereum, Solana touch key levels as Bitcoin spikes

 Opinion4 months ago
Bitcoin Open-Source Development Takes The Stage In Nashville

 Price analysis3 months ago
Will XRP Price Defend $0.5 Support If SEC Decides to Appeal?

 Bitcoin4 months ago
Bitcoin 20% Surge In 3 Weeks Teases Record-Breaking Potential


