Bitcoin
Bitcoin Indicator Signals ‘Shift To Bullish Territory’ – Can BTC Break Past $65,000?
Published
2 months agoon
By
admin
Bitcoin has experienced a significant price surge since Tuesday, following the Federal Reserve’s announcement of a 50 bps interest rate cut. This move pushed BTC past the critical $62,000 mark, a psychological level that has become a turning point for investor sentiment. With Bitcoin now testing local supply, market participants are closely watching for further upside potential.
Related Reading
As the price continues to push higher, analysts are pointing to crucial data indicating a potential shift in Bitcoin’s trend after months of downtrend price action. Glassnode metrics reveal a notable trend change, suggesting BTC may be entering bullish territory once again. This resurgence is drawing increased attention from both retail and institutional investors as they evaluate whether Bitcoin’s rally has staying power or if the market will face resistance at higher levels.
With renewed momentum, the coming days will be critical in determining if Bitcoin can sustain this upward trajectory and fully break out of its previous bearish phase.
Bitcoin Signals A Bullish Return
Bitcoin investors have seen sentiment shift dramatically from fearful to hopeful in just a few days. Following the Federal Reserve’s rate cut announcement on Wednesday, Bitcoin surged over 8%, breaking critical levels and testing local supply. This sudden price action has sparked renewed optimism in the broader crypto market, giving investors hope for a fresh start after months of bearish price movement.
Prominent crypto analyst Ali Martinez has shared valuable insights on X, drawing attention to key data from Glassnode that suggests a significant shift in Bitcoin’s price trend. Specifically, Ali highlights the Market Value to Realized Value (MVRV) ratio, which tracks the difference between BTC’s market price and its actual value.
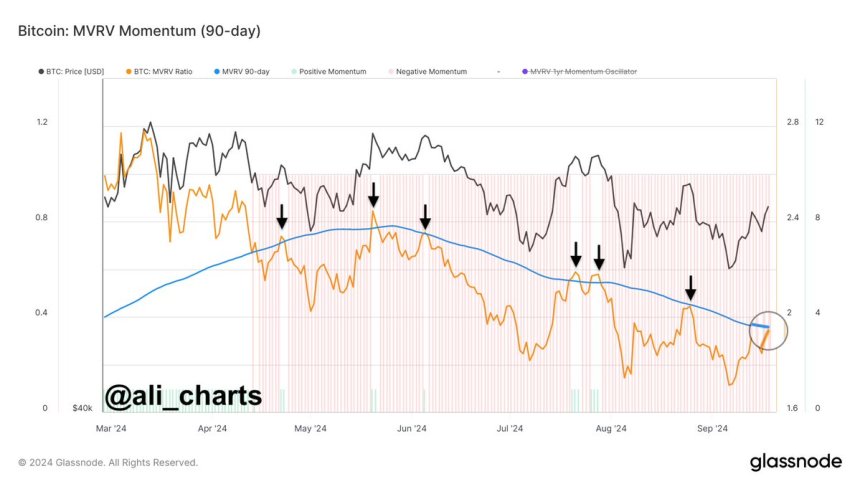
The MVRV ratio, which had been in a downtrend since April, is now rising, signaling that Bitcoin may be regaining strength. Ali notes that the MVRV is a critical indicator for assessing momentum, and the current upward trend hints at a potential return to bullish territory.
Related Reading
The analyst further explains that if the MVRV can close above its 90-day moving average, it would confirm a stronger bullish outlook for Bitcoin. Given the aggressive price surge and the increasing demand reflected in recent price action, this scenario seems increasingly likely. Investors are now watching closely, as Bitcoin’s next moves could mark the beginning of a new bull phase.
Technical Levels To Watch
Bitcoin (BTC) is trading at $63,024 after days of consistent “only up” price action since hitting local lows. The price recently broke above the daily 200 exponential moving average (EMA) at $59,350 and is now testing the critical daily 200 moving average (MA) at $63,954.
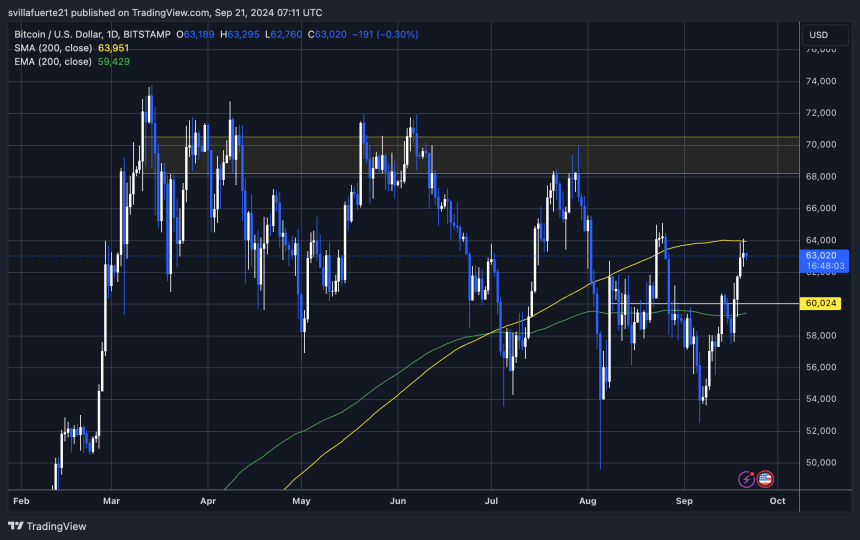
This daily 200 MA is a key long-term indicator, signaling overall market strength. If Bitcoin can reclaim this level as support, it would likely trigger a significant price surge, bolstering the bullish outlook.
Related Reading
For bulls to maintain momentum, the next target would be around this critical level, with a potential push toward $65,000, a price last tested in late August. However, should BTC fail to hold above $60,000 in the coming days, investors may see a retracement to lower demand levels. The ability to stay above key support zones will determine the next phase of price action.
Featured image from Dall-E, chart from TradingView
Source link
You may like


SHIB Lead Shytoshi Kusama Hints At TREAT Token Launch


Trader Says Top-10 Altcoin To Vastly Outperform Bitcoin and Ethereum, Hit New Record High Quicker Than Expected


5 tokens to consider buying today


Terra Luna Classic Community Discord On Proposal Amid LUNC Price Rally


Trump Nominates Pro-Crypto Hedge Fund Manager Scott Bessent as Treasury Secretary


Dogecoin surges 10% as this new altcoin shakes the market, and preps for stage 2 presale
Bitcoin
Trader Says Top-10 Altcoin To Vastly Outperform Bitcoin and Ethereum, Hit New Record High Quicker Than Expected
Published
2 hours agoon
November 23, 2024By
admin
A widely followed cryptocurrency analyst and trader is turning bullish on a large-cap altcoin that has more than doubled in price over the past two weeks.
The analyst pseudonymously known as Credible Crypto tells his 436,700 followers on the social media platform X that XRP is primed to reach a new all-time high a “lot quicker than most are expecting.”
“And I think it’s going to vastly outperform both Bitcoin and Ethereum from current levels while doing it.”
XRP is trading at $1.41 at time of writing, up by around 156% over the past two weeks.
Credible Crypto further says that XRP is on the cusp of entering the overbought zone of the Relative Strength Index (RSI) indicator on the monthly time frame. The RSI indicator, which is calibrated from 0 to 100, is used to determine overbought or oversold conditions, with levels between 70 to 100 indicating overbought conditions and levels between 0 to 30 indicating oversold conditions.
“This is bullish as f**k.
Contrary to popular belief, the higher RSI goes, the stronger the momentum is and the more bullish a coin is (absent bearish divergences) and like every other form of technical analysis the higher the time frame this is on, the more significant it is.
Next target is $2 and after that, we go for a new all-time high.”

According to the pseudonymous analyst, XRP also appears highly bullish in its Ethereum (ETH) pair and could be poised for triple-digit percentage gains against the second-largest crypto asset.
“XRP/ETH just reclaimed and retested a four-year-long range, with the first target being ~250% higher.”
Don’t Miss a Beat – Subscribe to get email alerts delivered directly to your inbox
Check Price Action
Follow us on X, Facebook and Telegram
Surf The Daily Hodl Mix
 

Disclaimer: Opinions expressed at The Daily Hodl are not investment advice. Investors should do their due diligence before making any high-risk investments in Bitcoin, cryptocurrency or digital assets. Please be advised that your transfers and trades are at your own risk, and any losses you may incur are your responsibility. The Daily Hodl does not recommend the buying or selling of any cryptocurrencies or digital assets, nor is The Daily Hodl an investment advisor. Please note that The Daily Hodl participates in affiliate marketing.
Generated Image: Midjourney
Source link

Bitcoin Cash (BCH) added nearly 35% to its value in the past month and rallied 12% on Nov. 21. Bitcoin’s (BTC) observed a rally to $98,384 early on Nov. 21, with BCH and other top cryptocurrencies tagging along for the ride.
An analysis of on-chain and technical indicators and data from the derivatives market shows that BCH could extend gains and retest its mid-April 2024 peak of $569.10.
Bitcoin hits all-time high, fork from 2017 ignites hope for traders
Bitcoin hit a record high of $98,384 on Nov. 21, a key milestone as the cryptocurrency eyes a run to the $100,000 target. BTC was forked in 2017, creating a spin-off or alternative, Bitcoin Cash.
BCH hit a peak of $1,650 in May 2021. Since April 2024, BCH has been consolidating with no clear trend formation.
BCH price rallied nearly 30% since Nov. 15, on-chain indicators show that further rally is likely in the Bitcoin spin-off token.
Bitcoin Cash’s active addresses have climbed consistently since August 2024. Santiment data shows an uptrend in active addresses, meaning BCH traders have sustained demand for the token, supporting a bullish thesis for the cryptocurrency.
The ratio of daily on-chain transaction volume in profit to loss exceeds 2, is 2.141 on Thursday. BCH traded on-chain noted twice as many profitable transactions on the day, as the ones where losses were incurred. This is another key metric that paints a bullish picture for the token forked from Bitcoin.
Binance funding rate is positive since Nov. 10. In the past eleven days, traders have been optimistic about gains in BCH price, according to Santiment data.

The network realized profit/loss metric identifies the net gain or loss of all traders who traded the token within a 24 hour period. NPL metric for Bitcoin Cash shows traders have been taking profits on their holdings, small positive spikes on the daily price chart represent NPL.
Investors need to keep their eyes peeled for significant movements in NPL, large positive spikes imply heavy profit-taking activities that could increase selling pressure across exchange platforms.
84.48% of Bitcoin Cash’s supply is currently profitable, as of Nov. 21. This metric helps traders consider the likelihood of high profit-taking or exits from existing BCH holders, to time an entry/ exit in spot market trades.

Derivatives traders are bullish on BCH
Derivatives market data from Coinglass shows a 33% increase in open interest in Bitcoin Cash. Open interest represents the total number of active contracts that haven’t been settled, representing demand for the BCH token among derivatives traders.
Derivatives trade volume climbed 613% in the same timeframe, to $2.35 billion. Across exchanges, Binance and OKX, the long/short ratio is above 1, closer to 2, meaning traders remain bullish on BCH and expect prices to rally.

BCH futures open interest chart shows a steady increase in the metric, alongside BCH price gain since November 5, 2024. Open interest climbed from $190.74 million to $254.87 million between November 5 and 21.

Technical indicators show BCH could gain 18%
The BCH/USDT daily price chart on Tradingview.com shows that the token remains within the consolidation. The token is stuck within a range from $272.70 to $568.20. BCH could attempt to break past the upper boundary of the range, a daily candlestick close above $568.20 could confirm the bullish breakout.
The April 2024 high of $719.50 is the next major resistance for BCH and the second key level is at $805.80, a key level from May 2021.
The relative strength index reads 64, well below the “overvalued” zone above 70. RSI supports a bullish thesis for BCH. Another key momentum indicator, moving average convergence divergence flashes green histogram bars above the neutral line. This means BCH price trend has an underlying positive momentum.
The awesome oscillator is in agreement with the findings of RSI and MACD, all three technical indicators point at likelihood of gains.

A failure to close above the upper boundary of the range could invalidate the bullish thesis. BCH could find support at the midpoint of the range at $419.90 and the 50-day exponential moving average at $388.50.
Disclosure: This article does not represent investment advice. The content and materials featured on this page are for educational purposes only.
Source link
Bitcoin
Bitcoin Breakout At $93,257 Barrier Fuels Bullish Optimism
Published
1 day agoon
November 22, 2024By
adminBitcoin has shattered expectations once again, surging past the critical $93,257 level in a display of unstoppable momentum. This breakout has ignited fresh waves of bullish optimism across the crypto market, as traders and investors anticipate greater gains. With market sentiment shifting and key indicators aligning, could this be the spark for Bitcoin’s next major rally?
As optimism steadily increases in the market, the goal is to take a closer look at BTC’s impressive breakout above the $93,257 mark, analyze the positive sentiment driving its climb, and assess the potential for continued upward strength in the market.
Bullish Indicators: What’s Fueling BTC’s Uptrend?
Currently, on the 4-hour chart, BTC is sustaining its position after successfully surpassing the $93,257 mark while trading above the 100-day Simple Moving Average (SMA). By maintaining its position above this level and the 100-day SMA, BTC demonstrates resilience and capability for more price growth, targeting new highs.
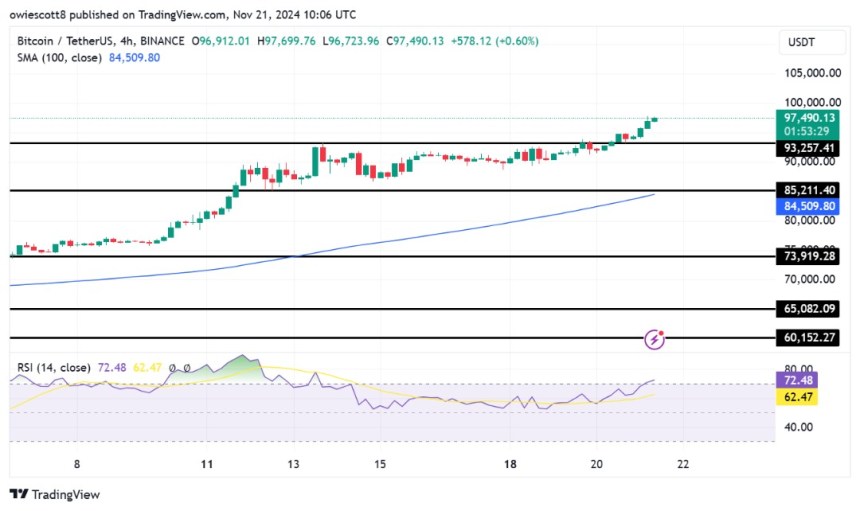
An analysis of the 4-hour Relative Strength Index (RSI) shows a significant surge, climbing to 70% from its previous low of 56%, indicating strong bullish pressure for BTC. While this increase signals growing positive market sentiment, it raises concerns about the rally’s sustainability since a price correction could occur if profit-taking ensues.
Bitcoin is showing strong positive movement after breaking past the $93,257 level, supported by a rise above the 100-day SMA, reflecting sustained bullish strength and potential for continued upward movement. The fact that BTC is consistently above the 100-day SMA suggests a solid trend and that the bulls are eager to push prices higher, possibly leading to an extended growth if pressure continues to build.
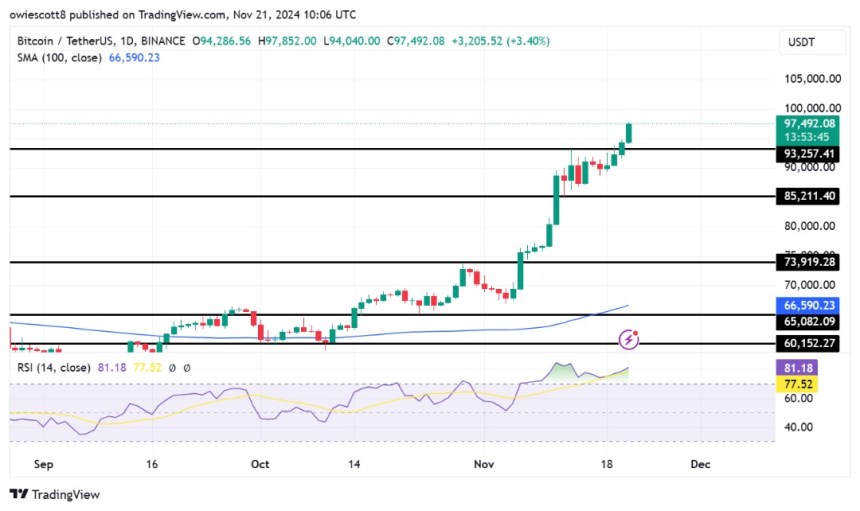
Finally, the RSI on the daily chart is currently at 81%, well above the key 50% threshold, signaling a strong uptrend for Bitcoin. With the RSI at this level, it suggests that the upside pressure is likely to continue, which means that Bitcoin’s price could keep rising in the near term, as there are no signs of a reversal or decline.
What The $93,257 Breakout Signals For Bitcoin
The $93,257 breakout opens the door to a more optimistic future outlook for Bitcoin. This key resistance level has been decisively breached, suggesting that BTC may continue its upbeat momentum, potentially targeting higher price levels such as the $100,000 mark and beyond.
However, careful monitoring is essential for any signs of resistance or market corrections that could hinder its ascent. Should such a scenario occur, Bitcoin’s price could begin to drop toward the $93,257 mark. A break below this level might trigger further declines, possibly testing additional support levels in the process.
Source link

SHIB Lead Shytoshi Kusama Hints At TREAT Token Launch

Trader Says Top-10 Altcoin To Vastly Outperform Bitcoin and Ethereum, Hit New Record High Quicker Than Expected

5 tokens to consider buying today

Terra Luna Classic Community Discord On Proposal Amid LUNC Price Rally

Trump Nominates Pro-Crypto Hedge Fund Manager Scott Bessent as Treasury Secretary

Dogecoin surges 10% as this new altcoin shakes the market, and preps for stage 2 presale

Ripple CEO Shares Bullish News With XRP Army As Trump Names Treasury Secretary

On-Chain Data Shows The Bitcoin Price Bull Run is Far From Over

Trump Picks Pro-Crypto Hedge Fund Manager Scott Bessent for Treasury Secretary

Crypto millionaires will be made by April 2025: 6 coins to hold

Cardano Price Hits $1 But Analyst Says This Is Just The Start

Legacy Media’s Transformation: Why Evolution Beats Extinction

Massive Ethereum Buying Spree – Taker Buy Volume hits $1.683B In One Hour

Ethereum lags behind Bitcoin but is expected to reach $14K, boosting RCOF to new high

Bitcoin Miner MARA Buys Another 5771 BTC As Price Nears $100k
182267361726451435

Top Crypto News Headlines of The Week

Why Did Trump Change His Mind on Bitcoin?

New U.S. president must bring clarity to crypto regulation, analyst says

Ethereum, Solana touch key levels as Bitcoin spikes

Will XRP Price Defend $0.5 Support If SEC Decides to Appeal?

Bitcoin Open-Source Development Takes The Stage In Nashville

Bitcoin 20% Surge In 3 Weeks Teases Record-Breaking Potential

Ethereum Crash A Buying Opportunity? This Whale Thinks So

Shiba Inu Price Slips 4% as 3500% Burn Rate Surge Fails to Halt Correction

‘Hamster Kombat’ Airdrop Delayed as Pre-Market Trading for Telegram Game Expands

Washington financial watchdog warns of scam involving fake crypto ‘professors’

Citigroup Executive Steps Down To Explore Crypto
Mostbet Güvenilir Mi – Casino Bonus 2024

Bitcoin flashes indicator that often precedes higher prices: CryptoQuant
Trending

 2 months ago
182267361726451435

 24/7 Cryptocurrency News3 months ago
Top Crypto News Headlines of The Week

 Donald Trump4 months ago
Why Did Trump Change His Mind on Bitcoin?

 News3 months ago
New U.S. president must bring clarity to crypto regulation, analyst says

 Bitcoin4 months ago
Ethereum, Solana touch key levels as Bitcoin spikes

 Price analysis3 months ago
Will XRP Price Defend $0.5 Support If SEC Decides to Appeal?

 Opinion4 months ago
Bitcoin Open-Source Development Takes The Stage In Nashville

 Bitcoin4 months ago
Bitcoin 20% Surge In 3 Weeks Teases Record-Breaking Potential


