
Analyst
Bitcoin Starts October In The Red After Crash To $61,000, Is ‘Uptober’ A Myth?

Bitcoin started the month of October on a negative note, deviating from what many investors had expected leading up to the month. Bitcoin, which had been on a notable price increase earlier, started to face setbacks as September ended, leading up to the first 24 hours of October.
The first 24 hours of October have been riddled with outflows from the crypto industry. Bitcoin, in particular, fell below $61,000, according to Coinmarketcap, as tensions started to rise in the Middle East. Going by this decline, it has raised questions as to the outlook for Bitcoin in the rest of the month.
Current Bitcoin Price Action
The buzz leading into October centered around expectations that Bitcoin would extend its bullish momentum and break through key resistance levels. According to price data, Bitcoin ended the month of September 7.11% above where it started, even peaking above $66,000 at one point.
Related Reading
However, at the time of writing, Bitcoin has fallen by almost 7% from the September peak. Furthermore, Coinmarketcap data shows that Bitcoin has been down by 3.6% in the past 24 hours. The swift downturn has altered the market’s sentiment, with the once-bullish outlook giving way to fear and uncertainty. The Fear and Greed Index, which gauges the market’s emotions and risk appetite, now reads 39 and signals “Fear.” It would seem crypto investors are now panicking, with crypto analyst Kaleo even calling this to attention on social media platform X.
After spending five minutes scrolling through the timeline you’d think we’re never going to see a green candle again
— K A L E O (@CryptoKaleo) October 1, 2024
Bitcoin’s price action is highly sensitive to events in the world. Notably, the recent decline in the price of Bitcoin can be attributed to geopolitical conflicts in the Middle East. Its recent performance in the face of geopolitical turmoil casts doubts on its role as a safe haven asset.
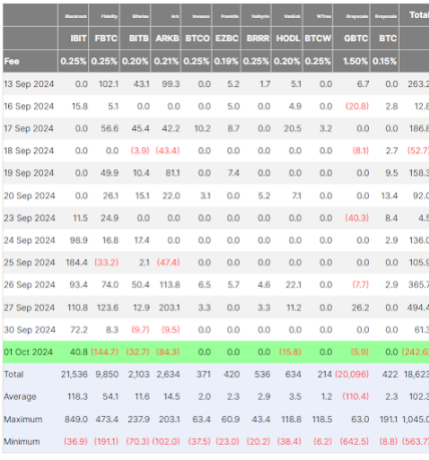
Spot Bitcoin ETFs, which are meant to prop up the Bitcoin spot price, also ended eight consecutive days of inflows with massive outflows on October 1, most likely in reaction to the Middle East tensions. According to Spot Bitcoin ETF flow data from Farside Investors, institutional investors pulled out $246.2 million yesterday.
Is Uptober A Myth?
The optimistic outlook seems to have faded quickly among many crypto investors. However, many participants are still holding on to the bullish outlook, especially considering the month still has a long way to go before its conclusion.
Related Reading
History shows, more often than not, that October has always been a positive month for Bitcoin. Most importantly, the positive performance was mostly in the second half of the month. Considering the month is only at its beginning, it is more logical to wait and examine how the price action plays out for the rest of the week before drawing any conclusion on Uptober.
In the face of these tensions, Bitcoin’s potential role as a safe haven asset similar to gold could rise among market participants in the rest of the month and beyond.
Featured image created with Dall.E, chart from Tradingview.com
Source link


The Bitcoin price has finally broken out of resistance and is on a journey to the $320,000 threshold, according to a crypto analyst. Notably, the Bitcoin price has now returned into a full bullish sentiment, with the crypto fear and greed index now pointing to extreme greed.
In a recent technical analysis, crypto analyst Gert van Lagen identified a bullish pattern in Bitcoin’s price chart, specifically pointing to a confirmed breakout of the classic ‘cup-and-handle’ pattern formation that has essentially kicked off a bullish Wave 5 run.
Bitcoin Price Sets Sights On $320,000 As Wave 5 Begins
Bitcoin’s price action has been nothing short of impressive in the past few days. Notably, the Bitcoin price has created multiple all-time highs in quick succession, as many investors start to pour in. This sustained demand has created successive bullish candles on both the daily and weekly charts, illustrating a continued strong upward momentum.
Related Reading
Interestingly, these bullish candle formations have validated what crypto analyst Gert van Lagen called the start of a sub-wave 5 formation. This wave, which is known to be bullish, is expected to be the final sub-wave formation in a larger Elliot wave uptrend that has been in play since January 2023.
Supporting the possibility of the wave 5 formation, technical analysis of the Bitcoin price formation shows that the recent price rally has seen Bitcoin breaking out of a cup-and-handle formation. This pattern, which is known to be bullish, has been in formation since 2022. The ‘cup’ portion of this pattern began forming in early 2022 and eventually ended with Bitcoin’s peak above $73,700 in March 2024. The subsequent consolidation phase, which lasted until October, represents the ‘handle’ segment of the pattern.
In addition to this, Bitcoin has managed to break free from what van Lagen described as a ‘base 4 step-wise formation,’ effectively shaking off a bear trap. With this breakout now confirmed, van Lagen’s analysis points to a projected target range between $220,000 and $320,000. This range marks what he considers a ‘major sell line,’ which is a zone where profit-taking might intensify as Bitcoin reaches these upper limits.

Related Reading
Current State Of BTC
At the time of writing, Bitcoin is trading at $89,500 with a market cap of $1.77 trillion and an all-time high of $89,864, having increased by about 10.5% in the past 24 hours. However, given this trend, this all-time high might not last long. The bullish sentiment and inflow surrounding Bitcoin has been so massive that investors don’t know when to take profit at the moment. The RSI is above 70 on every single timeframe from the daily to the yearly. This shows how strong the buying momentum is at the moment.
Nevertheless, the momentum is expected to continue, with the next target at $90,000 and another at $100,000. A move to Gert van Lagen’s target of $220,000 to $320,000 will represent a 145% and 255% increase, respectively, from the current price.
Featured image created with Dall.E, chart from Tradingview.com
Source link

The Bitcoin price may be on the verge of hitting new all-time highs as a crypto analyst has unveiled the emergence of a new technical indicator called the “Bird Beak Sign.” Spotted on the Bitcoin Heikin Ashi chart, the analyst suggests that this technical pattern indicates a potential price rally is imminent.
‘Bird Beak’ Pattern Signals Path To $100,000
Optimism in the crypto community is soaring as a popular crypto analyst, ‘Trader Tardigrade’ has shared a bullish prediction for Bitcoin’s price outlook. In an X (formerly Twitter) post, the analyst uncovered a distinct technical pattern known as the “Bird Beak sign” in the Bitcoin Heikin AshiBitcoin Heikin Ashi chart, which is a type of candlestick chart used to spot market trend direction and predict future prices.
Related Reading
The Bird Beak Sign is a distinct chart pattern that resembles a beak and is created when the Heikin Ashi candlesticks cluster together in a tight consolidated range. Typically when a cryptocurrency consolidates, it means that its price is stabilizing before a potential rally upwards. In the case of Bitcoin, the recent Bird Beak pattern suggests consolidation is preceding an upward momentum.
The analyst notes that in the past when Bitcoin showed the Bird Beak sign on the daily Heikin Ashi chart, it was followed by a strong uptrend. This upward movement was represented by multiple green candles, which showed upward movement.
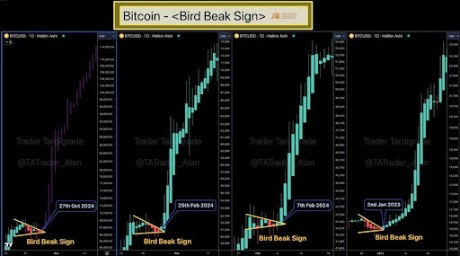
Sharing a price chart, Trader Tardigrade disclosed that on 2nd January 2023, a Bird Beak sign had appeared in the Bitcoin chart, triggering a price surge to $23,250 at the time. This same chart pattern was also observed on the 7th and 25th of February, 2024, with Bitcoin skyrocketing to $52,000 and reaching between $71,000 to $72,000, respectively.
Trader Tardigrade has revealed that the present Bird Beak sign seen in Bitcoin’s Heikin Ashi chart formed on 27 October 2024. Based on these past signs, analysts have predicted that the new Bird Beak pattern could lead to another sharp increase for Bitcoin, potentially pushing its price to $114,000 this month.
Analyst Expects Bitcoin Price To Hit $71,000 First
In a more recent X post, Trader Tardigrade revealed that Bitcoin was breaking out of a Symmetrical Triangle at the tip of its 8-hour Heikin Ashi chart. Based on this new symmetrical triangle pattern, the analyst forecasts that a successful breakout could lead to a rally towards the $71,000 price target for Bitcoin.
Related Reading

This bullish sentiment is shared by another popular analyst known as the ‘Titan of Crypto,’ who also projects Bitcoin’s next target at $71,000. This analyst has predicted that Bitcoin will reach this new target before the month closes, highlighting that the cryptocurrency’s monthly candle is looking significantly strong.
It’s important to note that as of writing, the price of Bitcoin is trading at $67,856, marking a 1.3% increase in the past 24 hours, according to CoinMarketCap.
Featured image created with Dall.E, chart from Tradingview.com
Source link

Crypto analyst MMBT Trader has revealed that the Bitcoin price is retesting a bullish channel at the $65,000 price level. He further mentioned what market participants should expect if the flagship crypto holds above or breaks below this bullish channel.
Bitcoin Price Retesting $65,000 And What Could Come Next
MMBT Trader mentioned in a TradingView post that the $65,000 support zone is now the major daily support, and market participants can expect a valid retest of the channel breakout. The analyst claimed that if the Bitcoin price holds this support, investors can expect a “heavy pump”, which could lead to a new all-time high (ATH).
Related Reading
However, if the Bitcoin price fails to hold the $65,000 bullish channel, such a breakout to the downside would lead to a free fall to the $60,000 support level. MMBT Trader even suggested the possibility of BTC retesting $50,000 if it fails to hold above $65,000. Meanwhile, a breakdown means that the flagship crypto could range for a while before it makes another attempt to break its ATH at $73,000.
Analyst Justin Bennett also recently highlighted the $65,800 range as the first test for the Bitcoin price. He had also indicated that BTC could drop to around $63,000 if it fails to hold above this level. However, a successful hold above this price range would invalidate his trade setup.
The Bitcoin price has so far held well above $65,000 since it again reclaimed $67,000 after the price crash two days ago. However, Bennett indicated that BTC isn’t yet in the clear despite the bounce on October 23. He claimed there is no confirmed bottom as long as the flagship crypto is below $68,200.
BTC Needs A Weekly Close Above This Level
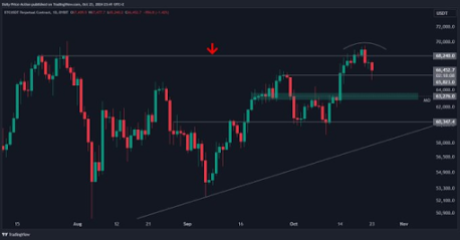
In an X post, crypto analyst Rekt Capital mentioned that a weekly close above $66,200 would be confirmed as a successful retest. He noted that the flagship crypto was showing promising signs so far, having already produced a wick below the $66,200 price level and returned above it.
Related Reading
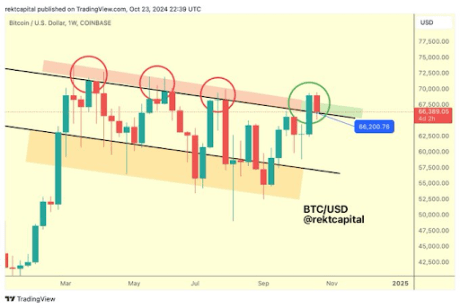
His accompanying chart showed that the Bitcoin price drop below $66,200 before the weekly close could lead to further breakdown below the $60,000 support level.
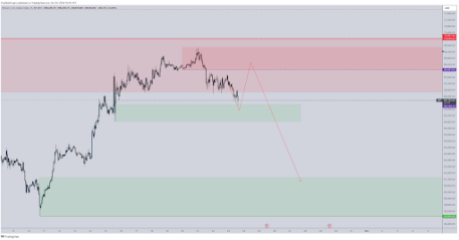
Meanwhile, bear analyst CrediBULL Crypto predicted that the Bitcoin price could retest the $68,000 range to “bait in some final longs” before it suffers a “rug pull” to the $60,000 support level. The analyst is one of those who believe that it is still too soon to call for a new ATH for BTC based on his belief that the flagship crypto still needs to retest the lower range.
At the time of writing, the Bitcoin price is trading at around $67,000, up in the last 24 hours, according to data from CoinMarketCap.
Featured image created with Dall.E, chart from Tradingview.com
Source link

Magic Eden Token Airdrop Date Set as Pre-Market Value Hits $562 Million

Blockchain Association urges Trump to prioritize crypto during first 100 days

Pi Network Coin Price Surges As Key Deadline Nears

How Viable Are BitVM Based Pegs?

UK Government to Draft a Regulatory Framework for Crypto, Stablecoins, Staking in Early 2025

Bitcoin Cash eyes 18% rally

Rare Shiba Inu Price Patterns Hint SHIB Could Double Soon

The Bitcoin Pi Cycle Top Indicator: How to Accurately Time Market Cycle Peaks
Bitcoin Breakout At $93,257 Barrier Fuels Bullish Optimism

Bitcoin Approaches $100K; Retail Investors Stay Steady

Solana Hits New ATH On Huge Whale Accumulation, More Gains Ahead?

Microsoft Should Buy $78 Billion Worth of Bitcoin

Ethereum Believers May Be Staring Down Opportunity As ETH Reaches Another Low Against Bitcoin: CryptoQuant CEO

UK government is ready for crypto regulations next year

“Crypto Dad” Chris Giancarlo Emerges Top For White House Crypto Czar Role
182267361726451435

Top Crypto News Headlines of The Week
Why Did Trump Change His Mind on Bitcoin?

New U.S. president must bring clarity to crypto regulation, analyst says

Ethereum, Solana touch key levels as Bitcoin spikes

Bitcoin Open-Source Development Takes The Stage In Nashville

Will XRP Price Defend $0.5 Support If SEC Decides to Appeal?

Bitcoin 20% Surge In 3 Weeks Teases Record-Breaking Potential

Ethereum Crash A Buying Opportunity? This Whale Thinks So

Shiba Inu Price Slips 4% as 3500% Burn Rate Surge Fails to Halt Correction

‘Hamster Kombat’ Airdrop Delayed as Pre-Market Trading for Telegram Game Expands

Washington financial watchdog warns of scam involving fake crypto ‘professors’

Citigroup Executive Steps Down To Explore Crypto
Mostbet Güvenilir Mi – Casino Bonus 2024

Bitcoin flashes indicator that often precedes higher prices: CryptoQuant

 2 months ago
182267361726451435
 24/7 Cryptocurrency News3 months ago
Top Crypto News Headlines of The Week

 Donald Trump4 months ago
Why Did Trump Change His Mind on Bitcoin?
 News3 months ago
New U.S. president must bring clarity to crypto regulation, analyst says
 Bitcoin4 months ago
Ethereum, Solana touch key levels as Bitcoin spikes
 Opinion4 months ago
Bitcoin Open-Source Development Takes The Stage In Nashville
 Price analysis3 months ago
Will XRP Price Defend $0.5 Support If SEC Decides to Appeal?
 Bitcoin4 months ago
Bitcoin 20% Surge In 3 Weeks Teases Record-Breaking Potential
