Price analysis
Is ATH on the Horizon After 11M TRX Burn?
Published
1 month agoon
By
admin
TRON (TRX) price is experiencing a notable upswing, ranking among the top market gainers despite ongoing market corrections. The bullish trend has sparked speculation about a potential climb to new all-time highs. Traders have shown a growing interest in TRX as its value continues to rise steadily, driven by increasing large transaction volumes.
TRON Price Bolstered by TRX Token Burn Event
TRON price saw significant movement following the recent TRX token burn on October 8th. The network burned over 11 million TRX tokens, designed to enhance deflationary mechanisms and boost value.
A total of 5,991,836 TRX tokens, valued at approximately $958,693.76, were removed from circulation, contributing to the network’s deflationary goals. The burn demonstrated Tron’s ongoing commitment to increasing scarcity and promoting long-term value growth.
#TRON just burned 11,057,643 #TRX on October 8th 🔥 showcasing a commitment to deflation & value growth 🚀 With a net negative production ratio of -5,991,836 🤯 pic.twitter.com/FdwIfPcqjb
— TRON Community (@TronixTrx) October 9, 2024
As a result, TRON reported a net negative production ratio of -5,991,836 tokens. This event is part of Tron’s broader strategy to position TRX for sustained upward price trends.
TRX Price Eyes ATH with Steady Growth
TRON price is experiencing a notable upward trend. The TRX price is $0.1602, reflecting a 2.82% increase in the last 24 hours. The coin hit a daily low of $0.1557 and a high of $0.1604, showing steady movement within a tight range. TRON’S all-time high stands at $0.3004, a drop of about 46.65% from its peak in January 2018.
TRON has gained significantly from its all-time low of $0.001091, recorded on September 15, 2017. This marks a massive rise of 14,584.38%.
TRON price prediction shows upward momentum, with a significant rejection occurring at the $0.2 level. This bullish movement has led to a rise in TRX value. If this positive trend continues, TRX could potentially climb to $0.25. Most crypto markets today are trading in a sideways trend, with BTC price hovering above $62,000.
Further gains push the price to a new all-time high of $0.3. If market conditions remain favorable, this scenario is possible by the end of October. The Awesome Oscillator (AO) currently shows positive momentum at 0.0036, signifying an upward trend.


Recent data from IntoTheBlock shows a significant increase in large cryptocurrency transactions, coinciding with minor price fluctuations. According to the data, large transactions surged, reaching 405 on October 8. The trend demonstrates a steady correlation between large transaction volumes and price movements and is indicative that institutions are interested in TRX at the current price levels. Often times, a spike in large transactions can be used as proxy of these whales and could serve as a buy or sell signal.


With strong upward momentum, TRX is poised for further gains, fueled by rising transaction volumes and deflationary events. If current trends persist, TRON could approach its all-time high soon, marking a significant milestone for the cryptocurrency.
Frequently Asked Questions (FAQs)
TRON’s all-time high stands at $0.3004, which was reached in January 2018.
TRON has risen approximately 14,584.38% from its all-time low of $0.001091 recorded on September 15, 2017.
Analysts suggest that if the bullish trend continues, TRX could potentially reach $0.25 or even $0.30 by the end of October.
Coingape Staff
CoinGape comprises an experienced team of native content writers and editors working round the clock to cover news globally and present news as a fact rather than an opinion. CoinGape writers and reporters contributed to this article.
Disclaimer: The presented content may include the personal opinion of the author and is subject to market condition. Do your market research before investing in cryptocurrencies. The author or the publication does not hold any responsibility for your personal financial loss.
Source link
You may like


Legacy Media’s Transformation: Why Evolution Beats Extinction


Massive Ethereum Buying Spree – Taker Buy Volume hits $1.683B In One Hour


Ethereum lags behind Bitcoin but is expected to reach $14K, boosting RCOF to new high


Bitcoin Miner MARA Buys Another 5771 BTC As Price Nears $100k


Jason "Spaceboi" Lowery's Bitcoin "Thesis" Is Incoherent Gibberish


Bankrupt Crypto Exchange FTX Set To Begin Paying Creditors and Customers in Early 2025, Says CEO
Dogecoin (DOGE)
3 Tokens Ready to 100x After XRP ETF Gets Approval
Published
7 hours agoon
November 22, 2024By
admin
The cryptocurrency market is turning bullish, with several tokens showing strong potential. Three standout coins have displayed remarkable growth, positioning themselves as prime investment opportunities. This optimism follows growing anticipation surrounding an XRP ETF approval, sparking confidence among investors. The market’s momentum suggests further gains may be on the horizon.
3 Tokens That Could Be the Next 100x Gems After XRP ETF Approval
For the first time in three years, Ripple’s XRP surpassed $1.4, climbing 25% after regulatory shifts and SEC developments. The surge follows SEC Chair Gary Gensler’s announcement of his term ending January 20. Speculation grows about tokens poised for massive growth, with investors eyeing potential 100x opportunities post-XRP ETF approval.
Dogecoin (DOGE)
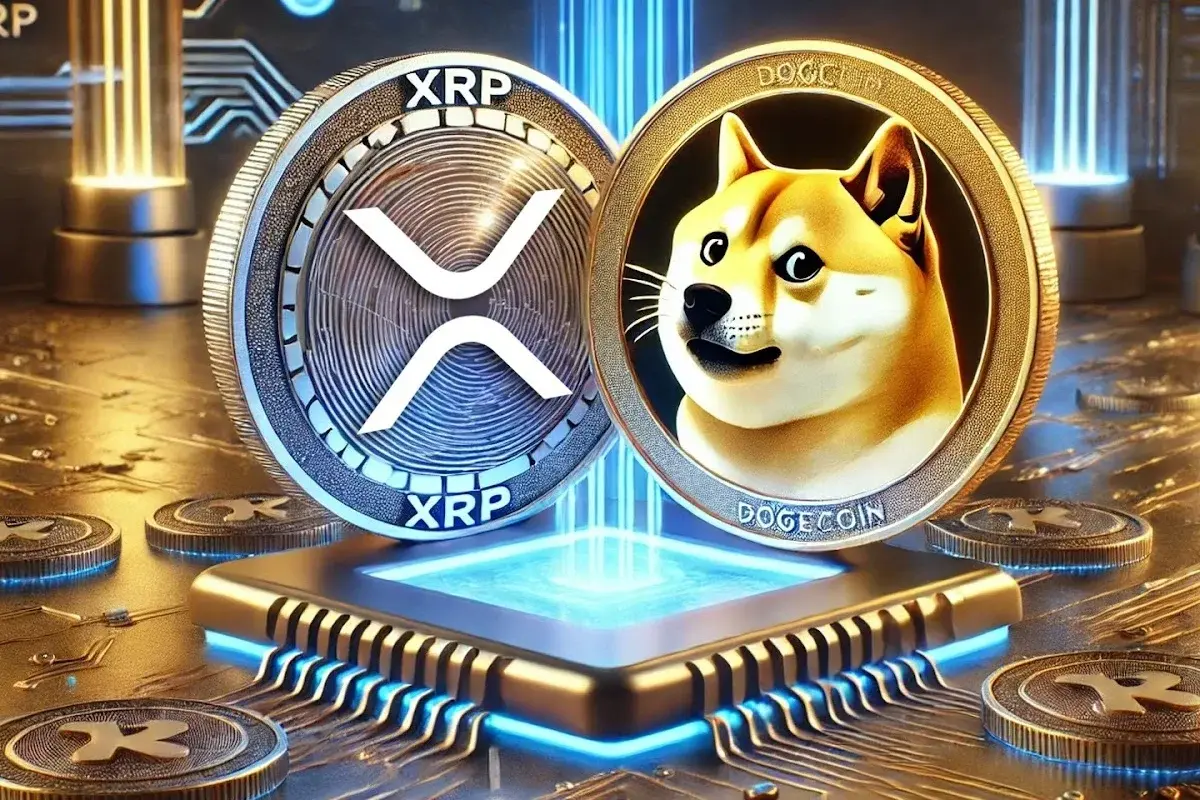
Dogecoin (DOGE), the popular meme coin featuring a Shiba Inu, has surged 13% in the past week, reaching $0.4084. Over the past year, DOGE’s value climbed 446%, showcasing growing interest in meme-based cryptocurrencies. Dogecoin may be among the three tokens poised to 100x following the potential approval of an XRP ETF.
This highlights the evolving crypto market dynamics, investor optimism around meme coins, and significant cryptocurrency advancements.
Dogecoin appears ready to surge as technical indicators point to a potential bullish rally in the near future. According to insights from market analysts, meme coins break out of a consolidating triangle pattern, often preceding upward price movements.


Aureal One
Aureal One has launched its much-anticipated presale for a groundbreaking metaverse platform, attracting significant interest within minutes. The platform uniquely combines blockchain technology with immersive virtual reality, integrating gaming, the metaverse, and real-world applications.
The advanced Aureal One Blockchain is at its core, which powers two flagship projects: DarkLume and Clash of Tiles. These projects highlight the blockchain’s cutting-edge capabilities, offering interactive experiences that promote community engagement and individual development.


Aureal One aims to redefine virtual experiences by featuring a robust ecosystem and innovative features, solidifying its position as a leading investment in the metaverse and virtual reality sectors.
Solana (SOL)
Solana (SOL), an open-source blockchain supporting decentralized applications (DApps), has seen a significant price surge. Over the past 24 hours, the SOL price climbed 4%, reaching a new all-time high of $254. This milestone comes amid broader market gains, positioning Solana as one of the promising tokens ready to 100x following the XRP ETF approval.
Solana’s market value has risen by over 400% in the past year, reflecting robust growth. Data from Coinglass reveals heightened activity in Solana’s derivatives market, with trading volumes and open interest increasing steadily. The expanding options trading volume further underscores the blockchain’s growing appeal among investors. These metrics highlight Solana’s increasing traction in derivatives, signaling strong investor interest.


The cryptocurrency market is primed for further gains. As the XRP ETF sets a new precedent, these top tokens showcase the potential for substantial returns, making them worth monitoring closely.
Frequently Asked Questions (FAQs)
The approval signals mainstream acceptance of XRP and boosts investor confidence.
Dogecoin’s strong community, recent price surge, and technical patterns suggest bullish potential.
Aureal One uniquely blends blockchain, metaverse, and gaming, creating robust investment appeal.
Coingape Staff
CoinGape comprises an experienced team of native content writers and editors working round the clock to cover news globally and present news as a fact rather than an opinion. CoinGape writers and reporters contributed to this article.
Disclaimer: The presented content may include the personal opinion of the author and is subject to market condition. Do your market research before investing in cryptocurrencies. The author or the publication does not hold any responsibility for your personal financial loss.
Source link
Pi Network
Pi Network Coin Price Surges As Key Deadline Nears
Published
11 hours agoon
November 22, 2024By
admin
Pi Network price rose for six consecutive days ahead of a key deadline scheduled for later this month. Can the Pi Coin sustain its momentum and retest its October high of $100?
Pi Network KYC Grace Period Is Ending
The Pi Coin IoU token has staged a strong recovery, rising to $80, which was 175% above its lowest level in September. This rally happened as the soaring cryptocurrency prices raised the expectation that its mainnet launch would happen in December.
Pi Network also surged ahead of the November 30th deadline of ending the grace period of the Know Your Customer (KYC) verification process. The KYC process hopes to verify millions of pioneers who have been mining the coin in the last six years and removing bots.
This verification is an important stage towards the mainnet launch, which is anticipated to take place in December. When it happens, all pioneers will finally be able to swap their tokens for fiat currencies and stablecoins. Pioneers who don’t complete their verification will lose all their mined coins.
The KYC is part of three things that need to happen before the Pi Network mainnet launch happens. The other one is the existence of a vibrant ecosystem, which is expected to give the Pi coin utility.
Additionally, the developers hinted that the mainnet launch or the move to the open network would happen when market conditions are conducive. This criterion has been met because most cryptocurrencies are in a strong rally and regulations are expected to be friendly under the Trump administration.
Pi Coin Price Rally Could Continue
Pi Coin is an IoU that is not affiliated with the real project and is only listed in HTX. It is often seen as a proxy for the coin, which explains why its price has jumped in the past few weeks.
On the daily chart, the Pi price jumped to $100 earlier this month after the developers confirmed that the mainnet launch was on the way. It then suffered a harsh reversal and dropped to $45 on November 12.
The coin has now bounced back and remains above the 50-day and 200-day Exponential Moving Averages. It has also rallied above the ultimate resistance of the Murrey Math Lines.


The Average Directional Index (ADX), a popular measure of a trend strength, has moved to above 60. Also, the Relative Strength shows that it has momentum. Therefore, the coin may soon jump to $100, which is about 25% above the current level. A move above that level will raise the probability of it rising to the year-to-date high of $121, 53% above the current level.
On the flip side, a drop below the strong pivot reverse point at $62.5 will invalidate the bull run and raise the odds of it falling to $45.
Frequently Asked Questions (FAQs)
The Pi Network token has rallied as the end of the six-month grace period for pioneers to KYC themselves near. It has also surged because of the ongoing crypto bull run.
The developers have committed to completing the mainnet launch this year. As such, with just a month to go, odds are that it will happen in December.
The Pi Coin IoU is a cryptocurrency traded just in HTX that acts as a proxy for the main Pi network. It is not affiliated with the real project.
crispus
Disclaimer: The presented content may include the personal opinion of the author and is subject to market condition. Do your market research before investing in cryptocurrencies. The author or the publication does not hold any responsibility for your personal financial loss.
Source link
Price analysis
Rare Shiba Inu Price Patterns Hint SHIB Could Double Soon
Published
15 hours agoon
November 22, 2024By
admin
Shiba Inu price continues to consolidate around a key level, but two unique chart patterns point to big a move ahead. If the pattern successfull breaks out SHIB could almost double in value.
Technicals Hint Shiba Inu Price Could Double Soon
The daily chart shows that the SHIB price has formed three extremely rare patterns, that point to more upside in the coming weeks. First, the coin formed a golden cross chart pattern on October 20th as the 200-day and 50-day Weighted Moving Averages (WMA) crossed each other. The WMA is often seen as a better type of moving average because it focuses on recent data.
Second, the SHIB price has also formed a bullish pennant pattern, which is characterized by a long flagpole and a symmetrical triangle. This flagpole happened between November 4 and 12. In most cases, a bullish breakout happens when the two triangles near their confluence levels, which is about to happen.
The other pattern is a cup and handle, which has been forming since the coin peaked at $0.000030 on May 29. This pattern is made up of two peaks and a rounded bottom, followed by a consolidation or a pullback. The handle section has coincided with the triangle section of the bullish pennant.
One way to estimate the next target is to measure the distance between the upper and lower sides of the cup pattern. In this case, the distance was about 170%. As such, a conservative estimate is that the value of SHIB could double from the current level. For that to happen, it needs to rise to the key resistance point at $0.000045, 100% above the current level. It also ought to flip the year-to-date high of $0.000045 into a support.
On the flip side, a drop below the support at $0.000020, its October 29 high, will invalidate the bullish view. Such a move could push SHIB down to $0.000015.


SHIB Burn Rate Slips But Upward Trajectory Remains
A key fundamental catalyst for Shiba Inu price is its burn rate, where millions of tokens are placed in an inaccessible wallet. Data by Shiburn shows that the burn rate dropped by 96% in the last 24 hours to 352,413.
Still, despite this, the trend has been accelerating in the past few months. Over 410 trillion Shiba tokens have been burned, bringing the total tokens in circulation at 583 trillion. Shiba Inu burns happen voluntarily and from the fees collected in its ecosystem of platforms like ShibaSwap and Shibarium.
The other potential catalyst for the Shiba Inu price is the ongoing crypto bull run. If Bitcoin pierces the key resistance at $100,000, there are chances that other altcoins will continue their bullish breakout.
Frequently Asked Questions (FAQs)
Yes, there is a high likelihood that the SHIB coin will have a bullish breakout and surge in the coming weeks. It has formed a cup and handle, a bull pennant, and a golden cross.
The main catalyst for the SHIB price is its strong technicals and the ongoing crypto bull run. SHIB also has substantial volumes.
Traders are watching key points. The two notable ones are $0.000030, the upper side of the cup hand handle pattern, The other one is the year-to-date high of $0.000045.
crispus
Disclaimer: The presented content may include the personal opinion of the author and is subject to market condition. Do your market research before investing in cryptocurrencies. The author or the publication does not hold any responsibility for your personal financial loss.
Source link

Legacy Media’s Transformation: Why Evolution Beats Extinction

Massive Ethereum Buying Spree – Taker Buy Volume hits $1.683B In One Hour

Ethereum lags behind Bitcoin but is expected to reach $14K, boosting RCOF to new high

Bitcoin Miner MARA Buys Another 5771 BTC As Price Nears $100k

Jason "Spaceboi" Lowery's Bitcoin "Thesis" Is Incoherent Gibberish

Bankrupt Crypto Exchange FTX Set To Begin Paying Creditors and Customers in Early 2025, Says CEO

Top crypto traders’ picks for explosive growth by 2025

3 Tokens Ready to 100x After XRP ETF Gets Approval

Gary Gensler’s Departure Is No Triumph For Bitcoin

Magic Eden Token Airdrop Date Set as Pre-Market Value Hits $562 Million

Blockchain Association urges Trump to prioritize crypto during first 100 days

Pi Network Coin Price Surges As Key Deadline Nears

How Viable Are BitVM Based Pegs?

UK Government to Draft a Regulatory Framework for Crypto, Stablecoins, Staking in Early 2025

Bitcoin Cash eyes 18% rally
182267361726451435

Top Crypto News Headlines of The Week

Why Did Trump Change His Mind on Bitcoin?

New U.S. president must bring clarity to crypto regulation, analyst says

Ethereum, Solana touch key levels as Bitcoin spikes

Will XRP Price Defend $0.5 Support If SEC Decides to Appeal?

Bitcoin Open-Source Development Takes The Stage In Nashville

Bitcoin 20% Surge In 3 Weeks Teases Record-Breaking Potential

Ethereum Crash A Buying Opportunity? This Whale Thinks So

Shiba Inu Price Slips 4% as 3500% Burn Rate Surge Fails to Halt Correction

‘Hamster Kombat’ Airdrop Delayed as Pre-Market Trading for Telegram Game Expands

Washington financial watchdog warns of scam involving fake crypto ‘professors’

Citigroup Executive Steps Down To Explore Crypto
Mostbet Güvenilir Mi – Casino Bonus 2024

Bitcoin flashes indicator that often precedes higher prices: CryptoQuant
Trending

 2 months ago
182267361726451435

 24/7 Cryptocurrency News3 months ago
Top Crypto News Headlines of The Week

 Donald Trump4 months ago
Why Did Trump Change His Mind on Bitcoin?

 News3 months ago
New U.S. president must bring clarity to crypto regulation, analyst says

 Bitcoin4 months ago
Ethereum, Solana touch key levels as Bitcoin spikes

 Price analysis3 months ago
Will XRP Price Defend $0.5 Support If SEC Decides to Appeal?

 Opinion4 months ago
Bitcoin Open-Source Development Takes The Stage In Nashville

 Bitcoin4 months ago
Bitcoin 20% Surge In 3 Weeks Teases Record-Breaking Potential


✓ Share: