
Bitcoin
Opacity, Aiming to Launch ‘Verified Data Network’ Powered by zkTLS Technology, Raises $12M


Dynex, a layer-1 blockchain for decentralized quantum computing, powered by a decentralized GPU network, has unveiled what it describes as an “ambitious 10-year roadmap to transition from GPU-based quantum emulation to silicon quantum chips, aiming to capture 25% of the quantum computing market by 2034.” According to the team, “The company has launched a $50 million venture capital round to attract top-tier investors. Dynex plans to release its first Apollo Silicon Quantum Chip by 2025, scaling up to 1 million qubits by 2034 to enable real-time quantum computations. Upholding ethical standards, Dynex ensures transparency and security by recording computations immutably on the blockchain, with DNX as its utility token.” The project documentation states: “The company’s decentralized quantum platform, combined with its silicon-based hardware solutions, represents a future-proof approach to quantum computing.” The project focuses on “neuromorphic quantum computing,” which “utilizes ion drifting of electrons,” according to the website.
Source link


Altcoin Season
End of Altcoin Season? Glassnode Co-Founders Warn Alts in Danger of Lagging Behind After Last Week’s Correction

The creators of the crypto analytics firm Glassnode are warning that altcoins could lose all bullish momentum following last week’s market correction.
Jan Happel and Yann Allemann, who go by the handle Negentropic on the social media platform X, tell their 63,400 followers that “altcoin season,” which they say began in late November, could come to an abrupt end after alts witnessed deep pullbacks over the last seven days.
According to the Glassnode co-founders, traders and investors will likely have a risk-off approach on altcoins unless Bitcoin recovers a key psychological price point.
“Is This the End of Altcoin Season?
Bitcoin dominance is surging after dipping below $100,000, while altcoins are losing critical supports. Dominance has risen and resumed its upward trend, signaling a stronger BTC environment.
If BTC stabilizes above $100,00, we might see a pump in altcoins now in accumulation zones. Until then, Bitcoin appears poised to lead, leaving altcoins lagging behind.”
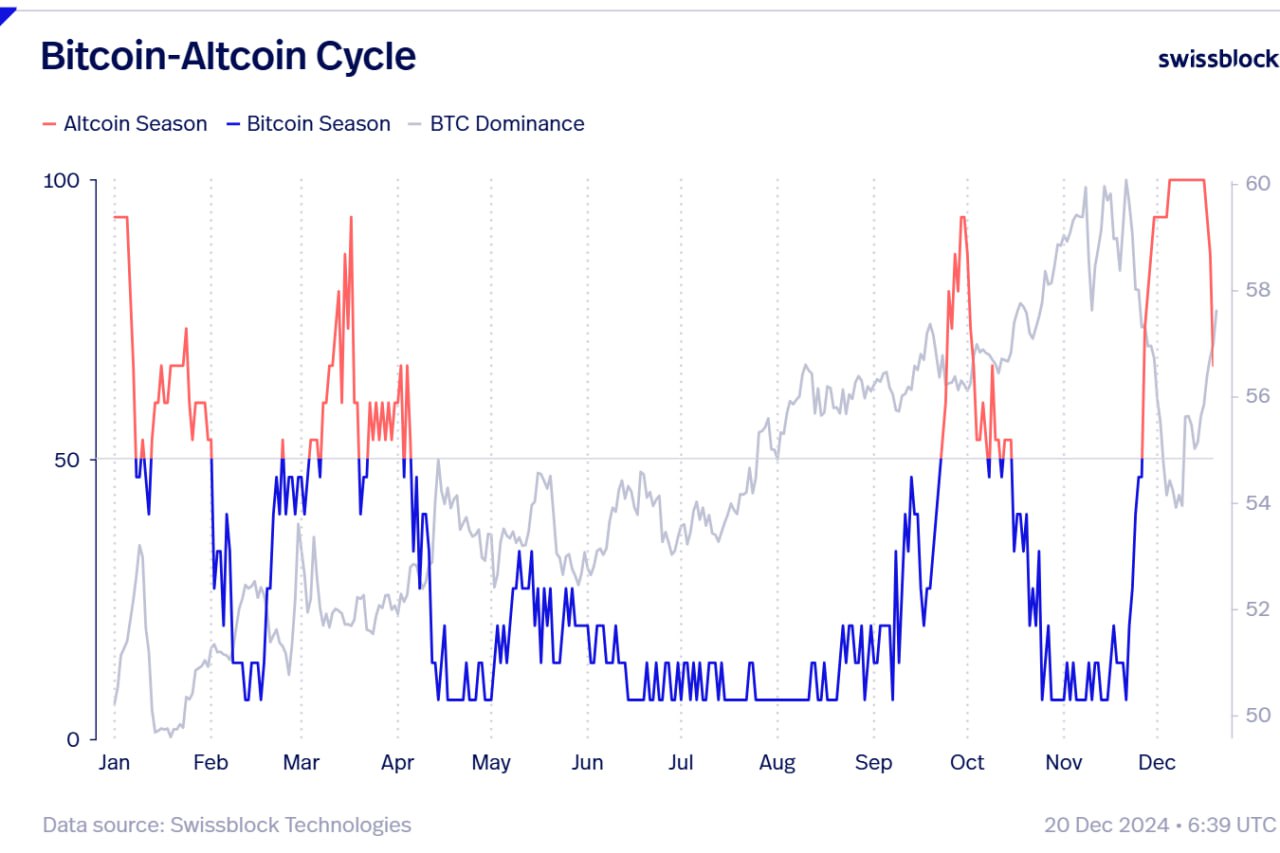
The Bitcoin Dominance (BTC.D) chart tracks how much of the total crypto market cap belongs to BTC. In the current state of the market, a surging BTC.D suggests that altcoins are losing value faster than Bitcoin.
At time of writing, BTC.D is hovering at 59%.
Looking at Bitcoin itself, the Glassnode executives say long-term Bitcoin holders are massively unloading their holdings as other investor cohorts pick up the slack.
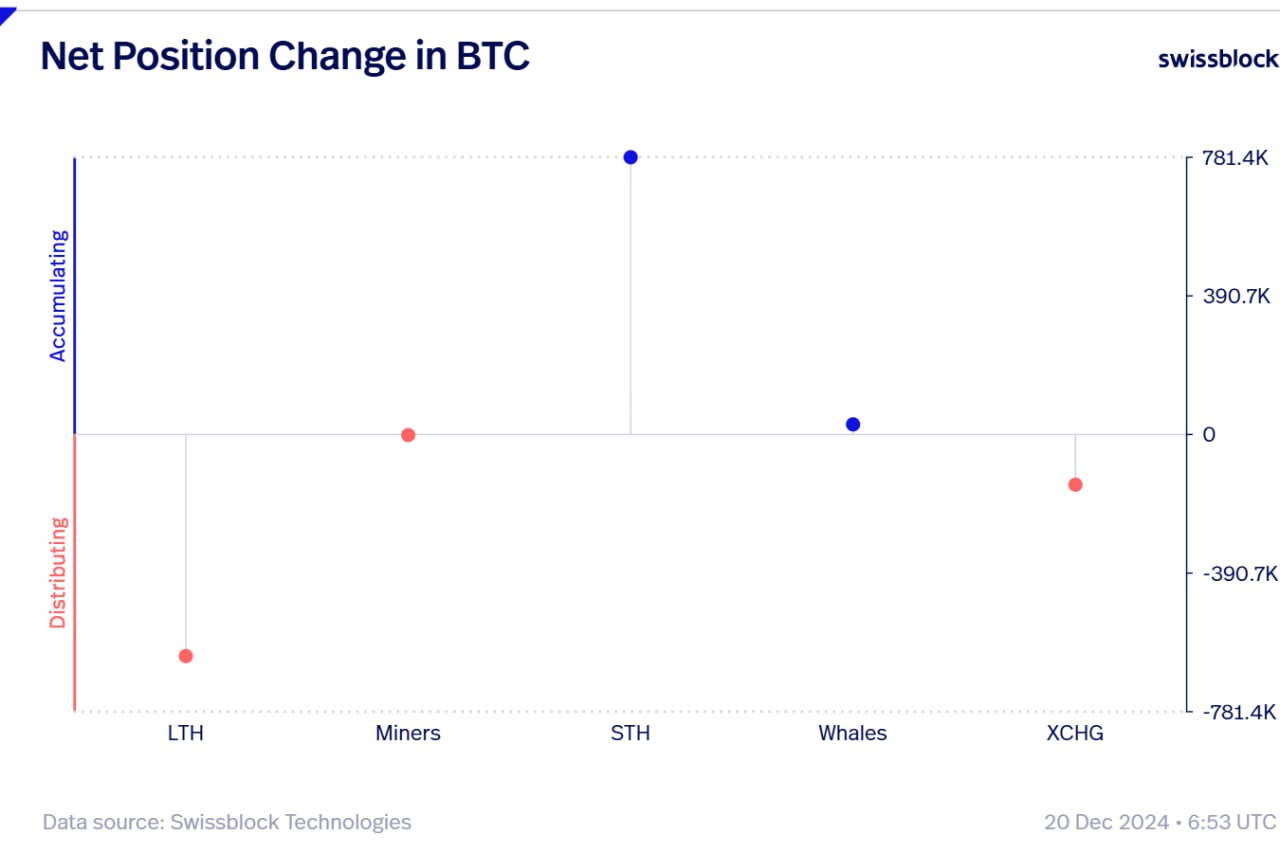
“The Board Keeps Shifting.
As BTC continues flowing out of exchanges during this dip, long-term holders are exiting forcefully, while short-term holders step in without hesitation.
Whales quietly accumulate, miners remain neutral, and selling pressure has merely reshuffled the board.
New hands are absorbing the sales.”
At time of writing, Bitcoin is worth $97,246.
Don’t Miss a Beat – Subscribe to get email alerts delivered directly to your inbox
Check Price Action
Follow us on X, Facebook and Telegram
Surf The Daily Hodl Mix
 

Disclaimer: Opinions expressed at The Daily Hodl are not investment advice. Investors should do their due diligence before making any high-risk investments in Bitcoin, cryptocurrency or digital assets. Please be advised that your transfers and trades are at your own risk, and any losses you may incur are your responsibility. The Daily Hodl does not recommend the buying or selling of any cryptocurrencies or digital assets, nor is The Daily Hodl an investment advisor. Please note that The Daily Hodl participates in affiliate marketing.
Generated Image: DALLE3
Source link
Altcoins
Bitwise CIO Matt Hougan Predicts Institutional Interest in Altcoins, Says 2025 the Year of Crypto Diversification

Bitwise CIO Matt Hougan says a wave of institutional interest in altcoins is coming next year, largely due to potential regulatory clarity and more exchange-traded funds (ETFs).
In a new interview with Bloomberg, Hougan says that institutional money is in the early stages of broadening out to other crypto assets besides just Bitcoin (BTC).
Hougan forecasts that 2025 will be the year that institutional investors will begin to incorporate more diversification in their crypto-investing strategies the same way they do in other asset classes like equities or bonds.
“You’re already seeing it broaden out actually. A lot of people were worried about the Ethereum ETFs for instance, which launched this summer and had tepid inflows.
But over the last month or so, you’ve seen billions of dollars flow into those products.
Again, the things that have happened in crypto in the past keep happening. Historically, most people enter crypto through Bitcoin, and then they discover Ethereum, and then they think about Solana. There’s no reason to assume that the institutions that came into Bitcoin won’t move on to other assets in the future.
In fact, I think in 2025, you’re going to see an explosion of interest in index space strategies that give diversified exposure to crypto. Of course, [that is] something we’ve been doing at Bitwise since 2017 when we pioneered that concept. I think 2025 is when that becomes a mainstream way to allocate to this space, the same way it is to stocks and bonds and real estate and everything else.”
Don’t Miss a Beat – Subscribe to get email alerts delivered directly to your inbox
Check Price Action
Follow us on X, Facebook and Telegram
Surf The Daily Hodl Mix
 
Disclaimer: Opinions expressed at The Daily Hodl are not investment advice. Investors should do their due diligence before making any high-risk investments in Bitcoin, cryptocurrency or digital assets. Please be advised that your transfers and trades are at your own risk, and any losses you may incur are your responsibility. The Daily Hodl does not recommend the buying or selling of any cryptocurrencies or digital assets, nor is The Daily Hodl an investment advisor. Please note that The Daily Hodl participates in affiliate marketing.
Featured Image: Shutterstock/Julien Tromeur/Sensvector
Source link
Microsoft shareholders nixed a Bitcoin treasury idea, but other big-name companies disagree with this strategy. Here’s why.
Bitcoin (BTC) is often likened to “digital gold,” with its fixed supply of 21 million coins making it a potential hedge against currency devaluation and inflation.
And nowadays, Bitcoin’s unique characteristics make it an attractive addition to corporate treasuries. It can balance exposure to traditional assets like cash, stocks, and bonds.
Bitcoin is also one of the most liquid assets globally, and its historical performance has shown significant long-term value appreciation — it reached an all-time high of over $108,000 on Dec. 17.
But there’s no shortage of risks.
A board might avoid adopting a Bitcoin treasury due to the coin’s extreme price volatility, which can lead to substantial losses during downturns. Also, regulatory uncertainties pose potential threats as governments refine crypto policies. Additionally, liquidity challenges during market slumps can amplify price drops when offloading assets.
So it’s no wonder that, on Dec. 10, Microsoft’s board channeled the long-standing crypto skepticism of its co-founder, Bill Gates, and recommended ditching the proposa for a Bitcoin trasury. Gates himself has famously dismissed crypto as “100% based on greater fool theory” — ouch.
Bitcoin evangelist and MicroStrategy Chairman Michael Saylor was busy trying to woo Microsoft when he touted Bitcoin’s own meteoric returns and bragged about MicroStrategy’s stock soaring after their BTC splurge. His pitch? Bitcoin could boost Microsoft’s market cap while acting as a financial guardian angel.
Microsoft’s response? No, thanks.
Meanwhile, at least 10 other companies are embracing the MicroStrategy playbook.
Genius Group
Genius Group, an AI-powered education group, announced in November that it had completed the purchase of 110 Bitcoin for $10 million, at an average price of $90,932 per Bitcoin. The purchase made good on a promise to employ what it called a “Bitcoin-first” strategy where it planed to commit 90% or more of its current and future reserves to be held in Bitcoin, with an initial target of $120 million in Bitcoin.
Earlier this month, the company bolstered its Bitcoin treasury by acquiring 194 Bitcoin worth $18 million at an average price of $92,728 per Bitcoin.
Genius Group CEO Roger Hamilton credited Saylor’s Bitcoin treasury plan for the inspiration, adding that “more companies will see the benefits of establishing a Bitcoin treasury, and will be equipped with the clear steps to follow.”
Worksport
Worksport, a U.S.-based provider of pickup truck solutions, is adding cyptocurency to its corporate treasury strategy.
The Nasdaq-listed company announced on Dec. 5 that it would be adding Bitcoin (BTC) and XRP (XRP) to its treasury assets. This follows a resolution by the company’s board of directors, which approved an initial purchase of $5 million worth of BTC and XRP.
Worksport is committing 10% of its excess operational cash to this corporate pivot, it said in the announcement.
“Our upcoming adoption of Bitcoin (BTC) and XRP (Ripple) reflects our commitment to staying ahead of market trends while prioritizing operational efficiency and shareholder value. As we expand our product offerings and global reach, cryptocurrency has the potential to be a strong strategic complement,” Steven Rossi, chief executive officer of Worksport, said.
Amazon
Amazon shareholders, led by the National Center for Public Policy Research, are urging the Seattle-based company’s board to assess the potential benefits of adding Bitcoin to the company’s financial strategy.
The proposal, submitted on Dec. 6, aims to explore whether Bitcoin could protect and enhance shareholder value, especially amid persistent inflation and declining yields from traditional assets.
The National Center emphasizes Bitcoin’s robust performance—131% growth in the past year and 1,246% over five years—as evidence of its potential as an inflation hedge and a growth asset. The initiative also highlights concerns about the diminishing purchasing power of Amazon’s $88 billion cash reserves due to average inflation of 4.95% over the past four years.
This move represents a broader trend of shareholder proposals influencing corporate policies, leveraging shareholder rights to advocate for financial strategies that address economic risks and enhance long-term value.
MicroStrategy
Perhaps the most vocal of all Bitcoin fans is MicroStrategy’s Saylor who, as of this past week, increased the company’s total holdings to 439,000.
As a result, Saylor has officially strengthening MicroStrategy’s position as the top corporate BTC holder, considering it a long-term store of value.
Saylor, during an appearance on the Dec. 18 episode of the Open Interest show on Bloomberg Television, even voiced his willingness to advise President-elect Donald Trump on crafting a digital assets policy for the U.S.
But Saylor continues to draw scrutiny: Analyst Jacob King has labeled MicroStrategy’s Bitcoin-focused business model a “giant scam,” claiming it is unsustainable and destined for collapse.
Marathon Digital Holdings
As one of the largest Bitcoin mining companies, Marathon owns 44,394 BTC. Its business model revolves entirely around mining and holding Bitcoin as part of its assets.
Back in July, the company confirmed it will adopt “a full HODL approach” towards its Bitcoin treasury policy, retaining all that it mines within its operations, in addition to its open market purchases.
“Adopting a full HODL strategy reflects our confidence in the long-term value of bitcoin,” CEO Fred Thiel stated. “We believe bitcoin is the world’s best treasury reserve asset and support the idea of sovereign wealth funds holding it. We encourage governments and corporations to all hold bitcoin as a reserve asset.”
Tesla
Tesla initially bought $1.5 billion worth of Bitcoin in 2021 and currently holds 9,720 BTC. While the Elon Musk-led company remains a significant corporate holder.
BitcoinTreasuries data shows that Tesla is the fourth-largest holder of Bitcoin among U.S. public companies with crypto treasuries (MicroStrategy, MARA Holdings and Riot Platforms are believed to hold more).
In October, the electric vehicle company reportedly moved $765 million worth of Bitcoin to unidentified wallets.
Coinbase
The cryptocurrency exchange holds 9,480 BTC as part of its reserves, leveraging its position as a major player in the digital asset ecosystem.
The Brian Armstrong-led firm holds large amounts of Bitcoin as an exchange and converter. It’s also a trusted institution for custody services, and counts the Bitcoin ETF coterie of BlackRock, Grayscale, 21Shares, Invesco, Valkyrie, Wisdom Tree and Franklin Templeton among its clients.
Therefore, Coinbase has a Bitcoin treasury for itself and oversees others.
Hut 8 Mining Corp
On Thursday, crypto.news reported that Hut 8, a Bitcoin mining company, added 990 Bitcoin to its reserves.
The company spent roughly $100 million to increase its total holdings to 10,096 BTC. The reserve, now valued at over $1 billion, places Hut 8 among the largest corporate Bitcoin holders globally.
The company, under the guidance of CEO Asher Genoot, purchased the coins at an average price of $101,710, significantly higher than its cumulative acquisition cost of $24,484 per Bitcoin.
Block Inc.
The startup (formerly Square) holds 8,027 BTC as part of its strategy to integrate Bitcoin into mainstream finance.
The Jack Dorsey-founded company is so bullish on Bitcoin that, last month, it confirmed a company-wide pivot towards the cryptocurrency mining sector.
Block decided to dial down resources towards music streaming service TIDAL, and sunset TBD, a venture focusing on decentralizing the internet, to focus on expanding its presence in the Bitcoin mining sector.
Block acquired TIDAL in a 2021 acquisition for roughly $300 million. The platform has continued to struggle, with reports indicating workforce reductions and a $132.3 million impairment charge.
OneMedNet
OneMedNet Corp., as of Nov. 12, owns some 34 Bitcoins.
Off The Chain Capital, an investor in OneMedNet, was also inspired by Saylor, betting that Bitcoin isn’t just a hedge but a springboard for its healthcare data innovation.
Aaron Green, the company’s CEO, stated, “By continuing to invest a portion of our assets into Bitcoin, we aim to not only safeguard our financial stability but also fuel the ongoing development and innovation within our iRWD platform.”
Source link

Tron’s Justin Sun Offloads 50% ETH Holdings, Ethereum Price Crash Imminent?

Investors bet on this $0.0013 token destined to leave Cardano and Shiba Inu behind

End of Altcoin Season? Glassnode Co-Founders Warn Alts in Danger of Lagging Behind After Last Week’s Correction

Can Pi Network Price Triple Before 2024 Ends?

XRP’s $5, $10 goals are trending, but this altcoin with 7,400% potential takes the spotlight

CryptoQuant Hails Binance Reserve Amid High Leverage Trading

Trump Picks Bo Hines to Lead Presidential Crypto Council

The introduction of Hydra could see Cardano surpass Ethereum with 100,000 TPS

Top 4 Altcoins to Hold Before 2025 Alt Season

DeFi Protocol Usual’s Surge Catapults Hashnote’s Tokenized Treasury Over BlackRock’s BUIDL

DOGE & SHIB holders embrace Lightchain AI for its growth and unique sports-crypto vision

Will Shiba Inu Price Hold Critical Support Amid Market Volatility?

Chainlink price double bottoms as whales accumulate

Ethereum Accumulation Address Holdings Surge By 60% In Five Months – Details

Ripple Transfers 90M Coins, What’s Happening?
182267361726451435
Why Did Trump Change His Mind on Bitcoin?

Top Crypto News Headlines of The Week

New U.S. president must bring clarity to crypto regulation, analyst says

Will XRP Price Defend $0.5 Support If SEC Decides to Appeal?

Bitcoin Open-Source Development Takes The Stage In Nashville

Ethereum, Solana touch key levels as Bitcoin spikes

Bitcoin 20% Surge In 3 Weeks Teases Record-Breaking Potential

Ethereum Crash A Buying Opportunity? This Whale Thinks So

Shiba Inu Price Slips 4% as 3500% Burn Rate Surge Fails to Halt Correction

Washington financial watchdog warns of scam involving fake crypto ‘professors’

‘Hamster Kombat’ Airdrop Delayed as Pre-Market Trading for Telegram Game Expands

Citigroup Executive Steps Down To Explore Crypto
Mostbet Güvenilir Mi – Casino Bonus 2024

NoOnes Bitcoin Philosophy: Everyone Eats

 3 months ago
182267361726451435

 Donald Trump5 months ago
Why Did Trump Change His Mind on Bitcoin?
 24/7 Cryptocurrency News4 months ago
Top Crypto News Headlines of The Week
 News4 months ago
New U.S. president must bring clarity to crypto regulation, analyst says
 Price analysis4 months ago
Will XRP Price Defend $0.5 Support If SEC Decides to Appeal?
 Opinion5 months ago
Bitcoin Open-Source Development Takes The Stage In Nashville
 Bitcoin5 months ago
Ethereum, Solana touch key levels as Bitcoin spikes
 Bitcoin5 months ago
Bitcoin 20% Surge In 3 Weeks Teases Record-Breaking Potential
