
Bitcoin Magazine Pro
Is Bitcoin Repeating Previous Bull Cycles?
Bitcoin’s price cycles have long been a source of intrigue for investors and analysts alike. We can gain insights into potential price movements by comparing current trends to previous cycles, especially with Bitcoin seemingly coming to an end of its consolidation period, many wonder if the next leg up is around the corner.
Comparing Bitcoin Cycles
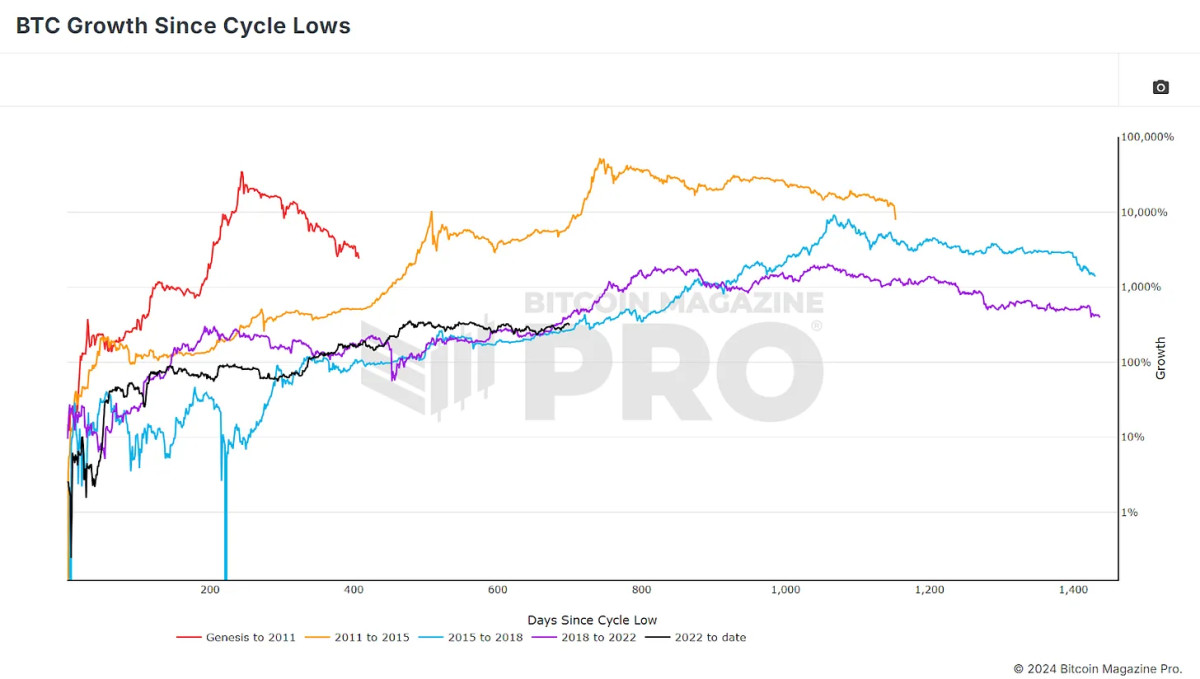
To begin, it’s crucial to look at how Bitcoin has performed since hitting its recent cycle low. As we examine the data, a clear picture begins to form: Bitcoin’s current price action (black line) is showing patterns similar to previous bull cycles. Although it has been a choppy consolidation period, where the price has been relatively stagnant, there are key similarities when we compare this cycle to those in 2015-2018 (purple line) and 2018-2022 (blue line).

Where we are today, in terms of percentage gains, is comparable to both the 2018 and 2015 cycles. However, this comparison only scratches the surface. Price action alone doesn’t tell the full story, so we need to dive deeper into investor behavior and other metrics that shape the Bitcoin market.
Investor Behavior
One key metric that gives us insight into investor behavior is the MVRV Z-Score. This ratio compares Bitcoin’s current market price to its “realized price” (or cost basis), which represents the average price at which all Bitcoin on the network was accumulated. The Z-Score then just standardizes the raw MVRV data for BTC volatility to exclude extreme outliers.
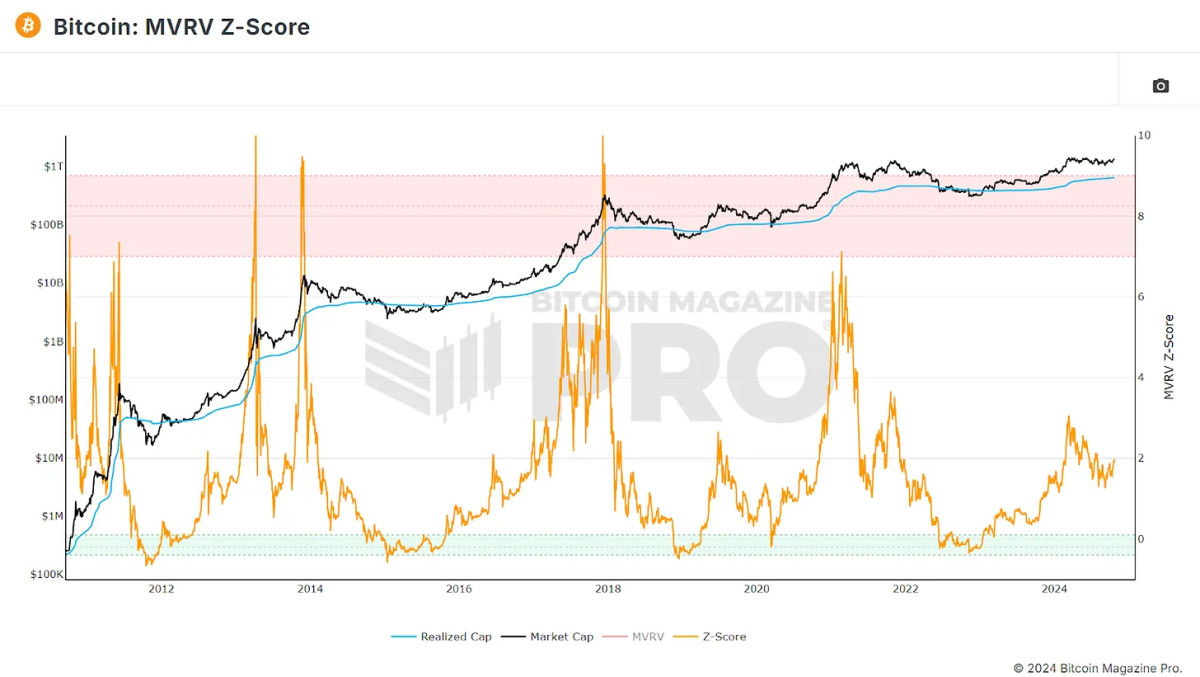
Analyzing metrics such as this one, as opposed to purely focusing on price actions, will allow us to see patterns and similarities in our current cycle to previous ones, not just in dollar movements but also in investor habits and sentiment.
Correlating Movements
To better understand how the current cycle aligns with previous ones, we turn to the data from Bitcoin Magazine Pro, which offers in-depth insights through its API. Excluding our Genesis cycle, as there is little correlation and isolating the price and MVRV data from Bitcoin’s lowest closing prices to its highest points in our current and previous three cycles, we can see clear correlations.
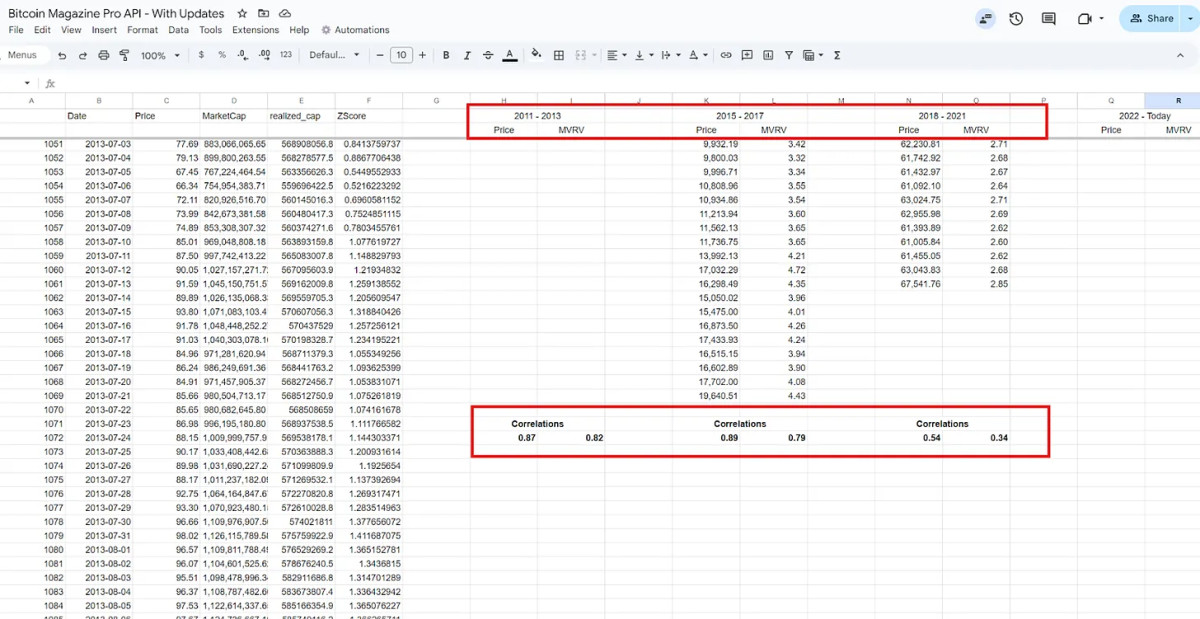
2011 to 2013 Cycle: This cycle, characterized by its double peak, shows a strong 87% correlation with the current price action. The MVRV ratio also shows a high 82% correlation, meaning that not only is Bitcoin’s price behaving similarly, but so is investor behavior in terms of buying and selling.
2015 to 2017 Cycle: This cycle is actually the closest in terms of price action, boasting an 89% correlation with our current cycle. However, the MVRV ratio is slightly lower, suggesting that while prices are following similar paths, investor behavior might be slightly different.
2018 to 2021 Cycle: This most recent cycle, while positive, has the lowest correlation to current trends, indicating that the market may not be following the same patterns it did just a few years ago.
Are We in for Another Double Peak?
The strong correlation with the 2011-2013 cycle is particularly noteworthy. During that period, Bitcoin experienced a double peak, where the price surged to new all-time highs twice before entering a prolonged bear market. If Bitcoin follows this pattern, we could be on the verge of significant price movements in the coming weeks. After overlaying the price action fractal from this period over our current cycle and standardizing the returns, the similarities are instantly noticeable.
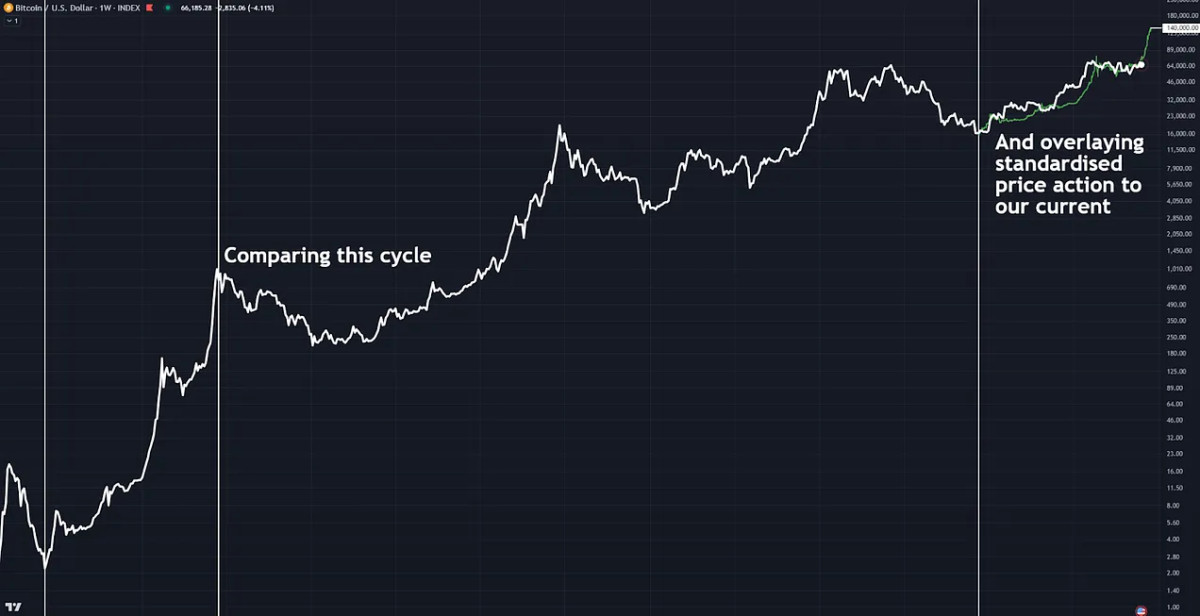
In both cases, Bitcoin had a rapid run-up to a new high, followed by a long, choppy period of consolidation. If history repeats itself, we could see a massive price rally soon, potentially to around $140,000 before the end of the year when accounting for diminishing returns.
Patterns In Investor Behavior
Another valuable metric to examine is the Value Days Destroyed (VDD). This metric weights BTC movements by the amount being moved and the time since it was last transferred and multiplies this value by the price to offer insights into long-term investors’ behavior, specifically profit-taking.
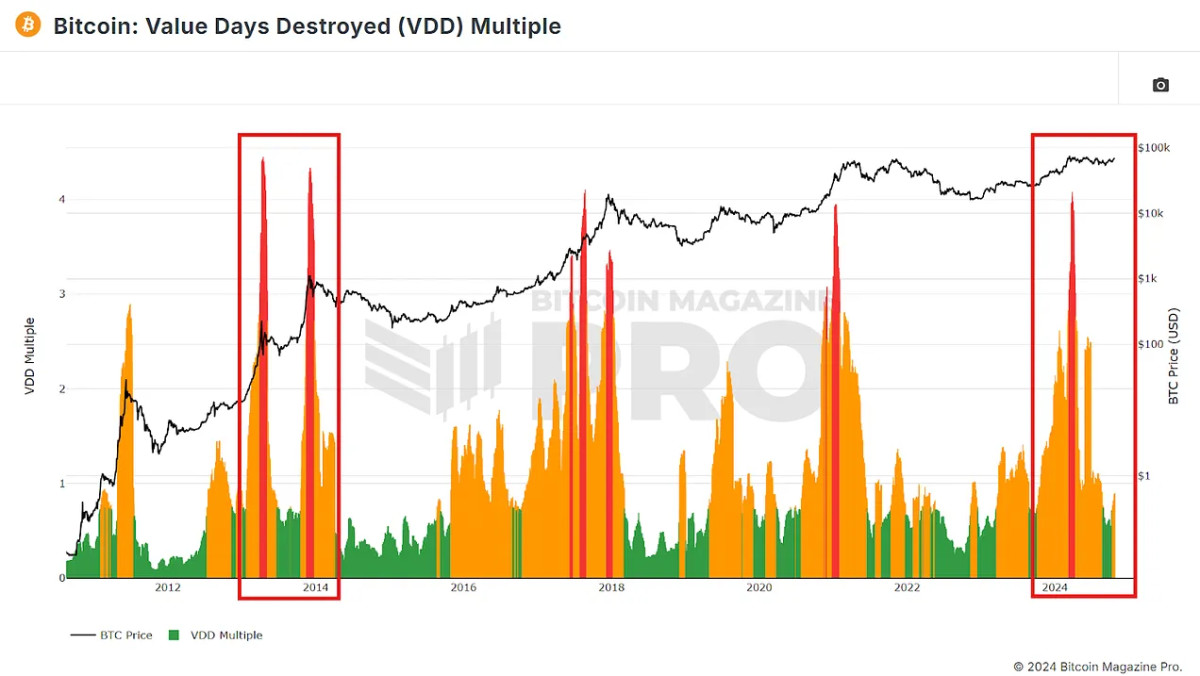
In the current cycle, VDD has shown an initial spike similar to the red spikes we saw during the 2013 double peak. This run-up as BTC ran to a new all-time high earlier this year before a sustained consolidation period could see us reaching new highs soon again if this double peak cycle pattern continues.
A More Realistic Scenario
As Bitcoin has grown and matured as an asset, we’ve seen extended cycles and diminishing returns in our two most recent cycles compared to our initial two. Therefore, it’s probably more likely that BTC follows the cycle in which we’re seeing the strongest correlation in price action.
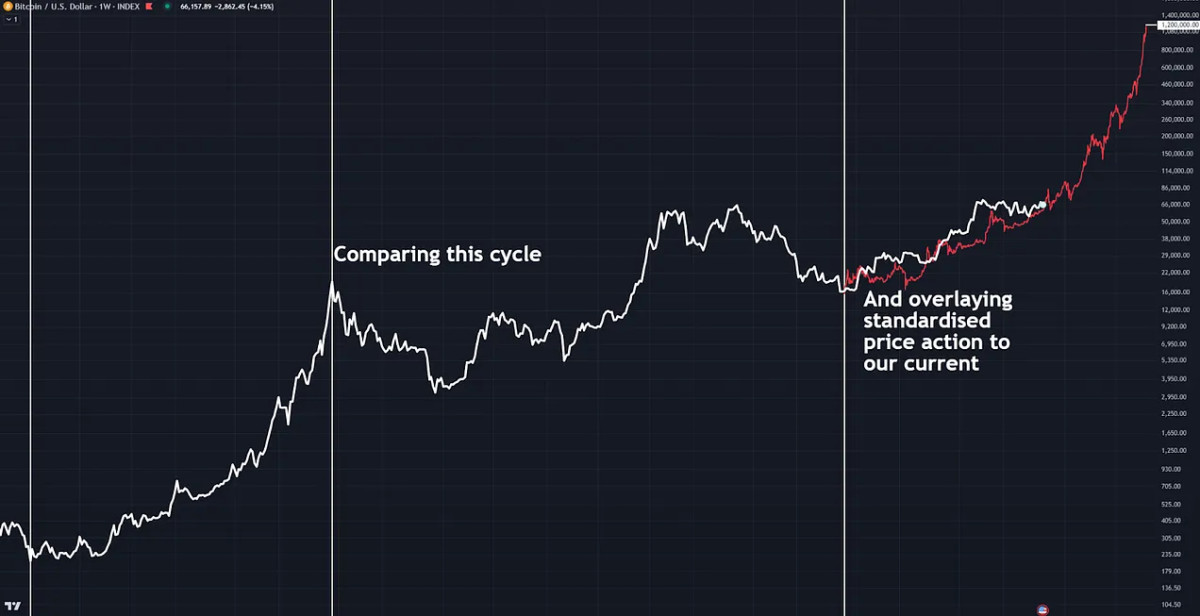
Figure 6: Overlaying a fractal of the 2017 cycle on our current price action.
If Bitcoin follows the 2015-2017 pattern, we could still see new all-time highs before the end of 2024, but the rally would likely be slower and more sustainable. This scenario predicts a price target of around $90,000 to $100,000 by early 2025. After that, we could see continuous growth throughout the year, with a potential market peak in late 2025, although a peak of $1.2 million if we follow this pattern exactly may be optimistic!
Conclusion
Historical data suggests we’re approaching a critical turning point. Whether we follow the explosive double-peak cycle from 2011-2013 or the slower but steady rise of 2015-2017, the outlook for Bitcoin remains bullish. Monitoring key metrics like the MVRV ratio and Value Days Destroyed will provide further clues as to where the market is headed, and comparing correlations with our previous cycles will give us better insights into what may be coming.
With Bitcoin poised for a breakout, whether in the next few weeks or in 2025, if BTC even remotely follows the patterns of any of our previous cycles, investors should prepare for significant price action and potential new all-time highs sooner rather than later.
For a more in-depth look into this topic, check out a recent YouTube video here: Comparing Bitcoin Bull Runs: Which Cycle Are We Following
Source link


The Bitcoin Pi Cycle Top Indicator has gained legendary status in the Bitcoin community for its uncanny accuracy in identifying market cycle peaks. Historically, it has timed every single Bitcoin cycle high with remarkable precision—often within just three days. Could it work its magic again this cycle? Let’s dive deeper into how it works and its significance in navigating Bitcoin’s market cycles.

What is the Pi Cycle Top Indicator?
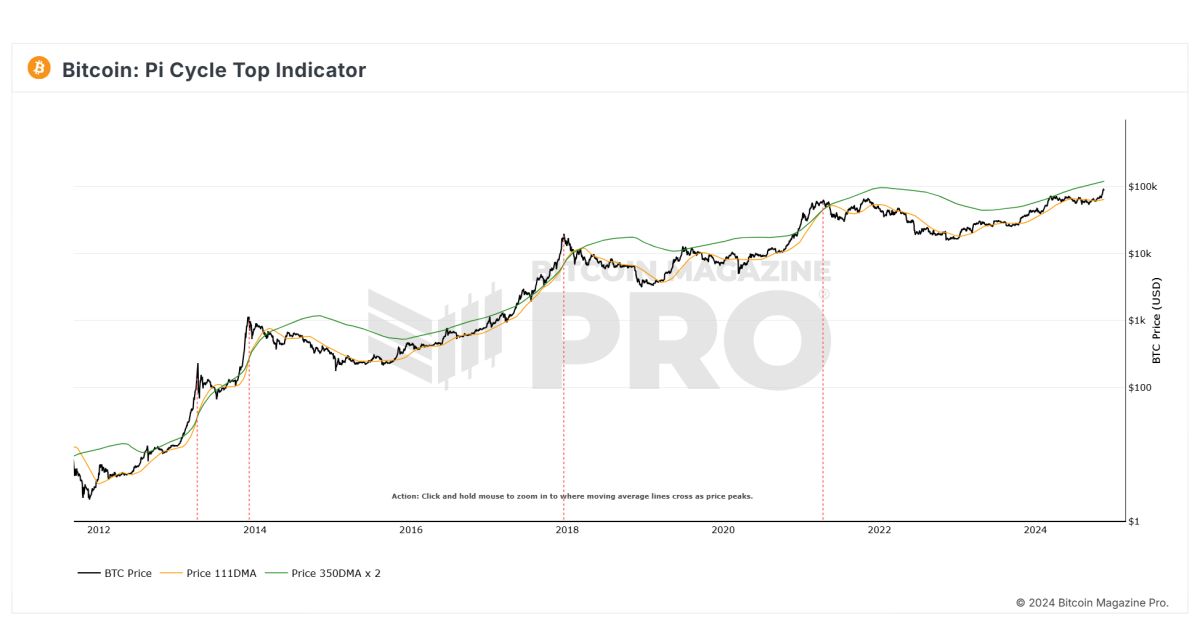
The Pi Cycle Top Indicator is a tool designed to identify Bitcoin’s market cycle tops. Created by Philip Swift, Managing Director of Bitcoin Magazine Pro in April 2019, this indicator uses a combination of two moving averages to forecast cycle highs:
- 111-Day Moving Average (111DMA): Represents the shorter-term price trend.
- 350-Day Moving Average x 2 (350DMA x 2): A multiple of the 350DMA, which captures longer-term trends.
When the 111DMA rises sharply and crosses above the 350DMA x 2, it historically coincides with Bitcoin’s market cycle peak.
The Mathematics Behind the Name
Interestingly, the ratio of 350 to 111 equals approximately 3.153—remarkably close to Pi (3.142). This mathematical quirk gives the indicator its name and highlights the cyclical nature of Bitcoin’s price action over time.
Why Has It Been So Accurate?
The Pi Cycle Top Indicator has been effective in predicting the peaks of Bitcoin’s three most recent market cycles. Its ability to pinpoint the absolute tops reflects Bitcoin’s historically predictable cycles during its adoption growth phase. The indicator essentially captures the point where the market becomes overheated, as reflected by the steep rise of the 111DMA surpassing the 350DMA x 2.
How Can Investors Use This Indicator?
For investors, the Pi Cycle Top Indicator serves as a warning sign that the market may be approaching unsustainable levels. Historically, when the indicator flashes, it has been advantageous to sell Bitcoin near the top of the market cycle. This makes it a valuable tool for those seeking to maximize gains and minimize losses.
However, as Bitcoin matures and integrates further into the global financial system—bolstered by developments like Bitcoin ETFs and institutional adoption—the effectiveness of this indicator may diminish. It remains most relevant during Bitcoin’s early adoption phase.
A Glimpse Into the Future
The big question now is: will the Pi Cycle Top Indicator remain accurate in this cycle? With Bitcoin entering a new era of adoption and market dynamics, its cyclical patterns may evolve. Yet, this tool has proven its worth repeatedly over Bitcoin’s first 15 years, offering investors a reliable gauge of market tops.
Final Thoughts
The Pi Cycle Top Indicator is a testament to Bitcoin’s cyclical nature and the power of mathematical models in understanding its price behavior. While its past accuracy has been unparalleled, only time will tell if it can once again predict Bitcoin’s next market cycle peak. For now, it remains an indispensable tool for those navigating the thrilling highs and lows of Bitcoin.
Explore the full chart and stay informed.
Source link
As Bitcoin once again finds itself in price discovery mode, market watchers and enthusiasts are curious: has retail FOMO set in yet, or is the retail surge we’ve seen in past bull cycles still on the horizon? Using data from active addresses, historical cycles, and various market indicators, we’ll examine where the Bitcoin market currently stands and what it might signal about the near future.
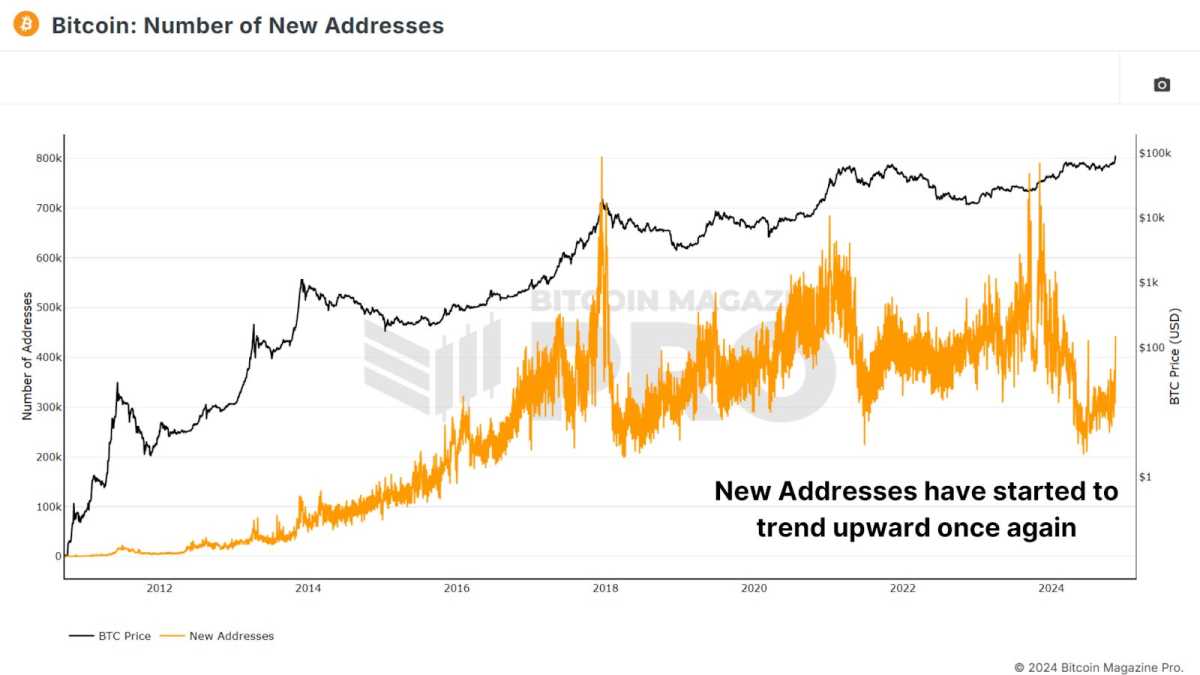
Rising Interest
One of the most direct signs of retail interest is the number of new Bitcoin addresses created. Historically, sharp increases in new addresses have often marked the beginning of a bull run as new retail investors flood into the market. In recent months, however, the growth in new addresses hasn’t been as sharp as one might expect. Last year, we saw around 791,000 new addresses created in a single day—a sign of considerable retail interest. In comparison, we now hover significantly lower, although we have recently seen a modest uptick in new addresses.

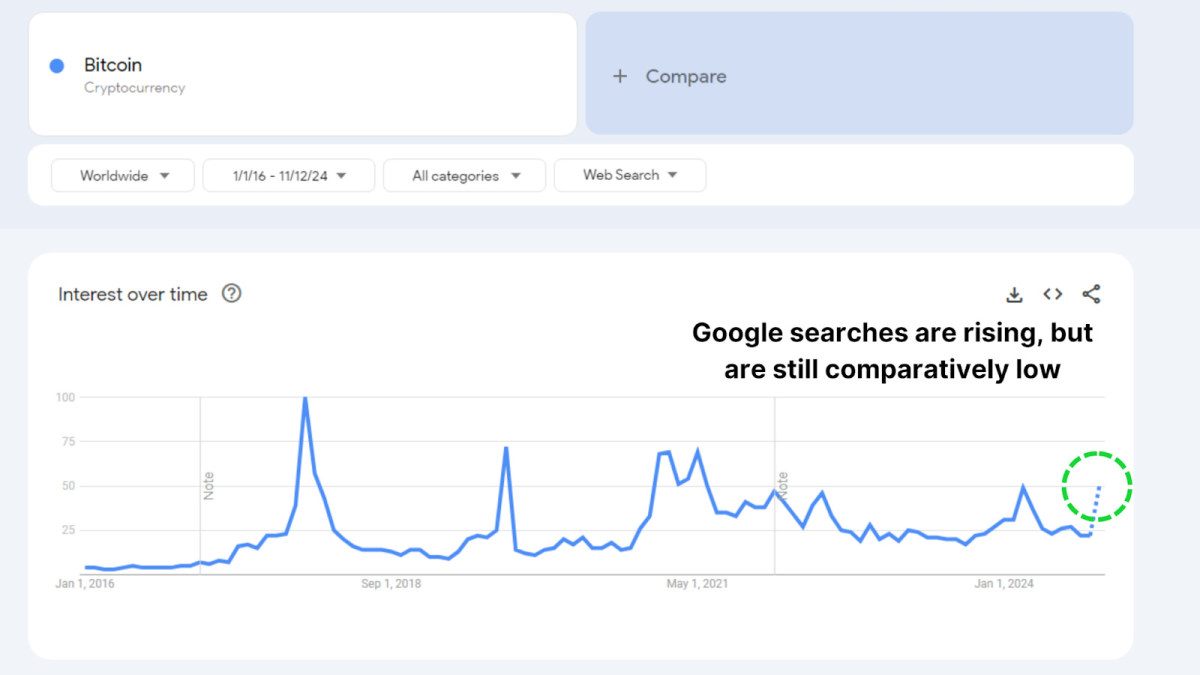
Google Trends also reflects this tempered interest. Although searches for “Bitcoin” have been increasing in the past month, they remain far below previous peaks in 2021 and 2017. It seems that retail investors are showing a renewed curiosity but not yet the fervent excitement typical of FOMO-driven markets.
Supply Shift
We are witnessing a slight transition of Bitcoin from long-term holders to newer, shorter-term holders. This shift in supply can hint at the potential start of a new market phase, where experienced holders begin taking profits and selling to newer market participants. However, the overall number of coins transferred remains relatively low, indicating that long-term holders aren’t yet parting with their Bitcoin in significant volumes.
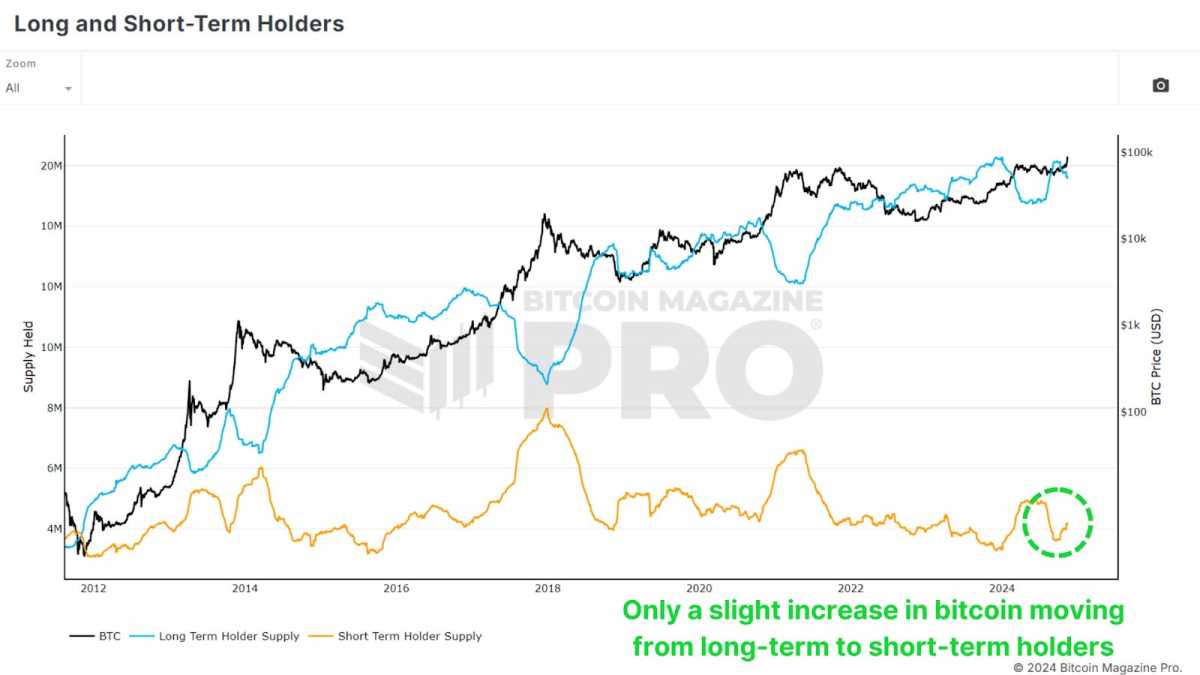
Historically, during the last bull run in 2020-2021, we saw large outflows from long-term holders to newer investors, which fueled a subsequent price rally. Currently, the shift is only minor, and long-term holders seem largely unfazed by current price levels, opting to hold onto their Bitcoin despite market gains. This reluctance to sell suggests that holders are confident in further upside potential.
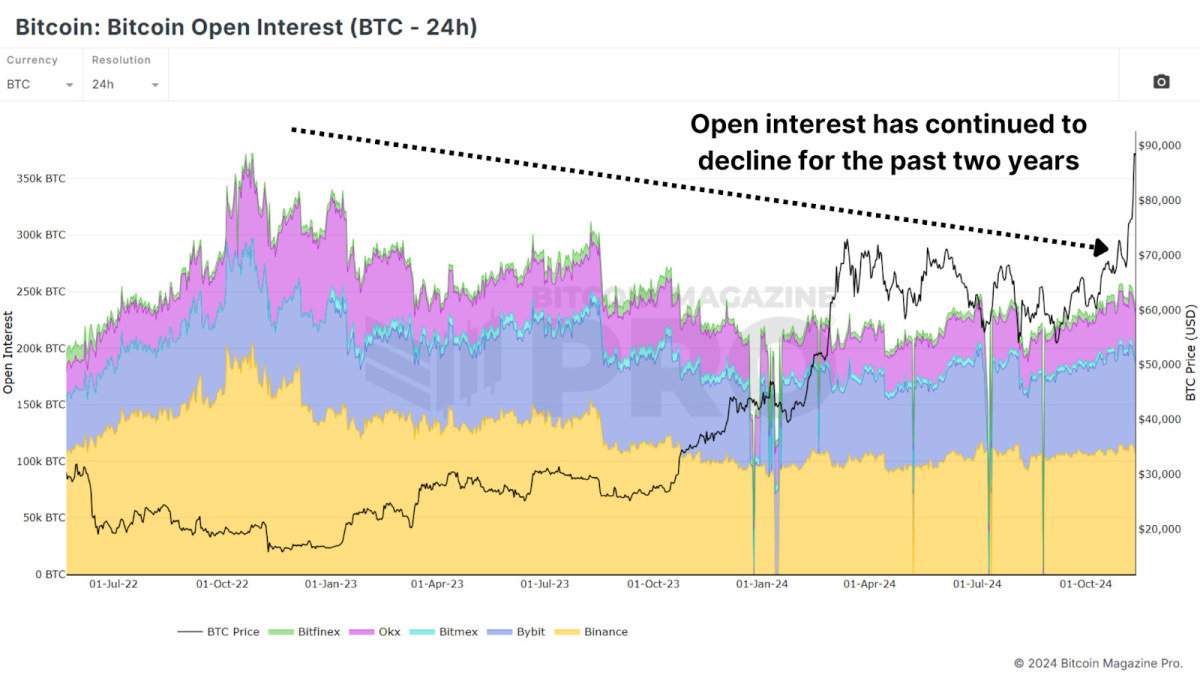
A Spot-Driven Rally
A key aspect of Bitcoin’s latest rally is its spot-driven nature, in contrast to previous bull runs heavily fueled by leveraged positions. Open interest in Bitcoin derivatives has seen only minor increases, which stands in sharp contrast to prior peaks. For instance, open interest was significant before the FTX crash in 2022. A spot-driven market, without excessive leverage, tends to be more stable and resilient, as fewer investors are at risk of forced liquidation.
Big Holders Accumulating
Interestingly, while retail addresses haven’t increased substantially, “whale” addresses holding at least 100 BTC have been rising. Over the past few weeks, wallets with large BTC holdings have added tens of thousands of coins, amounting to billions of dollars in value. This increase signals confidence among Bitcoin’s largest investors that the current price levels have more room to grow, even as Bitcoin reaches all-time highs.
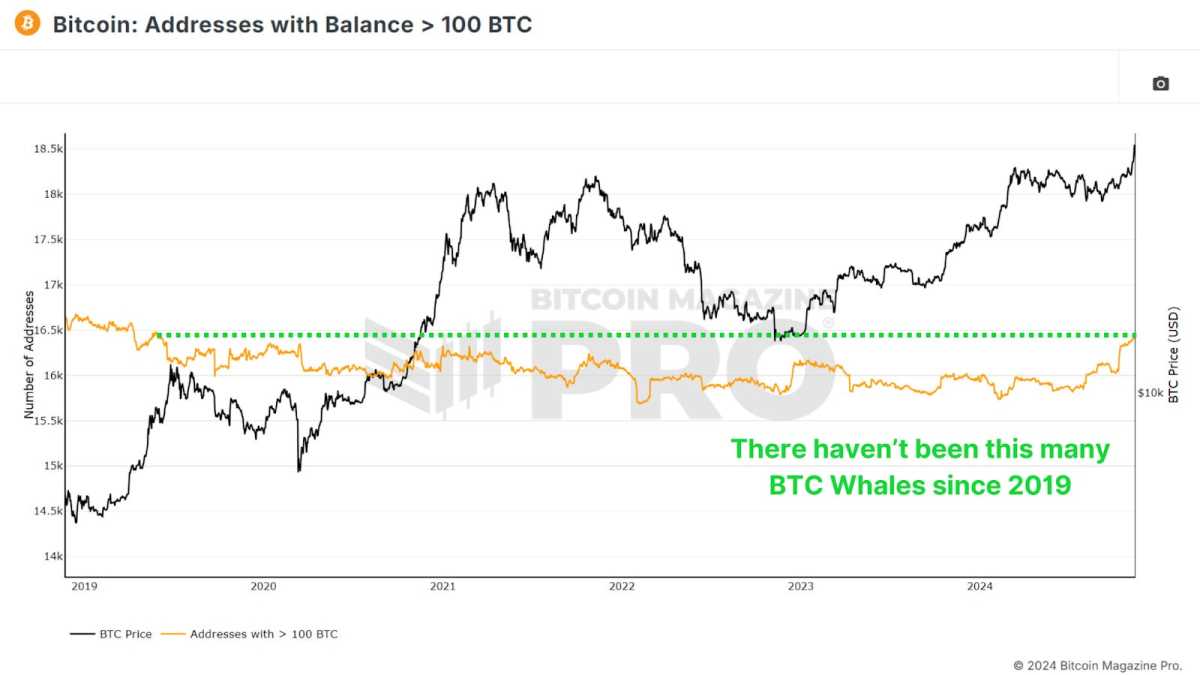
In past bull cycles, we saw whales exit or decrease their positions near market peaks, a behavior we’re not seeing this time. This trend of accumulation by experienced holders is a strong bullish indicator, as it suggests faith in the market’s long-term potential.
Conclusion
While Bitcoin’s rally to all-time highs has brought renewed attention, we’re not yet seeing the telltale signs of widespread retail FOMO. The subdued retail interest suggests we may be only in the beginning phase of this rally. Long-term holders remain confident, whales are accumulating, and leverage remains modest, all indicators of a healthy, sustainable rally.
As we continue into this bull cycle, the market’s structure suggests that the potential for a larger retail-driven surge remains ahead. If this retail interest materializes, it could propel Bitcoin to new heights.
For a more in-depth look into this topic, check out a recent YouTube video here: Has Retail Bitcoin FOMO Begun?
Source link

Predicting Bitcoin’s price has always been a hot topic for investors. Matt Crosby, lead market analyst at Bitcoin Magazine Pro, explores this topic in his recent video, “Truth About Bitcoin Stock To Flow, Power Law & Price Models“. Here, we break down Crosby’s key insights to help investors enhance their Bitcoin strategies.
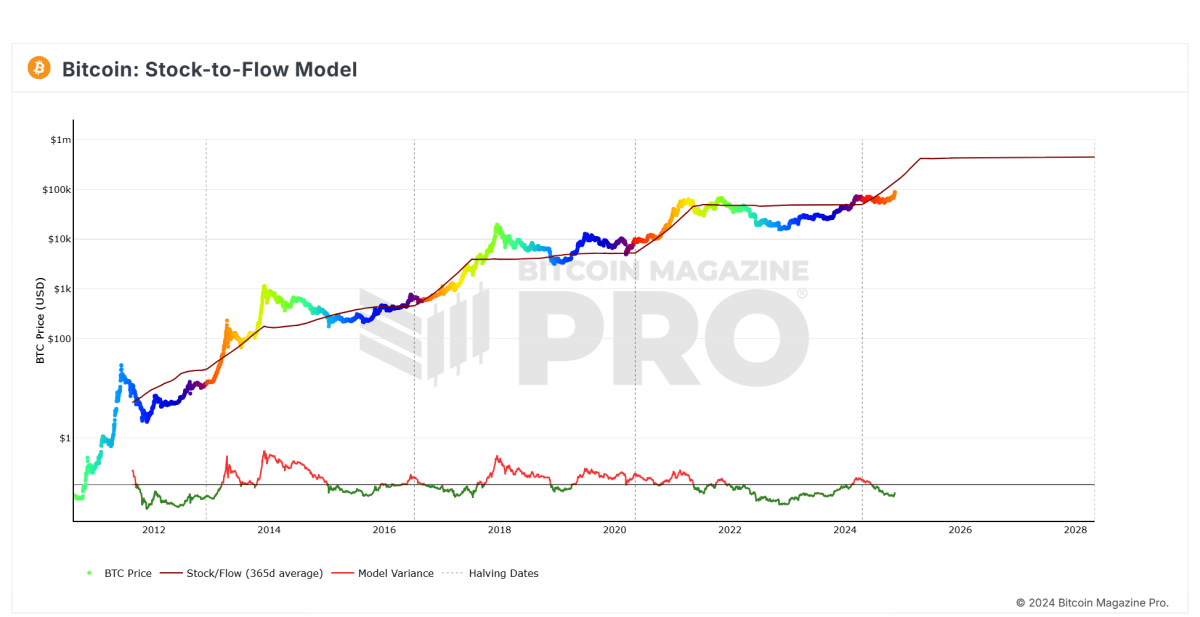
Stock-to-Flow (S2F): A Useful Tool, Not a Crystal Ball
The Stock-to-Flow (S2F) model is one of the most popular ways to predict Bitcoin prices, and Crosby explains its benefits and drawbacks clearly.
Key Takeaways:
- What Is S2F? S2F assesses Bitcoin’s scarcity by comparing the “stock” (current supply) to the “flow” (newly mined coins), similar to how rare commodities like gold are evaluated.
- Updated Predictions: The Cross-Asset S2F model initially forecasted Bitcoin hitting $288,000 between 2020 and 2024. More recently, it suggested a possible valuation of $420,000 by April 2025.
- Limitations: S2F works until unexpected events—like global economic changes—disrupt Bitcoin’s usual patterns. Crosby aptly points out, “S2F works until it doesn’t.”
While S2F is a helpful guide, it’s essential for investors to consider broader market conditions and macroeconomic influences alongside it.
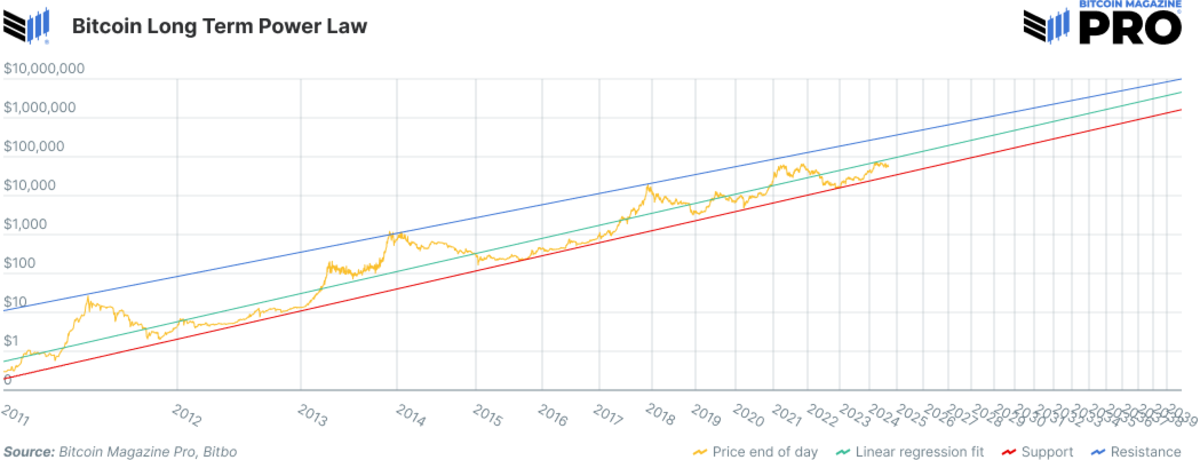
Bitcoin Power Law: The Long-Term View
Crosby also explores the Bitcoin Power Law, a model that uses a log-log chart to illustrate Bitcoin’s historical price patterns.
Why It Matters:
- Logarithmic Scaling: By using logarithmic scaling, the Power Law highlights Bitcoin’s long-term trend of reduced volatility and moderated growth.
- Limitations: This model offers insights for the long haul but is less helpful for short-term predictions or market surprises.
For investors aiming to diversify their portfolios and strategically time their investments, the Power Law provides context but should be used with other, more dynamic tools.
Real-Time Metrics: The Key to Adaptability
Crosby emphasizes the limits of static models like S2F and the Power Law, advocating for real-time, data-driven approaches instead.
Tools Investors Should Use:
- MVRV Z-Score: Measures market cap against realized cap, identifying when Bitcoin is overvalued or undervalued.
- SOPR (Spent Output Profit Ratio): Provides insights into market sentiment by tracking profit-taking behavior.
- On-Chain Metrics: Metrics like Bitcoin’s realized price and value-days-destroyed help detect market turning points.
These metrics give investors the tools to adapt their strategies to the market’s behavior in real-time rather than relying solely on predictions.
Why External Factors Matter
Crosby cautions against relying only on Bitcoin-specific data, emphasizing the importance of external factors:
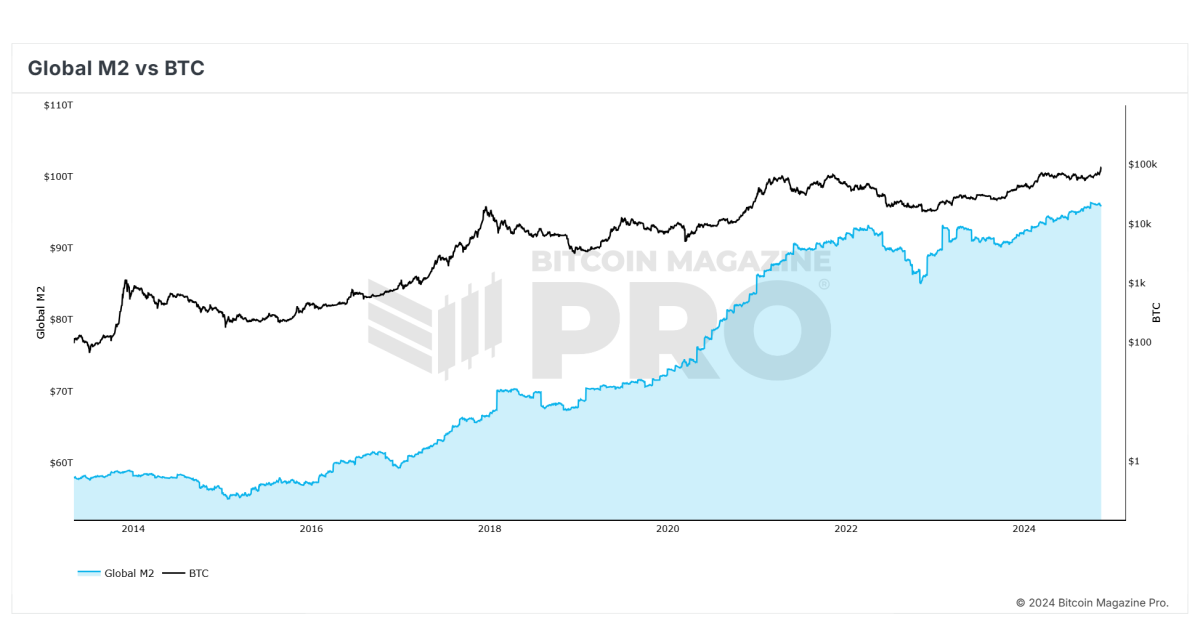
- Global Liquidity: Bitcoin’s price often moves with global liquidity cycles, making macroeconomic awareness crucial.
- Institutional Adoption: Actions by major players such as sovereign wealth funds, corporate treasuries, or institutional asset managers can greatly influence Bitcoin’s price.
- Regulatory Changes: Government decisions to regulate or adopt Bitcoin can significantly affect its valuation.
Incorporating both macroeconomic factors and Bitcoin-specific metrics is key for a well-rounded analysis.
Final Thoughts: Stay Pragmatic
Crosby concludes by reminding investors that no single model can predict Bitcoin’s price with certainty. Instead, these tools should be used to provide structure and insight into an unpredictable asset.
Practical Tips for Investors:
- Use Multiple Models: Cross-check predictions using different models to gain a clearer understanding of the market.
- Embrace Real-Time Data: Rely on metrics like MVRV Z-score and SOPR for timely, actionable insights.
- Adapt to Change: Be ready to adjust strategies based on both internal data and external influences.
Bitcoin Magazine Pro offers advanced analytics and real-time data to help investors navigate this fast-paced market. To dive deeper into Crosby’s insights, watch the full video here: Truth About Bitcoin Stock To Flow, Power Law & Price Models.
Source link

Pi Network Coin Price Surges As Key Deadline Nears

How Viable Are BitVM Based Pegs?

UK Government to Draft a Regulatory Framework for Crypto, Stablecoins, Staking in Early 2025

Bitcoin Cash eyes 18% rally

Rare Shiba Inu Price Patterns Hint SHIB Could Double Soon

The Bitcoin Pi Cycle Top Indicator: How to Accurately Time Market Cycle Peaks
Bitcoin Breakout At $93,257 Barrier Fuels Bullish Optimism

Bitcoin Approaches $100K; Retail Investors Stay Steady

Solana Hits New ATH On Huge Whale Accumulation, More Gains Ahead?

Microsoft Should Buy $78 Billion Worth of Bitcoin

Ethereum Believers May Be Staring Down Opportunity As ETH Reaches Another Low Against Bitcoin: CryptoQuant CEO

UK government is ready for crypto regulations next year

“Crypto Dad” Chris Giancarlo Emerges Top For White House Crypto Czar Role
Bitcoin Nears $100,000 As Trump Council Expected To Implement BTC Reserve

Know Your Missiles: Russia’s Experimental Hypersonic Missile Is A New Kind of Killing Machine
182267361726451435

Top Crypto News Headlines of The Week
Why Did Trump Change His Mind on Bitcoin?

New U.S. president must bring clarity to crypto regulation, analyst says

Ethereum, Solana touch key levels as Bitcoin spikes

Bitcoin Open-Source Development Takes The Stage In Nashville

Will XRP Price Defend $0.5 Support If SEC Decides to Appeal?

Bitcoin 20% Surge In 3 Weeks Teases Record-Breaking Potential

Ethereum Crash A Buying Opportunity? This Whale Thinks So

Shiba Inu Price Slips 4% as 3500% Burn Rate Surge Fails to Halt Correction

‘Hamster Kombat’ Airdrop Delayed as Pre-Market Trading for Telegram Game Expands

Washington financial watchdog warns of scam involving fake crypto ‘professors’

Citigroup Executive Steps Down To Explore Crypto
Mostbet Güvenilir Mi – Casino Bonus 2024

Bitcoin flashes indicator that often precedes higher prices: CryptoQuant

 2 months ago
182267361726451435
 24/7 Cryptocurrency News3 months ago
Top Crypto News Headlines of The Week

 Donald Trump4 months ago
Why Did Trump Change His Mind on Bitcoin?
 News3 months ago
New U.S. president must bring clarity to crypto regulation, analyst says
 Bitcoin4 months ago
Ethereum, Solana touch key levels as Bitcoin spikes
 Opinion4 months ago
Bitcoin Open-Source Development Takes The Stage In Nashville
 Price analysis3 months ago
Will XRP Price Defend $0.5 Support If SEC Decides to Appeal?
 Bitcoin4 months ago
Bitcoin 20% Surge In 3 Weeks Teases Record-Breaking Potential
