bull market
Crypto turns green as Bitcoin flirts with $73k
Published
3 weeks agoon
By
admin

Most cryptocurrencies are trading in the green in the past 24 hours, as Bitcoin price rose to $73,000 to push the global crypto market cap to $2.45 trillion.
This happens as Bitcoin (BTC), the flagship digital asset, topped $73,000 on Oct. 29. This is the highest level for BTC since bulls hit the all-time high in March2024.
Per crypto.news data, BTC price rose to highs of $73,001 across major exchanges, with a 5.7% surge in 24 hours. This meant bulls touched the psychological $73,000 mark again. While Bitcoin trades just below $72,930 at the time of writing, crypto analysts suggest bulls may not be done yet.
In an Oct. 28 interview with CNBC, VanEck head of digital assets Matthew Sigel said the current market, including the Nov. 5 vote, offers a very bullish setup for Bitcoin.
Veteran trader Peter Brandt also added to the bullish projection, suggesting BTC is headed to $94k.
B I T C O I N $BTC
There are numerous ways to determine targets. One variable is whether semi-log or linear scale is used
Target of 94,000 is measured move of triangle projected from breakout level on semi-log
⬇️ 🧵 1/3 pic.twitter.com/VI0n7OAvia— Peter Brandt (@PeterLBrandt) October 29, 2024
Some analysts expect a breakout past the ATH will invite a breather as likely profits attract bids. However, the more bullish perspective is that the market is set to continue higher in coming months.
This sentiment has helped push most altcoins higher. Ethereum (ETH) is above $2,650, BNB (BNB) above $607 and Solana (SOL) $181. Sui (SUI) is up 24% to $2.03, while meme coins have also pumped, led by Popcat (POPCAT).
However, there are sectors that have outpaced the rest and could continue to dominate.
According to crypto analyst Miles Deutscher, memes with +219% year-to-date are the top performing sector. However, also outpacing the rest of the market have been artificial intelligence, real-world assets, Bitcoin ecosystem and decentralized physical infrastructure network.
Per the analyst, AI tokens are up 217% YTD as are BRC-20 tokens, while RWA (+134%) and DePIN (+73%) have topped amid the 2024 bull cycle.
But not all sectors are enjoying an uptick year-to-date. While coins in social finance, zero-knowledge and metaverse have nudged higher in recent weeks, SocialFi is down 57%, ZK -36% and metaverse -30% to rank among worst performing sectors. Governance tokens and layer-2 tokens are also in this category, with -25% and -16% YTD returns respectively.
Source link
You may like


Jason "Spaceboi" Lowery's Bitcoin "Thesis" Is Incoherent Gibberish


Bankrupt Crypto Exchange FTX Set To Begin Paying Creditors and Customers in Early 2025, Says CEO


Top crypto traders’ picks for explosive growth by 2025


3 Tokens Ready to 100x After XRP ETF Gets Approval


Gary Gensler’s Departure Is No Triumph For Bitcoin


Magic Eden Token Airdrop Date Set as Pre-Market Value Hits $562 Million

The global cryptocurrency market capitalization surged by an impressive 16.3% last week, reaching a record high of $3.2 trillion and gaining $430 billion in valuation for the week.
Bitcoin (BTC) led the charge, achieving a new all-time high above $93,000. Here are some of last week’s other standout performers to watch:
XRP finally reclaims $1
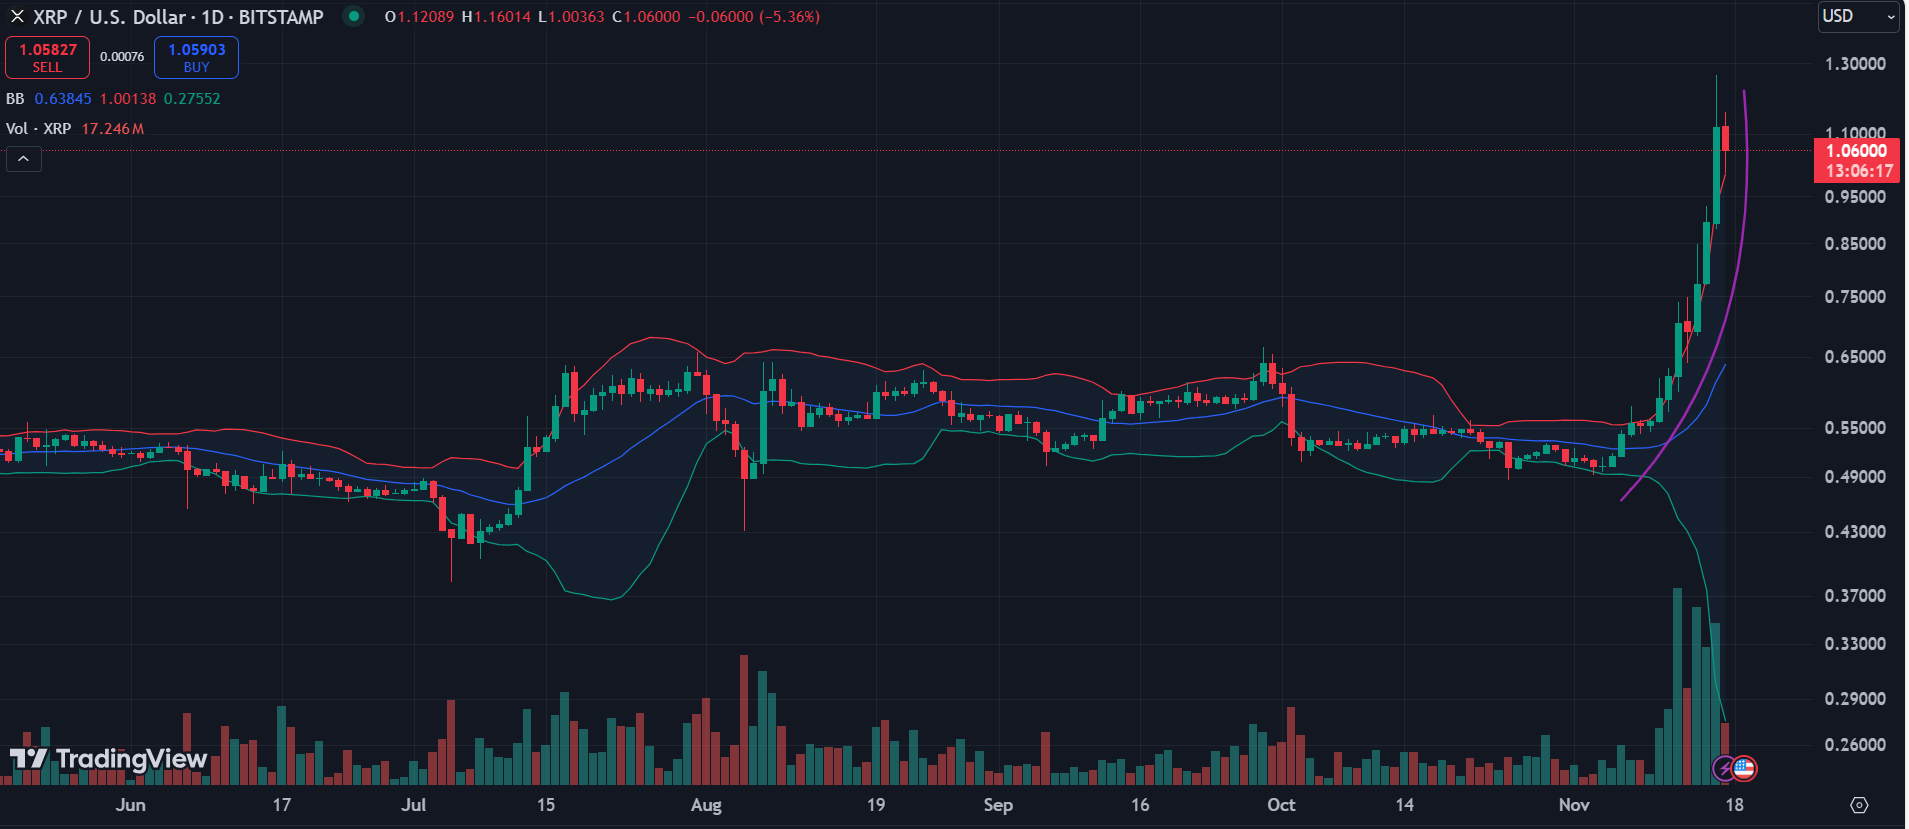
After underperforming at the start of the market uptrend two weeks ago, Ripple’s XRP (XRP) staged an impressive solo rally last week, closing with a remarkable 100% gain and solidifying its position among the top performers.

The asset began the week trading below the critical $0.60 mark, following a dip from a $0.57 high days earlier. However, it gained momentum amid the market rally, surpassing $0.60 on Nov. 11.
Defying a slowdown in the broader market, XRP continued its upward trajectory, breaking through the $1 barrier on Nov. 16 for the first time in three years. The rally peaked at $1.26 before facing a pullback, though XRP managed to hold above $1, ending the week at $1.12.
Should the pullback persist this week, traders should monitor the upper Bollinger Band at $0.9980, as a drop below this level could signal further downward pressure.
XLM rallies 115%
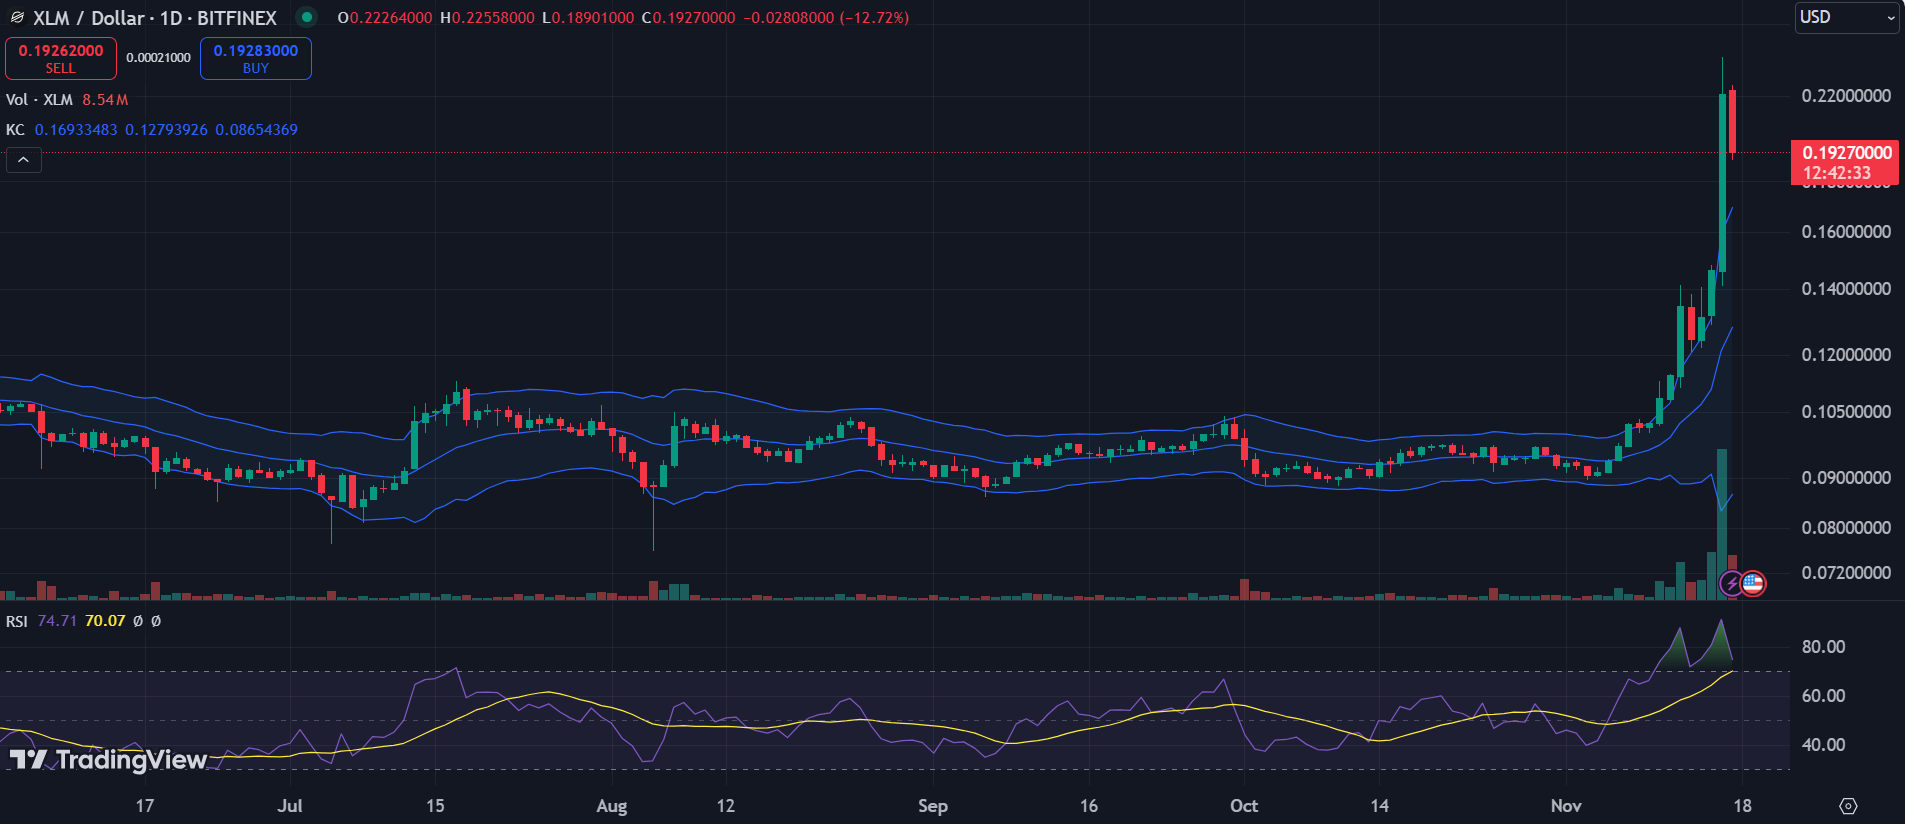
Stellar (XLM), which often mirrors XRP’s price movements, delivered an equally impressive rally last week, recording a staggering 115% surge by the week’s close.

The majority of these gains were realized on Nov. 16, with XLM posting a 50.95% increase. This upward momentum was triggered by a breakout above the upper boundary of the Keltner Channel on Nov. 15, propelling XLM past the $0.13 mark.
However, the new week has seen XLM facing a sharp 12% decline, accompanied by a drop in its RSI, signaling weakening momentum.
Despite this, the RSI remains at 75, indicating it is still in oversold territory. For now, bulls remain in control as long as XLM holds above the upper Keltner Channel boundary at $0.1693.
LTC knocks at $100
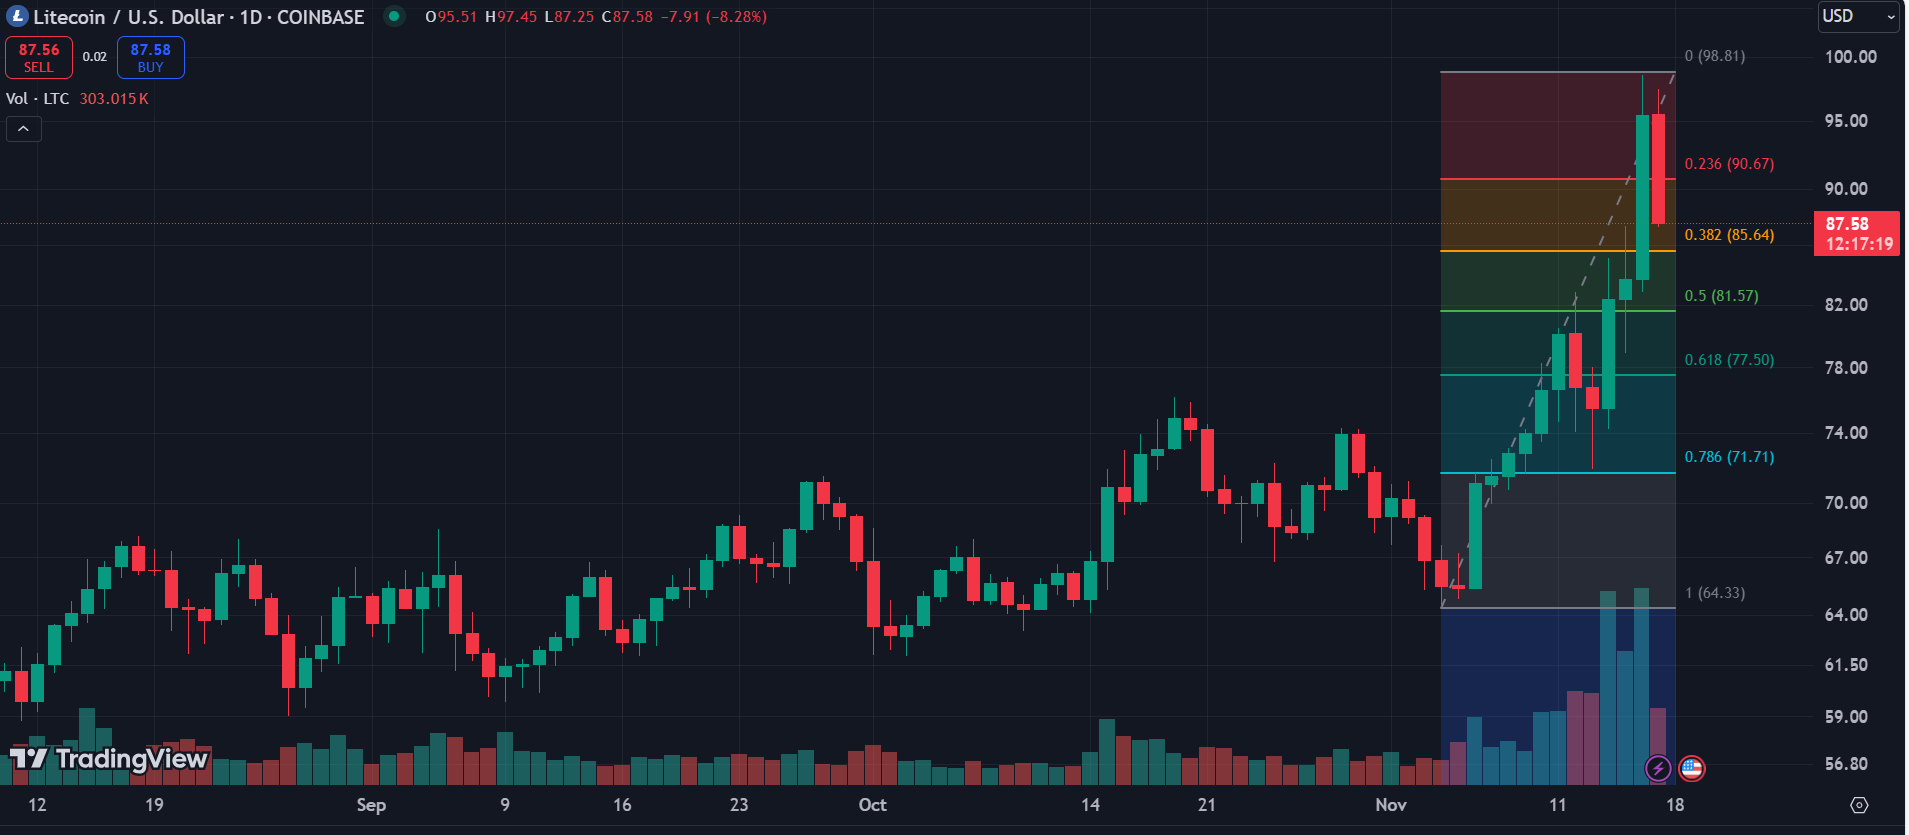
Litecoin (LTC) initially trailed in the broader market uptrend but experienced a significant rally last week, breaking through the $70 range. The asset initially spiked to $80 on Nov. 11 before retreating to $71 two days later.

A subsequent recovery pushed LTC above $90 for the first time since May, reaching a seven-month high of $98 on Nov. 16. However, resistance at the critical $100 level halted further gains.
LTC ended the week with a solid 29% gain but has since declined by 8.36% in the new week. The rally was partly fueled by a surge in social media mentions, as the Litecoin community humorously explored a pivot to meme coin status.
Due to current market conditions I now identify as a memecoin.
— Litecoin (@litecoin) November 14, 2024
Currently trading at $87.58, LTC finds immediate support at the 38.2% Fibonacci retracement level around $85.64. If this level is breached, the next line of defense lies at $81.57 to prevent a drop below $80.
On the upside, Litecoin needs to clear $90.67 to regain bullish momentum.
Source link

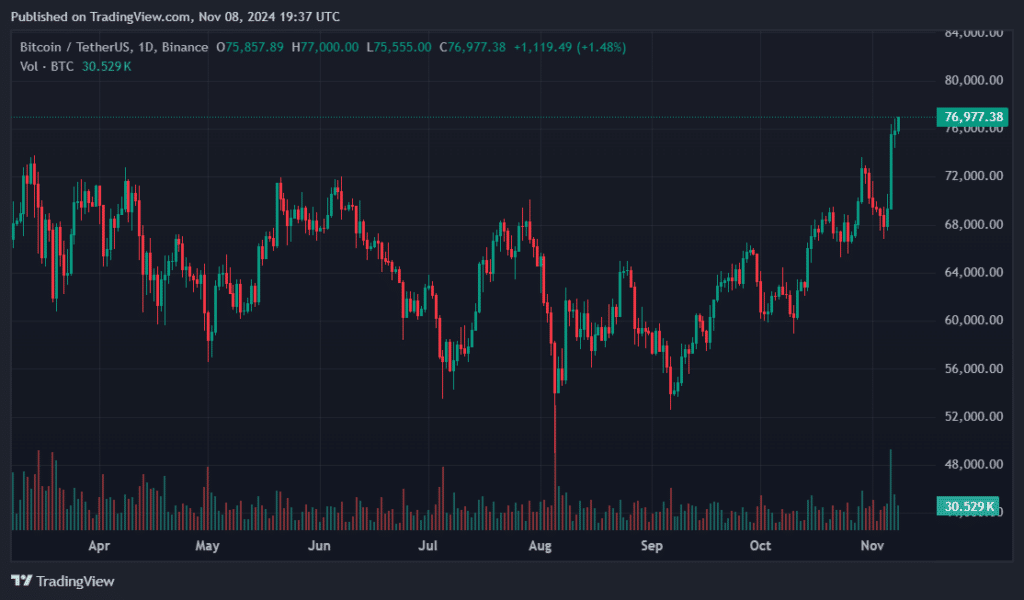
Bitcoin crossed $77,000 on Friday, Nov. 8, setting a new all-time high for the second consecutive day.
Bitcoin (BTC) reached a new all time high of $77,020 roughly 48 hours after Donald Trump won the U.S. presidential election, along with the election of several pro-crypto policymakers to Congress. With a market cap of $1.5 trillion, Bitcoin now ranks as the world’s ninth most valuable asset, surpassing Mark Zuckerberg’s Meta.
BTC’s year-to-date growth has exceeded 118% with this recent surge. Over the past 30 days, Bitcoin has increased by nearly 25% as seasonal trends and halving-year data indicated bullish prospects. During the last two election cycles, Bitcoin has reached new highs and has not returned to pre-election levels.

Policy plans
For the first time, crypto money played a significant role in funding political action committees, leading experts and opinion leaders to anticipate progressive digital asset regulations from Washington. A BTC bill from Wyoming Senator Cynthia Lummis appears to be a frontrunner in what could become a new crypto policy landscape.
Like President-elect Donald Trump, Sen. Lummis pushed for a strategic national Bitcoin reserve and more. The proposal from Lummis would implement a BTC buying plan, piling on America’s existing 203,000 Bitcoin stockpile.
Lummis suggested acquiring 1,000,000 BTC over five years, which would cost the U.S. an estimated $77 billion if Bitcoin’s price remained constant over that period.
Bitcoin price
BTC ambassadors like Michael Saylor and the larger crypto community predict prices are going higher. Targets of $100,000 by year’s end, and $200,000 by 2025 have mentioned by investors and experts alike.
Investors already splurged $72 billion buying into Bitcoin via Wall Street exchange-traded funds. State like Detroit and Wyoming have announced some form of Bitcoin adoption. Marshalled interests between crypto titans did not disband following victory in the 2024 U.S. elections.
Crypto-focused super PAC Fairshake has raised over $78 million for the 2026 mid-terms. The organization disclosed donations from A16z crypto and Coinbase even before the Associated Press declared voting results.
I think @standwithcrypto did amazing work this election cycle to rate political candidates on crypto issues and apply pressure.
There’s still more work to do.
The largest cohort of U.S. politicians is still ranked undecided. pic.twitter.com/EuARsSAZs3
— RYAN SΞAN ADAMS – rsa.eth 🦄 (@RyanSAdams) November 7, 2024
Source link
bull market
How Trump’s Promises Could Influence BTC $250k forecast
Published
2 weeks agoon
November 7, 2024By
admin

As analysts predict Bitcoin could reach $250K, how might Trump’s promises influence this potential? What should you be watching for in the coming months?
Trump triumphs
Donald Trump is back in the Oval Office, officially winning the 2024 U.S. presidential election as the 47th president. After a high-energy election night celebration at Mar-a-Lago with guests including Elon Musk and Robert F. Kennedy Jr., digital asset markets surged in response.
Bitcoin (BTC) rocketed past $75,000, reaching a fresh all-time high, while crypto-linked stocks like Coinbase and MicroStrategy saw strong after-hours gains.
For crypto supporters, Trump’ win signals more than just another GOP presidency, especially as he has made bold commitments to protect crypto, a notable departure from the past, when Trump’ stance on digital assets was anything but warm.
Moreover, with Trump’ Republican allies securing a Senate majority, the path is now open for the policies he hinted at throughout his campaign—policies that could reshape the future of crypto in both the U.S. and globally.
So, what promises has he made, and what should we expect from his term? Let’s find out.
Trump’s promises to the crypto industry
Bold vision for a national crypto stockpile
One of Trump’ biggest promises to the crypto world is to create what he calls a “strategic national crypto stockpile.” In simple terms, Trump aims to prevent the government from auctioning off seized Bitcoin, instead holding onto it as a national asset.
Trump believes that, just as countries hold reserves of gold or oil, the U.S. should secure a portion of Bitcoin to hedge against future financial uncertainties.
Currently, the U.S. government often auctions off Bitcoin seized from criminal cases, such as after the Bitfinex hack, but Trump has suggested putting a halt to these sales.
This promise is crucial, given that the U.S. Marshals Service has regularly auctioned Bitcoin holdings, sometimes causing temporary market dips. Earlier this year, Germany’s sale of hundreds of millions in seized Bitcoin led to similar price swings.
While Trump hasn’t provided a concrete plan for how this reserve would be managed, some view it as a step toward positioning the U.S. as a global crypto leader.
Creating a strategic Bitcoin reserve
One of Trump’ more intriguing promises is to establish a “strategic Bitcoin reserve” for the U.S. His idea is to retain Bitcoin seized from criminal activities, rather than auctioning it off, to gradually build a substantial national Bitcoin reserve.
This proposal gained further traction when Senator Cynthia Lummis introduced a bill to create a “Bitcoin strategic reserve,” aiming to accumulate one million BTC over five years as a hedge against the national debt.
If realized, this reserve could signal a shift in the U.S. approach to crypto, positioning Bitcoin as a strategic asset on par with gold or foreign currency reserves.
Promise to fire SEC Chair Gary Gensler “on day one”
Trump has also set his sights on the U.S. Securities and Exchange Commission, pledging to fire its current chair, Gary Gensler, on his first day in office.
Appointed by President Joe Biden, Gensler has led an aggressive crackdown on the crypto industry, initiating over 100 enforcement actions against crypto companies for alleged securities violations since he
Gensler’ stance — that much of the crypto industry falls under SEC jurisdiction — has sparked frustration among industry players, who argue they need clearer guidelines, not constant lawsuits.
However, Trump’ promise may not be as straightforward to execute. While the president can appoint the SEC chair, dismissing one requires valid grounds, like neglect or inefficiency, due to the SEC’ independent status.
Legal experts caution that firing Gensler “on day one” could prompt a lengthy review and may not happen as swiftly as Trump suggests.
Still, if Trump does manage to appoint a new SEC chair, it could mark a shift toward more crypto-friendly policies — though how much freedom the new leadership would truly have remains uncertain.
A national push for Bitcoin mining
Another bold promise from Trump is his call to ensure that all remaining Bitcoin is mined within the U.S. He envisions Bitcoin mining as “Made in the USA,” aiming to establish America as a global hub for the industry.
This vision was echoed during a private Mar-a-Lago meeting with key figures in U.S. crypto mining, including executives from major companies like Riot Platforms, Marathon Digital, and Core Scientific.
Trump’ goal aligns with his broader agenda of “energy dominance” for the U.S., believing that Bitcoin mining could boost energy production and decrease reliance on foreign energy sources.
However, the path to this goal is challenging. Bitcoin mining is decentralized by nature, relying on thousands of miners across the globe. Centralizing it within one country would contradict the decentralized ethos on which Bitcoin was built.
Moreover, about 90% of Bitcoin’ total supply has already been mined, leaving only a small yet symbolically significant portion — around 10% — that Trump hopes to bring under U.S. control.
Stopping the central bank digital currency development
Trump has also pledged to block any progress toward a central bank digital currency in the U.S. He made his stance clear: “There will never be a CBDC while I’m president”, citing that CBDCs pose a potential threat to financial privacy.
Unlike decentralized cryptocurrencies like Bitcoin, a CBDC would be fully controlled by the government, potentially allowing for extensive surveillance of citizens’ transactions.
Trump’ position aligns with other Republican leaders, such as Ron DeSantis, who recently signed a bill in Florida to limit CBDC use within the state.
Opposition to CBDCs is also building in Congress. Representative Tom Emmer introduced the CBDC Anti-Surveillance State Act, aiming to prevent the Federal Reserve from issuing a CBDC without congressional approval.
The right to self-custody
Trump has also pledged to enshrine self-custody rights for crypto users into federal law, reinforcing the principle that “not your keys, not your coins” should be protected by the U.S. government.
Self-custody allows crypto holders to manage their private keys independently, ensuring they fully control their digital assets without relying on third parties like exchanges.
This promise aligns with recent legislative efforts by Republican Senator Ted Budd, who introduced the Keep Your Coins Act in 2023. The bill aims to safeguard Americans’ ability to transact with self-hosted crypto wallets, making it harder for regulators to impose restrictions on self-custody.
However, the proposal has sparked debate. Critics argue that self-custody could enable bad actors to evade anti-money laundering regulations, a concern highlighted by Senator Elizabeth Warren’ 2022 Digital Asset Anti-Money Laundering Act, which advocates for tighter controls.
While the crypto community largely views self-custody as an essential right, questions remain about how such laws might affect the balance between personal freedom and regulatory oversight.
A crypto-friendly advisory council
One of Trump’ more structural promises is to establish a dedicated “crypto advisory council” to guide his administration’s approach to crypto policy.
The goal of this council would be to create clear, industry-friendly regulations that support crypto growth rather than stifle it.
As Trump puts it, he wants “the rules to be written by people who love your industry, not hate it,” ensuring that crypto policies reflect a deep understanding of the industry’s needs and challenges.
Many industry insiders have voiced concerns that current regulations lack clarity, making it difficult for companies to operate within legal boundaries.
However, setting up such a council presents its own challenges, such as ensuring a diversity of perspectives and maintaining unbiased oversight.
Commuting Ross Ulbricht’s sentence
In a more controversial promise, Trump has vowed to commute the sentence of Ross Ulbricht, founder of the Silk Road marketplace.
Ulbricht, a first-time nonviolent offender, received a double life sentence plus 40 years without parole—a punishment many view as excessively harsh. Silk Road, the darknet marketplace he created, facilitated the trade of illegal goods, from drugs to weapons, with Bitcoin as the primary currency.
Ulbricht’ case has become a rallying point within the crypto and libertarian communities, where advocates argue that his sentence was disproportionate to the nature of his crime.
Critics, however, contend that his involvement in Silk Road fueled illegal activities and harmed individuals, making any consideration of leniency a sensitive issue.
What to expect from Trump’s crypto term
Recent tweets from crypto analysts reflect a mood of optimism as Trump’ presidency begins.
Michaël van de Poppe, a prominent crypto analyst, describes the current state of crypto as the end of the “longest and heaviest Altcoin bear market.”
He suggests we’re on the brink of a new “Dot.com bubble in Crypto,” hinting that this cycle could “go way higher than we all expect.”
If this outlook proves accurate, Trump’ pro-crypto stance could pave the way for a strong market rebound, benefiting from a more supportive regulatory environment.
Meanwhile, technical analyst Gert van Lagen forecasts that Bitcoin is on its “final ascent,” with a target of $250,000 by February next year.
#Bitcoin – The Final Ascent
The Bull awakens, strong and clear,
Two-fifty K expected this year!
From shadows past, it’s set to soar,
With fortune close, and fate in store.In August the 10-2Y yield spread’s turned its tide,
A warning sign we can’t abide.
For history… pic.twitter.com/4UGeBEl7rE— Gert van Lagen (@GertvanLagen) November 6, 2024
He points to the recent reversal of the 10-2 yield curve — a classic precursor to recessions — as a sign that economic conditions could fuel a BTC rally.
For now, the industry watches to see if Trump’s bold promises can translate into action. If he delivers, the U.S. could emerge as a leader in crypto adoption, creating jobs and establishing financial alternatives that could leave a lasting mark on the entire crypto space.
Source link

Jason "Spaceboi" Lowery's Bitcoin "Thesis" Is Incoherent Gibberish

Bankrupt Crypto Exchange FTX Set To Begin Paying Creditors and Customers in Early 2025, Says CEO

Top crypto traders’ picks for explosive growth by 2025

3 Tokens Ready to 100x After XRP ETF Gets Approval

Gary Gensler’s Departure Is No Triumph For Bitcoin

Magic Eden Token Airdrop Date Set as Pre-Market Value Hits $562 Million

Blockchain Association urges Trump to prioritize crypto during first 100 days

Pi Network Coin Price Surges As Key Deadline Nears

How Viable Are BitVM Based Pegs?

UK Government to Draft a Regulatory Framework for Crypto, Stablecoins, Staking in Early 2025

Bitcoin Cash eyes 18% rally

Rare Shiba Inu Price Patterns Hint SHIB Could Double Soon

The Bitcoin Pi Cycle Top Indicator: How to Accurately Time Market Cycle Peaks
Bitcoin Breakout At $93,257 Barrier Fuels Bullish Optimism

Bitcoin Approaches $100K; Retail Investors Stay Steady
182267361726451435

Top Crypto News Headlines of The Week

Why Did Trump Change His Mind on Bitcoin?

New U.S. president must bring clarity to crypto regulation, analyst says

Ethereum, Solana touch key levels as Bitcoin spikes

Bitcoin Open-Source Development Takes The Stage In Nashville

Will XRP Price Defend $0.5 Support If SEC Decides to Appeal?

Bitcoin 20% Surge In 3 Weeks Teases Record-Breaking Potential

Ethereum Crash A Buying Opportunity? This Whale Thinks So

Shiba Inu Price Slips 4% as 3500% Burn Rate Surge Fails to Halt Correction

‘Hamster Kombat’ Airdrop Delayed as Pre-Market Trading for Telegram Game Expands

Washington financial watchdog warns of scam involving fake crypto ‘professors’

Citigroup Executive Steps Down To Explore Crypto
Mostbet Güvenilir Mi – Casino Bonus 2024

Bitcoin flashes indicator that often precedes higher prices: CryptoQuant
Trending

 2 months ago
182267361726451435

 24/7 Cryptocurrency News3 months ago
Top Crypto News Headlines of The Week

 Donald Trump4 months ago
Why Did Trump Change His Mind on Bitcoin?

 News3 months ago
New U.S. president must bring clarity to crypto regulation, analyst says

 Bitcoin4 months ago
Ethereum, Solana touch key levels as Bitcoin spikes

 Opinion4 months ago
Bitcoin Open-Source Development Takes The Stage In Nashville

 Price analysis3 months ago
Will XRP Price Defend $0.5 Support If SEC Decides to Appeal?

 Bitcoin4 months ago
Bitcoin 20% Surge In 3 Weeks Teases Record-Breaking Potential


