Markets
Bitcoin Price Tops $80,000 for First Time as Trump Win Boosts Crypto Market
Published
2 weeks agoon
By
admin

Bitcoin all-time high? It keeps happening, over and over again the last few days.
But this one’s an especially notable one, as Bitcoin rose above $80,000 early Sunday for the first time ever. Coinbase data shows that the leading cryptocurrency touched a high mark of $80,137.
Even by the past week’s standards, Bitcoin really saw a jump overnight, rising from a level just above $77,000 to breach the $80K mark. Bitcoin had been holding onto an all-time high price mark of $73,737 from March, going into Election Day, but rose above that mark Tuesday evening as Donald Trump’s election win took shape.
The U.S. president-elect made cryptocurrency a key part of his campaign this year, promising to protect and boost the industry in America and end the Securities and Exchange Commission’s crypto crackdown.
Bitcoin is now up nearly 17% on the week at a current price of $79,875, down slightly from the peak from earlier this morning.
Other major cryptocurrencies have marked even larger gains over the past week, however, with Cardano up a whopping 86%, Dogecoin popping 66%, and even Ethereum—which is notably lagged Bitcoin’s gains in recent months—jumping 31% over renewed decentralized finance (DeFi) optimism.
Daily Debrief Newsletter
Start every day with the top news stories right now, plus original features, a podcast, videos and more.
Source link
You may like


Rare Shiba Inu Price Patterns Hint SHIB Could Double Soon

The Bitcoin Pi Cycle Top Indicator: How to Accurately Time Market Cycle Peaks


Bitcoin Approaches $100K; Retail Investors Stay Steady


Solana Hits New ATH On Huge Whale Accumulation, More Gains Ahead?


Microsoft Should Buy $78 Billion Worth of Bitcoin


Ethereum Believers May Be Staring Down Opportunity As ETH Reaches Another Low Against Bitcoin: CryptoQuant CEO
Bitcoin Magazine Pro
The Bitcoin Pi Cycle Top Indicator: How to Accurately Time Market Cycle Peaks
Published
2 hours agoon
November 22, 2024By
admin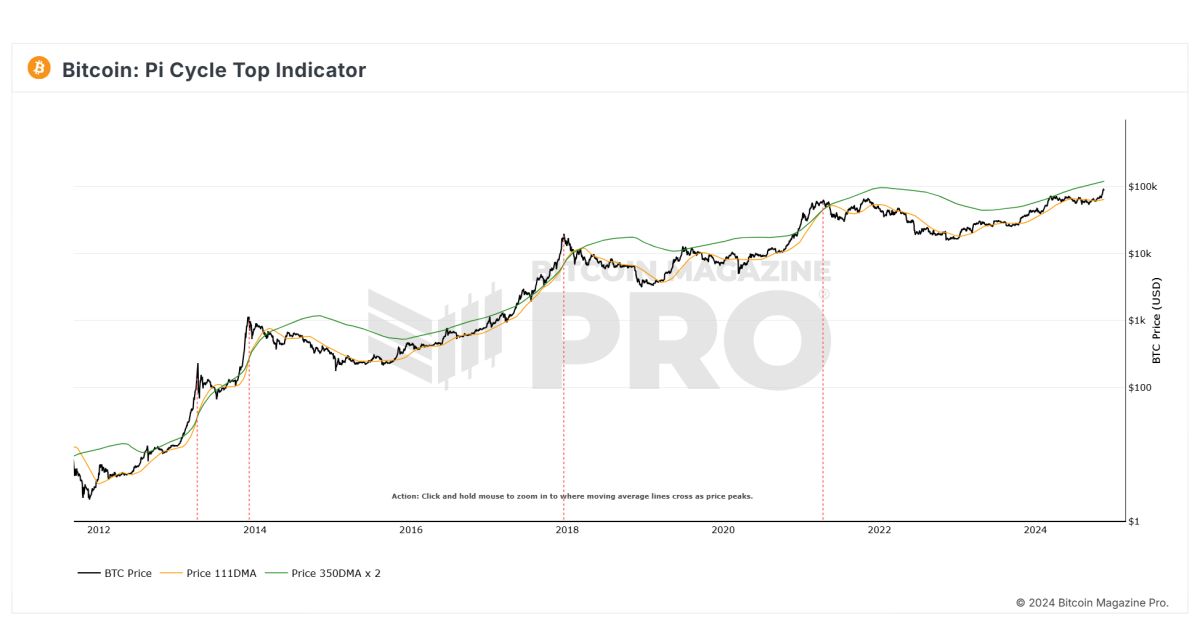
The Bitcoin Pi Cycle Top Indicator has gained legendary status in the Bitcoin community for its uncanny accuracy in identifying market cycle peaks. Historically, it has timed every single Bitcoin cycle high with remarkable precision—often within just three days. Could it work its magic again this cycle? Let’s dive deeper into how it works and its significance in navigating Bitcoin’s market cycles.
What is the Pi Cycle Top Indicator?
The Pi Cycle Top Indicator is a tool designed to identify Bitcoin’s market cycle tops. Created by Philip Swift, Managing Director of Bitcoin Magazine Pro in April 2019, this indicator uses a combination of two moving averages to forecast cycle highs:
- 111-Day Moving Average (111DMA): Represents the shorter-term price trend.
- 350-Day Moving Average x 2 (350DMA x 2): A multiple of the 350DMA, which captures longer-term trends.
When the 111DMA rises sharply and crosses above the 350DMA x 2, it historically coincides with Bitcoin’s market cycle peak.
The Mathematics Behind the Name
Interestingly, the ratio of 350 to 111 equals approximately 3.153—remarkably close to Pi (3.142). This mathematical quirk gives the indicator its name and highlights the cyclical nature of Bitcoin’s price action over time.
Why Has It Been So Accurate?
The Pi Cycle Top Indicator has been effective in predicting the peaks of Bitcoin’s three most recent market cycles. Its ability to pinpoint the absolute tops reflects Bitcoin’s historically predictable cycles during its adoption growth phase. The indicator essentially captures the point where the market becomes overheated, as reflected by the steep rise of the 111DMA surpassing the 350DMA x 2.
How Can Investors Use This Indicator?
For investors, the Pi Cycle Top Indicator serves as a warning sign that the market may be approaching unsustainable levels. Historically, when the indicator flashes, it has been advantageous to sell Bitcoin near the top of the market cycle. This makes it a valuable tool for those seeking to maximize gains and minimize losses.
However, as Bitcoin matures and integrates further into the global financial system—bolstered by developments like Bitcoin ETFs and institutional adoption—the effectiveness of this indicator may diminish. It remains most relevant during Bitcoin’s early adoption phase.
A Glimpse Into the Future
The big question now is: will the Pi Cycle Top Indicator remain accurate in this cycle? With Bitcoin entering a new era of adoption and market dynamics, its cyclical patterns may evolve. Yet, this tool has proven its worth repeatedly over Bitcoin’s first 15 years, offering investors a reliable gauge of market tops.
Final Thoughts
The Pi Cycle Top Indicator is a testament to Bitcoin’s cyclical nature and the power of mathematical models in understanding its price behavior. While its past accuracy has been unparalleled, only time will tell if it can once again predict Bitcoin’s next market cycle peak. For now, it remains an indispensable tool for those navigating the thrilling highs and lows of Bitcoin.
Explore the full chart and stay informed.
Source link
$100
Bitcoin Nears $100,000 As Trump Council Expected To Implement BTC Reserve
Published
10 hours agoon
November 22, 2024By
admin

What an enormous day it has been today.
Gary Gensler officially announced that he is stepping down from his position as Chairman of the Securities and Exchange Commission (SEC), and minutes later, Reuters reported that Donald Trump’s “crypto council” is expected to “establish Trump’s promised bitcoin reserve.” A bitcoin reserve, that would see the United States purchase 200,000 bitcoin per year, for five years until it has bought 1,000,000 bitcoin.
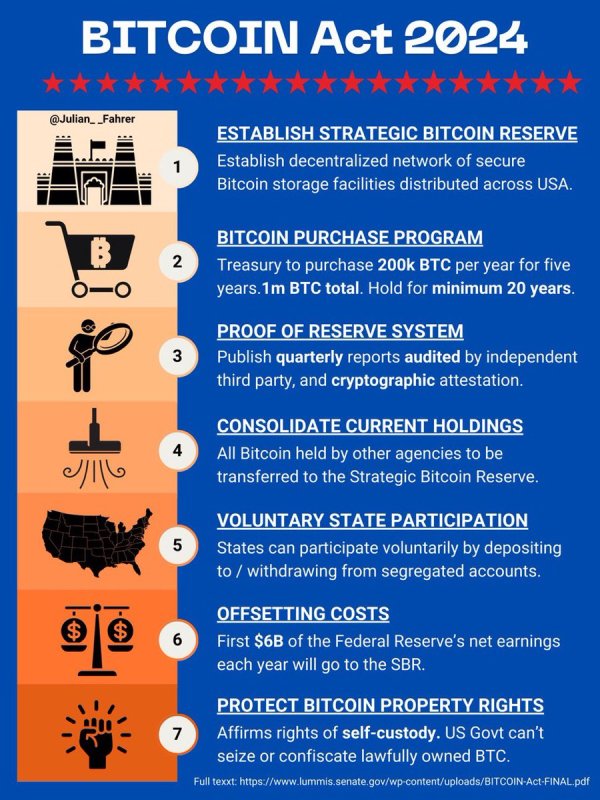
Right after both of those, Bitcoin continued its upward momentum and broke $99,000, with $100,000 feeling like it can happen at any second now.
It is hard to contain my bullishness thinking about the United States purchasing 200,000 BTC per year. They essentially have to compete with everyone else in the world who is also accumulating bitcoin and attempting to front run them. There are only 21 million bitcoin and that is a LOT of demand.
To put this into context, so far this year the US spot bitcoin ETFs have accumulated a combined total of over 1 million BTC. At the time of launch the price was ~$44,000 and now bitcoin is practically at $100,000. And that’s all ETFs combined. Imagine what will happen when just one entity wants to buy a total of 1 million coins, having to compete with everyone else accumulating large amounts as well?
I mean MicroStrategy literally just completed another $3 BILLION raise to buy more bitcoin, and will continue raising until it purchases $42 billion more in bitcoin. The United States are most likely going to be purchasing their coins (if this legislation is officially signed into law) at very high prices. The demand is insane and only rising in the foreseeable future.
With two months left to go until Trump officially takes office, it remains to be seen if this bill becomes law, but at the moment things are looking really good. As Senator Cynthia Lummis stated, “This is our Louisiana Purchase moment!” and would be an absolutely historic moment for Bitcoin, Bitcoiners, and the future financial dominance of the United States of America.
This is the solution.
This is the answer.
This is our Louisiana Purchase moment!#Bitcoin2024 pic.twitter.com/RNEiLaB16U
— Senator Cynthia Lummis (@SenLummis) July 27, 2024
This article is a Take. Opinions expressed are entirely the author’s and do not necessarily reflect those of BTC Inc or Bitcoin Magazine.
Source link
Markets
The Chart That Shows Bitcoin’s Bull Run Won’t Stop at $100,000
Published
19 hours agoon
November 21, 2024By
admin
Peak Bitcoin, hardly.

https://x.com/pete_rizzo_/
As I wrote in Forbes in 2021, the world is waking up to a new reality in regards to Bitcoin – the unlikely truth that Bitcoin’s programming has cyclical effects on its economy.
This has led to at least 4 distinct market cycles where Bitcoin has been branded a bubble, skeptics have rung their hands, and each time, Bitcoin recovers more or less 4 years later to set new all-time highs above its previously “sky-high” valuation.
I personally watched Bitcoin go from $50 to $1,300 in 2013. Then, from $1,000 to $20,000 in 2017, and I watched it go from $20,000 to $70,000 in 2021.
So, I’m just here to relate that, from my past experience, this market cycle is just heating up.
For those who have been in Bitcoin, there’s one tried-and-true and that’s Google Search. As long as I’ve been in Bitcoin, this has been the best indicator of the strength of the market.
Search is low, you’re probably in a bear market. Search heading back to all-time highs? This means new entrants are getting engaged, learning about Bitcoin, and becoming active buyers.
Remember, this is a habit change. Bitcoin HODLers are slowing shifting their assets to a wholly new economy. So, Google Trends search then, represents a snapshot of Bitcoin’s immigration. It shows how many new sovereign citizens are moving their money here.
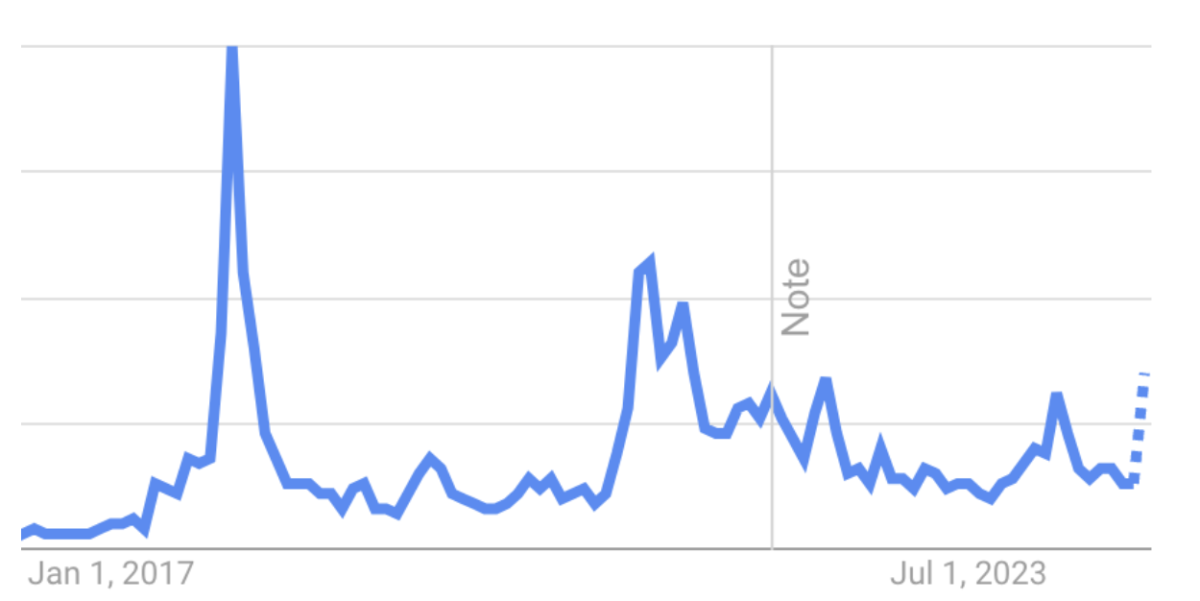
And it’s something that all who are worried about whether bitcoin’s price topping out in 2024 should pay attention to.
Last year was the Bitcoin halving, and historically, the year following previous halvings has led to price appreciation. Maybe you’re tempted to think, “this time is different” – not me. I look at search and I see a chart that continues to accelerate into price discovery. Trust me when I say no one I know is selling bitcoin.
As shown above, buyer interest is accelerating, and these new buyers have to buy that Bitcoin from somewhere. Add nation states, US states, and a coming Trump administration set to ease the burden on the industry?
Well, I think the chart above says it all really.
This article is a Take. Opinions expressed are entirely the author’s and do not necessarily reflect those of BTC Inc or Bitcoin Magazine.
Source link

Rare Shiba Inu Price Patterns Hint SHIB Could Double Soon

The Bitcoin Pi Cycle Top Indicator: How to Accurately Time Market Cycle Peaks
Bitcoin Breakout At $93,257 Barrier Fuels Bullish Optimism

Bitcoin Approaches $100K; Retail Investors Stay Steady

Solana Hits New ATH On Huge Whale Accumulation, More Gains Ahead?

Microsoft Should Buy $78 Billion Worth of Bitcoin

Ethereum Believers May Be Staring Down Opportunity As ETH Reaches Another Low Against Bitcoin: CryptoQuant CEO

UK government is ready for crypto regulations next year

“Crypto Dad” Chris Giancarlo Emerges Top For White House Crypto Czar Role

Bitcoin Nears $100,000 As Trump Council Expected To Implement BTC Reserve

Know Your Missiles: Russia’s Experimental Hypersonic Missile Is A New Kind of Killing Machine

Polkadot investor predicts a 30,000% rally for this $0.04 token by 2025

Donald Trump Proposed Crypto Advisory Council To Set Up Strategic Bitcoin Reserve

Want Greater Bitcoin Adoption? Engage With Your Government.

Why the Media Loves the Worst of Crypto
182267361726451435

Top Crypto News Headlines of The Week

Why Did Trump Change His Mind on Bitcoin?

New U.S. president must bring clarity to crypto regulation, analyst says

Ethereum, Solana touch key levels as Bitcoin spikes

Bitcoin Open-Source Development Takes The Stage In Nashville

Will XRP Price Defend $0.5 Support If SEC Decides to Appeal?

Bitcoin 20% Surge In 3 Weeks Teases Record-Breaking Potential

Ethereum Crash A Buying Opportunity? This Whale Thinks So

Shiba Inu Price Slips 4% as 3500% Burn Rate Surge Fails to Halt Correction

‘Hamster Kombat’ Airdrop Delayed as Pre-Market Trading for Telegram Game Expands

Washington financial watchdog warns of scam involving fake crypto ‘professors’

Citigroup Executive Steps Down To Explore Crypto
Mostbet Güvenilir Mi – Casino Bonus 2024

Bitcoin flashes indicator that often precedes higher prices: CryptoQuant
Trending

 2 months ago
182267361726451435

 24/7 Cryptocurrency News3 months ago
Top Crypto News Headlines of The Week

 Donald Trump4 months ago
Why Did Trump Change His Mind on Bitcoin?

 News3 months ago
New U.S. president must bring clarity to crypto regulation, analyst says

 Bitcoin4 months ago
Ethereum, Solana touch key levels as Bitcoin spikes

 Opinion4 months ago
Bitcoin Open-Source Development Takes The Stage In Nashville

 Price analysis3 months ago
Will XRP Price Defend $0.5 Support If SEC Decides to Appeal?

 Bitcoin4 months ago
Bitcoin 20% Surge In 3 Weeks Teases Record-Breaking Potential


