Price analysis
Analyst’s Solana Price Forecast Hints $4,000 Target
Published
4 months agoon
By
admin
Solana price, a Layer 1 blockchain, has showcased exceptional growth, becoming a standout performer in the cryptocurrency market. Since early November, SOL has gained significant momentum, breaking key resistance levels amid a wider crypto rally. Over the past year, its value has surged by 218%, reflecting strong investor confidence. Despite minor dips, analysts suggest Solana’s price could climb higher, with some projecting an ambitious target of $4,000.
Can Solana Price Hit $400 According to Analyst
A prominent crypto analyst has tweeted a bold price prediction for Solana, citing a “cup and handle” chart pattern. According to the analysis, Solana could potentially reach $4,000 in the near future if the bullish structure materializes.
The analyst shared a monthly chart showcasing the formation of a classic “cup and handle” pattern. The chart suggests that Solana has been consolidating within a critical resistance zone around $260. A breakout from this range could validate the bullish thesis.
The prediction assumes Solana will break through its current resistance and rally toward higher Fibonacci extension levels. Notably, the 1.618 and 1.786 extensions, often used in technical analysis, indicate potential targets of $2,236 and $4,013, respectively. The ultimate price goal of $4,000 represents a staggering 1,861% increase from current levels.


The Solana price could skyrocket, driven by growing interest in Solana meme coins like WIF and a potential ETF approval. Grayscale’s recent Solana ETF filing with the SEC has boosted investor enthusiasm, aligning with rising demand across altcoin markets.
Bitcoin’s strong resistance above key levels and a resurgent crypto market fuel optimism for SOL. The upcoming U.S. presidential inauguration in January could create additional market momentum. Speculation surrounding an altcoin season, alongside increased investor activity, positions Solana as a standout performer. These factors could push SOL closer to its ambitious $4,000 target.
Solana Price Eyes More Bullish Ahead
Over the past month, the Solana price has seen a slight surge in its value. At the time of writing, the SOL price is hovering at $223.49, marking a 2.78% gain over the past 24 hours. This recent performance showcases a gradual upward trend amid fluctuating market conditions.
Despite the signs of recovery, the Solana price prediction faces challenges in overcoming the critical $262 resistance level. A breakout above this zone could pave the way for further gains, while failure to breach it might lead to a retest of the $200 support zone.
The Chaikin Money Flow (CMF) indicator has risen to 0.05, suggesting increasing buying pressure and capital inflow into the asset. The Moving Average Convergence Divergence (MACD) presents a bullish crossover, with the MACD line climbing above the signal line.


Solana’s bullish momentum and strong investor interest signal potential for further growth. However, breaking critical resistance levels is crucial to achieving ambitious targets like $4,000 in the near future.
Frequently Asked Questions (FAQs)
It is based on the “cup and handle” chart pattern analysis.
Strong investor interest, ETF hype, and altcoin market demand.
Bitcoin’s strong performance boosts optimism for Solana and altcoins.
Coingape Staff
CoinGape comprises an experienced team of native content writers and editors working round the clock to cover news globally and present news as a fact rather than an opinion. CoinGape writers and reporters contributed to this article.
Disclaimer: The presented content may include the personal opinion of the author and is subject to market condition. Do your market research before investing in cryptocurrencies. The author or the publication does not hold any responsibility for your personal financial loss.
Source link
You may like


Trader Says Ethereum-Based Altcoin Primed for 240%+ Rally if Major Resistance Level Breaks, Updates XRP Outlook


Congressman Ro Khanna Says Democrats Are Changing Their Tune On Bitcoin


France’s Public Investment Bank Bpifrance to Invest $27 Million in Crypto


Hong Kong SFC approves tokenized money market ETFs by HashKey, Bosera


CoreWeave Goes Public at $40 Per Share, Raises $1.5 Billion


Why is Bitcoin, Ethereum, XRP, and Dogecoin Price Dropping Today?
Bitcoin price
Why is Bitcoin, Ethereum, XRP, and Dogecoin Price Dropping Today?
Published
5 hours agoon
March 28, 2025By
admin
The crypto market has dropped today, March 28, with Bitcoin price dropping below $86,000. This decline in BTC price has also affected Ethereum, XRP, and Dogecoin. This widespread market crash has been caused by a massive sell-off in the spot market as depicted by data from Bitfinex. Macroeconomic concerns such as Trump’s fresh tariffs and the PCE inflation data are also causing market anxiety.
Why is BTC, ETH, XRP, and DOGE Dropping Today?
Bitcoin price struggles to defend the support level at $86,000 following a 1.6% dip in 24 hours. At the same time, Ethereum and XRP have fallen by 5% and 4%, respectively. Dogecoin price has experienced the biggest single-day loss of 7% despite analysts sharing a positive DOGE outlook.
One of the reasons why the Bitcoin price is dropping today is an influx of selling activity on the Bitfinex exchange. This selling activity is shown by the spot CVD indicator that points out a large number of sell orders on Bitcoin while buying pressure weakens. The spot CVD has been on a downtrend since early this week, a sign that traders are capitulating.


Ethereum price is also dropping today because of low demand from buyers. One analyst on X noted that selling pressure has been weighing on ETH since December last year. If this continues, Ethereum will continue to drop further and possibly fall below $2,000.
Additionally, the BTC Deribit Skew shows that the market sentiment towards Bitcoin is now bearish. Analyst Nazro has observed an increase in the number of traders that are purchasing put options in the $80,000 to $85,000 price range. When many traders are buying put options instead of call options, it shows that they anticipate the Bitcoin price to continue dropping.


This negative market sentiment adds to the factors that are making the crypto market to drop today.
muthoni
Muthoni Mary is a seasoned crypto market analyst and writer with over three years of experience dissecting blockchain trends, price movements, and market dynamics. With a sharp eye for technical analysis and an in-depth understanding of on-chain metrics, she delivers insightful, data-driven content that helps investors navigate the fast-paced world of digital assets.
Disclaimer: The presented content may include the personal opinion of the author and is subject to market condition. Do your market research before investing in cryptocurrencies. The author or the publication does not hold any responsibility for your personal financial loss.
Source link
Doge price
‘Trust the Cycle’ – Pro Says Dogecoin Price Could Suddenly Hit $1
Published
21 hours agoon
March 27, 2025By
admin
Dogecoin price has tanked this year, coinciding with the recent crypto sell-off. This crash has erased billions of dollars in value. Still, one crypto analyst believes that it is just a matter of time until the DOGE price recovers, and potentially hits the psychological point at $1.
Crypto Pro Predicts Dogecoin Price Will Hit $1
A popular crypto expert has come out with a bullish DOGE price prediction even as it deviates further from its 2024 highs. The analyst used a weekly chart to identify chart patterns he believes will drive the upcoming bull run.
As shown below, he noted that the Dogecoin price has been forming a falling wedge pattern on the weekly chart. The upper side of this wedge links the highest swings since December, while its lower side connects the lower lows since Dec. 19. This pattern often leads to a strong bullish breakout when the two lines are nearing their confluence level.
The analyst also pointed out that DOGE formed a similar pattern between March and November last year, culminating in a strong bull run to a high of $0.45.


In this case, Dogecoin has formed a falling wedge and retested the important support at $0.2280, the highest swing in March last year. A break and retest pattern signals a potential continuation.
The pro now expects that the coin will initially jump to $0.50. After that, he expects it to surge to $1. Such a move would be a 400% surge from the current level. It would also push its market cap to $140 billion.
A 400% surge is possible in the crypto market. For example, Dogecoin jumped by 720% from its 2023 lows to the highest swing in 2024. It can also jump by 285% to get to its all-time high of $0.7370. After that, it will need to soar by just 0.35% to hit $1.
The bullish DOGE outlook will be canceled if the coin crashes below the ascending trendline that links the lowest levels since June 2023.


Potential Catalysts to Push DOGE Price to $1
Dogecoin price has numerous catalysts that may push it to $1. First, the upcoming reciprocal tariffs may sink the US into a recession, leading to Fed interventions like rate cuts and quantitative easing. These actions may lead to a new crypto bull run.
Second, Polymarket users believe that the SEC will approve a DOGE ETF. That’s because Dogecoin is similar to Bitcoin in that it is a proof-of-work coin that the SEC does not consider a security. Such an ETF will lead to more demand from Wall Street investors.
Further, Dogecoin may benefit from the creation of crypto reserves since it is a candidate for inclusion. Finally, DOGE is one of the top blue-chip meme coins, meaning that it may see traction as investors rotate from risky Solana meme coins.
Frequently Asked Questions (FAQs)
Technicals suggest that the DOGE price is bullish and that it may surge to $1 in the coming months.
The most bullish view is that it has formed a falling wedge pattern on the weekly chart.
The bullish outlook to $1 may take time since it is based on the weekly chart, which is a lagging one. As such, it may take months or years.
crispus
Crispus is a seasoned Financial Analyst at CoinGape with over 12 years of experience. He focuses on Bitcoin and other altcoins, covering the intersection of news and analysis. His insights have been featured on renowned platforms such as BanklessTimes, CoinJournal, HypeIndex, SeekingAlpha, Forbes, InvestingCube, Investing.com, and MoneyTransfers.com.
Disclaimer: The presented content may include the personal opinion of the author and is subject to market condition. Do your market research before investing in cryptocurrencies. The author or the publication does not hold any responsibility for your personal financial loss.
Source link
Cardano
Cardano price could surge to $2 as whale purchases rise
Published
3 days agoon
March 25, 2025By
admin
Cardano price has remained in a tight range over the past few weeks as market participants await the next catalyst.
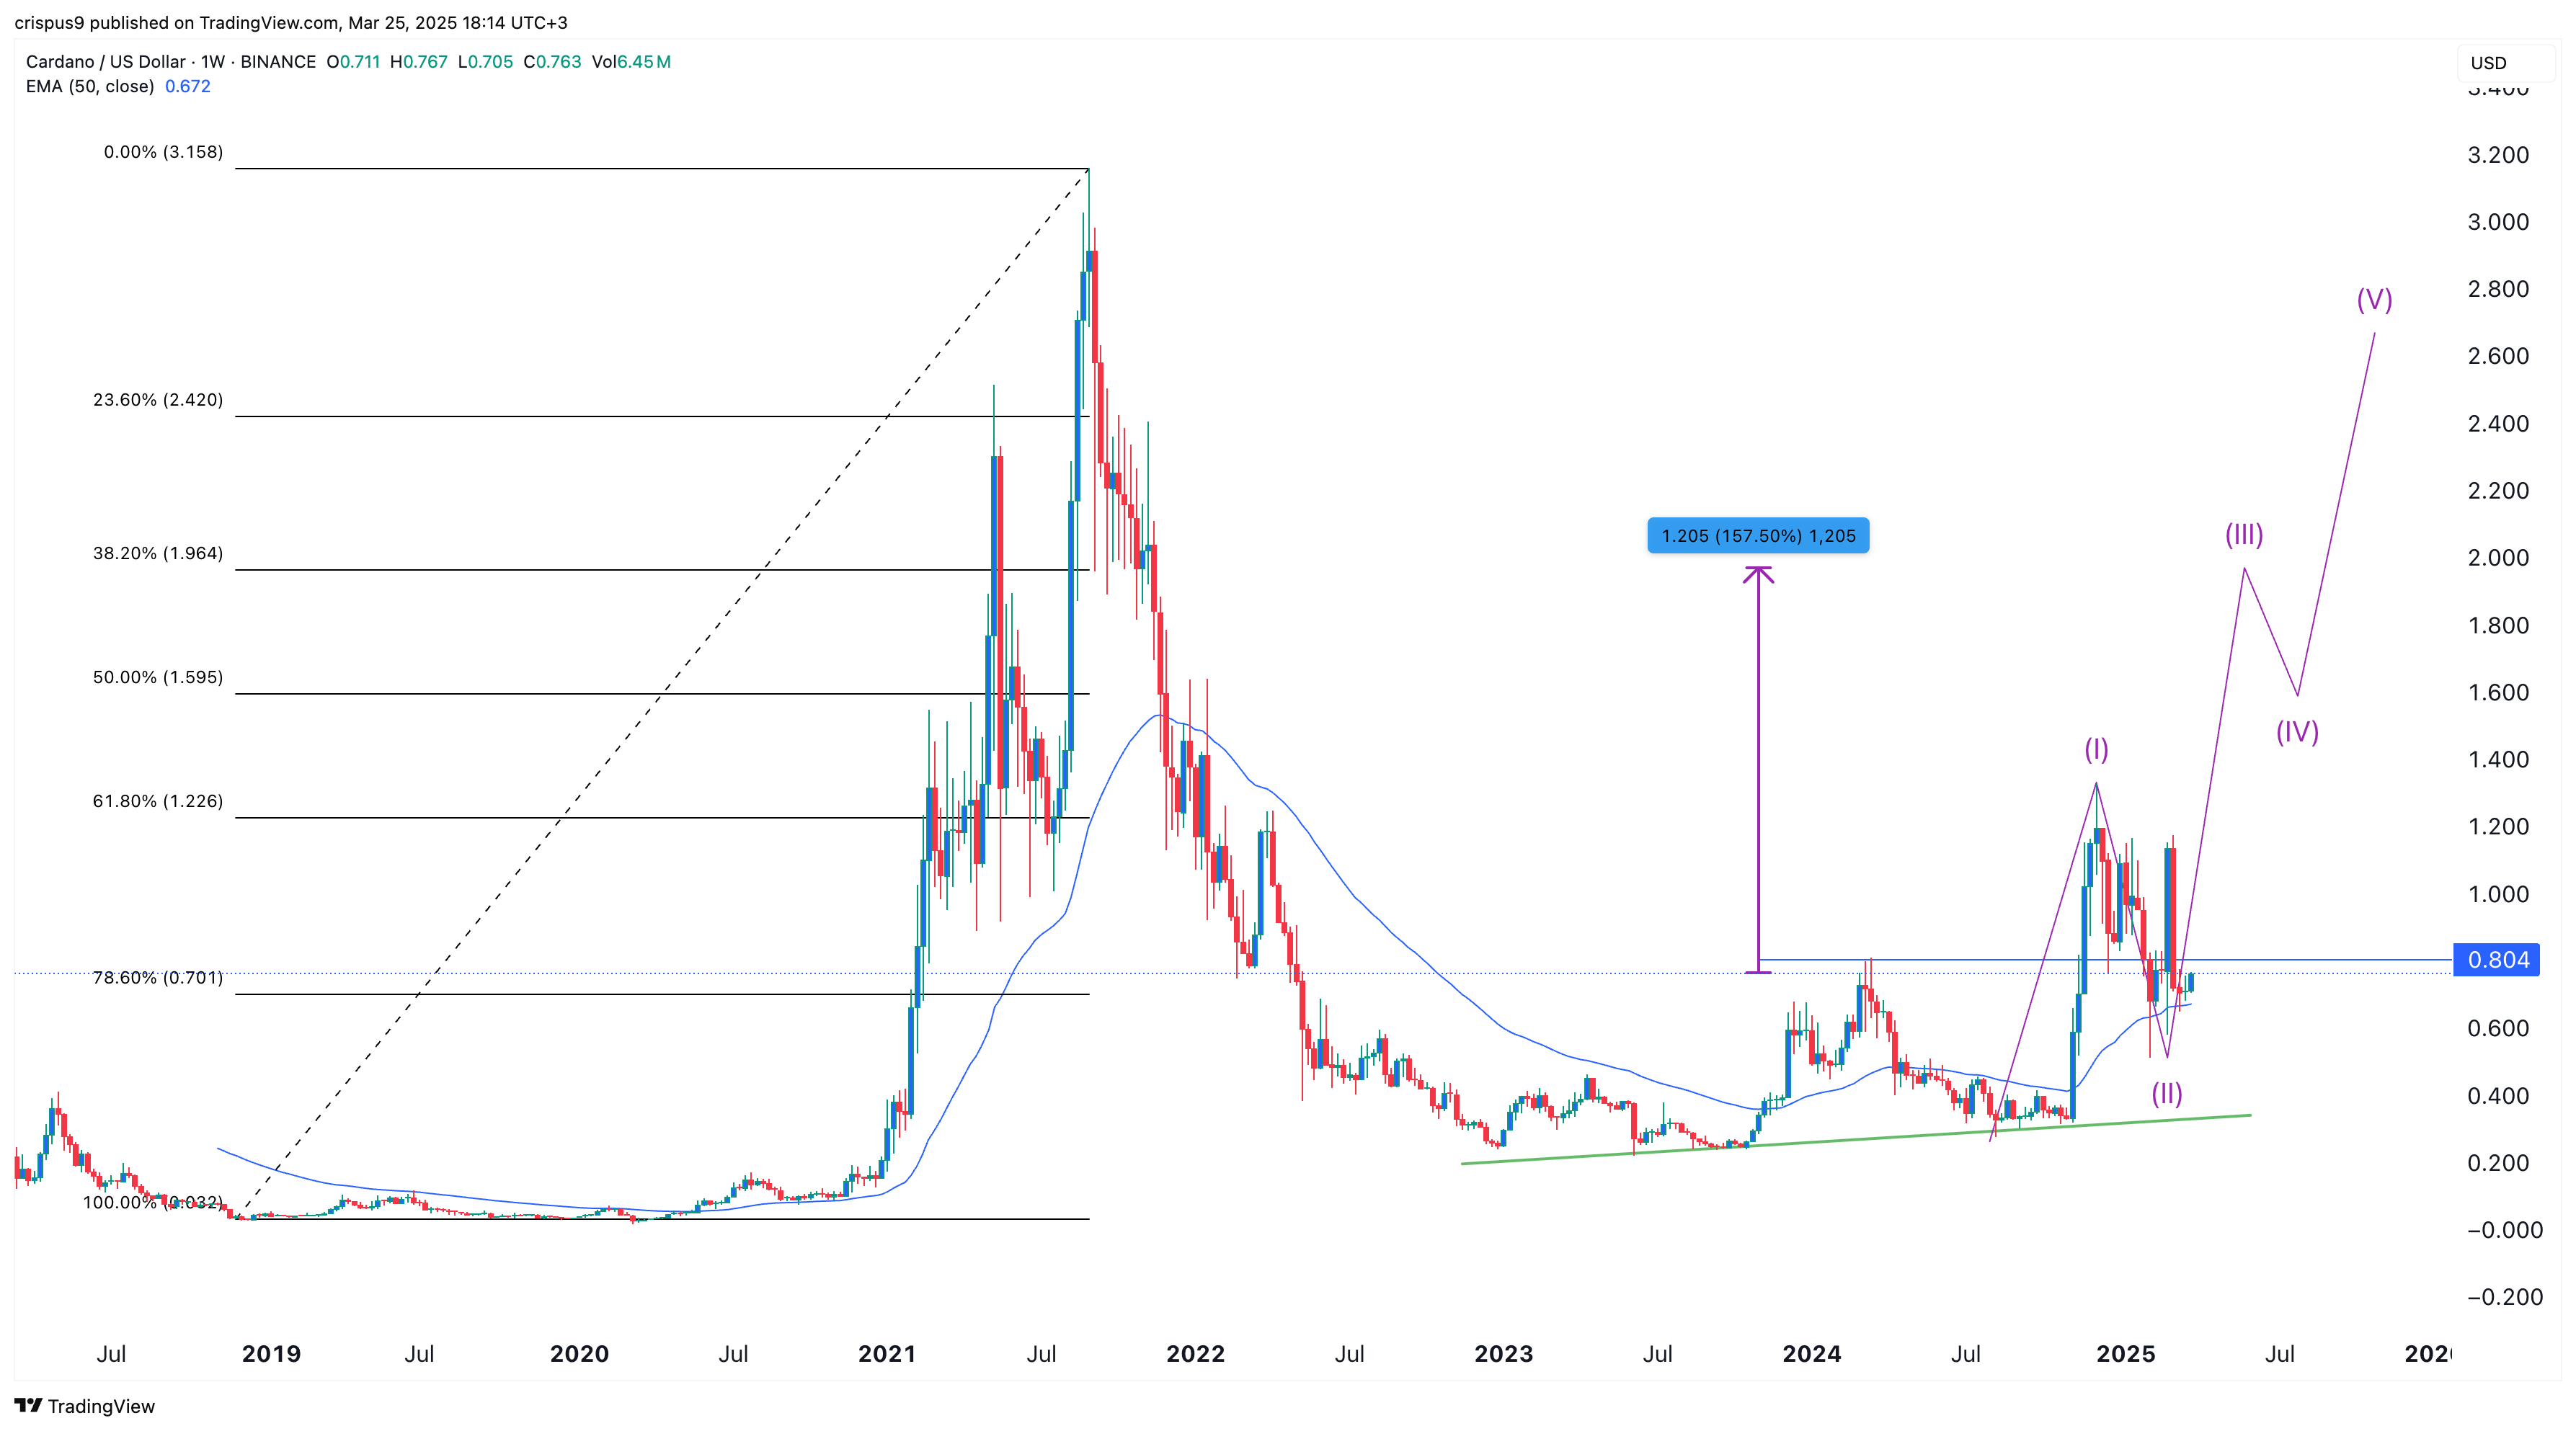
Cardano (ADA) was trading at $0.760, down by 43% from its highest level in December last year. It has underperformed other popular coins like Mantra (OM) and Cronos (CRO) this month.
Cardano has three main catalysts that could propel it to $2 in the coming months. First, there are signs that whales are accumulating the coin in anticipation of more gains ahead. Data shows that whales have acquired over 240 million ADA coins in the past week, valued at over $182 million. The whale purchasing trend appears to be gaining momentum.
Second, Cardano could benefit from the likely approval of a spot ADA exchange-traded fund by the Securities and Exchange Commission. Grayscale Tuttle Capital Management have already submitted applications.
An ADA fund would be a positive development for the coin, as it could lead to more inflows from institutional investors.
Third, data shows that more investors are staking their Cardano coins, signaling that they intend to hold them long-term. The staking market cap has jumped by 8.1% to $16.1 billion, while the yield stands at 2.60%.
Cardano price technical analysis

The other catalyst for ADA price is that it is in the second phase of the Elliott Wave pattern. This phase is characterized by a brief pullback, followed by the third bullish wave — typically the longest.
Cardano has likely completed the second phase and is poised to enter the third wave, which could push it to the psychological level of $2. This target aligns with the 38.2% retracement level and represents a 160% increase from the current price.
Cardano remains above the 50-week Exponential Moving Average and is forming a bullish flag pattern, a bullish continuation signal comprising a vertical line and a flag-like consolidation.
However, this prediction is based on the weekly chart, meaning the pattern could take time to fully develop. The flag section of the bullish flag has already taken more than three months to form.
Source link

Trader Says Ethereum-Based Altcoin Primed for 240%+ Rally if Major Resistance Level Breaks, Updates XRP Outlook

Congressman Ro Khanna Says Democrats Are Changing Their Tune On Bitcoin

France’s Public Investment Bank Bpifrance to Invest $27 Million in Crypto

Hong Kong SFC approves tokenized money market ETFs by HashKey, Bosera

CoreWeave Goes Public at $40 Per Share, Raises $1.5 Billion

Why is Bitcoin, Ethereum, XRP, and Dogecoin Price Dropping Today?

XRP Price Slides Slowly—Is a Bigger Drop Coming?

Darkweb actors claim to have over 100K of Gemini, Binance user info

Whale Who Netted $108,000,000 Profit on TRUMP Books Loss on the Memecoin After President’s Truth Social Post

Hardware Wallets: Bitcoin’s Biggest Adoption Barrier

SEC Officially Drops Cases Against Kraken, ConsenSys, and Cumberland DRW

Dogecoin could rally in double digits on three conditions

Sei Foundation Explores Buying 23andMe to Put Genetic Data on Blockchain

Coinbase CLO Applauds US SEC Chair Nominee Paul Atkins Ahead of Senate Confirmation

Crypto Pundit Makes Case For Bitcoin Price At $260,000, But This Invalidation Level Threatens The Rally

Arthur Hayes, Murad’s Prediction For Meme Coins, AI & DeFi Coins For 2025

Expert Sees Bitcoin Dipping To $50K While Bullish Signs Persist

Aptos Leverages Chainlink To Enhance Scalability and Data Access

Bitcoin Could Rally to $80,000 on the Eve of US Elections

Sonic Now ‘Golden Standard’ of Layer-2s After Scaling Transactions to 16,000+ per Second, Says Andre Cronje

Institutional Investors Go All In on Crypto as 57% Plan to Boost Allocations as Bull Run Heats Up, Sygnum Survey Reveals

Crypto’s Big Trump Gamble Is Risky

Ripple-SEC Case Ends, But These 3 Rivals Could Jump 500x

Has The Bitcoin Price Already Peaked?

A16z-backed Espresso announces mainnet launch of core product

Xmas Altcoin Rally Insights by BNM Agent I

Blockchain groups challenge new broker reporting rule

Trump’s Coin Is About As Revolutionary As OneCoin

The Future of Bitcoin: Scaling, Institutional Adoption, and Strategic Reserves with Rich Rines

Is $200,000 a Realistic Bitcoin Price Target for This Cycle?
Trending

 24/7 Cryptocurrency News5 months ago
Arthur Hayes, Murad’s Prediction For Meme Coins, AI & DeFi Coins For 2025

 Bitcoin2 months ago
Expert Sees Bitcoin Dipping To $50K While Bullish Signs Persist

 24/7 Cryptocurrency News3 months ago
Aptos Leverages Chainlink To Enhance Scalability and Data Access

 Bitcoin5 months ago
Bitcoin Could Rally to $80,000 on the Eve of US Elections

 Altcoins2 months ago
Sonic Now ‘Golden Standard’ of Layer-2s After Scaling Transactions to 16,000+ per Second, Says Andre Cronje

 Bitcoin4 months ago
Institutional Investors Go All In on Crypto as 57% Plan to Boost Allocations as Bull Run Heats Up, Sygnum Survey Reveals

 Opinion5 months ago
Crypto’s Big Trump Gamble Is Risky

 Price analysis5 months ago
Ripple-SEC Case Ends, But These 3 Rivals Could Jump 500x


✓ Share: