
Altcoin
Dogecoin could rally in double digits on three conditions

Dogecoin rallied nearly 10% this week, resilient in the face of the U.S. President Donald Trump’s tariff war and macroeconomic developments. Most altcoins have suffered the negative impact of Trump’s announcements, DOGE continues to gain, back above $0.2058 for the first time in nearly two weeks.
Dogecoin rallies in double-digits, what to expect from DOGE price?
Dogecoin (DOGE) hit a near two-week peak at $0.20585 on Wednesday, March 26. In the past seven days, DOGE rallied nearly 10%, even as altcoins struggled with recovery in the ongoing macroeconomic developments in the U.S.
The largest meme coin in the crypto market could continue its climb, extending gains by nearly 11%, and testing resistance at the lower boundary of the imbalance zone between $0.24040 and $0.21465.
The upper boundary of the zone at $0.24040 is the next key resistance for DOGE, nearly 24% above the current price.
Two key momentum indicators, the RSI and MACD support a bullish thesis for Dogecoin. RSI is 52, above the neutral level. MACD flashes green histogram bars above the neutral line, meaning there is an underlying positive momentum in Dogecoin price trend.

Dogecoin on-chain analysis
On-chain analysis of the largest meme coin shows that the number of holders of DOGE is on the rise. If Dogecoin’s number of holders keep climbing or steady in the coming week, the meme coin could remain relevant among traders.
The network realized profit/loss metric shows that DOGE holders have realized profits on a small scale. Typically, large scale profit-taking increases selling pressure on the meme coin and could negatively impact price.
The metric supports a bullish thesis for DOGE in the coming week. Dogecoin’s active address count has been steady since mid-March, another sign of the meme coin’s resilience.

DOGE derivatives analysis and price forecast
The analysis of Dogecoin derivatives positions across exchanges shows that open interest is recovering from its March 12 low. Open Interest is $1.98 billion, as Dogecoin trades at $0.19. Coinglass data shows a steady climb in OI in the chart below.

The total liquidations data shows $4.29 million in long positions were liquidated on March 27. Sidelined buyers need to watch liquidations data and prices closely before adding to their derivatives position.
The long/short ratio on top exchanges, Binance and OKX exceeds 1, meaning derivatives traders are betting on an increase in DOGE price.

When technical analysis and derivatives data is combined, it is likely Dogecoin price could test resistance at $0.21465 next week, if spot prices follow the cue of derivatives traders.
What to expect from DOGE
Dogecoin wallets holding between 1 million and 10 million DOGE tokens added to their portfolio consistently between March 10 and 27, while the other two categories, holding between 10 million and 100 million DOGE and 100 million and 1 billion DOGE tokens held nearly steady in the same timeframe.
The data from Santiment shows that DOGE’s traders holding between 1 million and 10 million tokens are rapidly accumulating, even as the token’s price rises. This supports demand for DOGE and a bullish thesis for the meme coin.

Dogecoin ETF and DOGE catalysts
DOGE holders are closely watching developments in Bitwise’s Dogecoin ETF filing with the SEC. The ETF filing is an effort to legitimize the meme coin as an investment category for institutional investors, as DOGE price holds steady among altcoins rapidly eroding in value.
Bitcoin flashcrashes dragged Dogecoin down with it, to a small extent, however the meme token recovered each time and consistent gains could signal an end to DOGE’s multi-month downward trend.
Other key catalysts for Dogecoin are positive updates in crypto regulation, passage of the stablecoin bill in the Congress, and demand for DOGE among whales and large wallet investors.
Disclosure: This article does not represent investment advice. The content and materials featured on this page are for educational purposes only.
Source link


Reason to trust
![]()
Strict editorial policy that focuses on accuracy, relevance, and impartiality
Created by industry experts and meticulously reviewed
The highest standards in reporting and publishing
Strict editorial policy that focuses on accuracy, relevance, and impartiality
Morbi pretium leo et nisl aliquam mollis. Quisque arcu lorem, ultricies quis pellentesque nec, ullamcorper eu odio.
Technical expert Tony Severino has warned that the Bitcoin and altcoins Fischer Transform indicator has flipped bearish for the first time since 2021. The analyst also revealed the implications of this development and how exactly it could impact these crypto assets.
Bitcoin And Altcoins Fischer Transform Indicator Turns Bearish
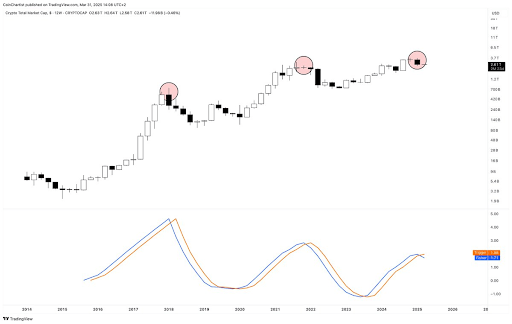
In an X post, Severino revealed that the total crypto market cap 12-week Fisher Transform has flipped bearish for the first time since December 2021. Before then, the indicator had flipped bearish in January 2018. In 2021 and 2018, the total crypto market cap dropped 66% and 82%, respectively. This provides a bearish outlook for Bitcoin and altcoins, suggesting they could suffer a massive crash soon enough.
Related Reading
In another X post, the technical expert revealed that Bitcoin’s 12-week Fischer Transform has also flipped bearish. Severino noted that this indicator converts prices into a Gaussian normal distribution to smooth out price data and filter out noise. In the process, it helps generate clear signals that help pinpoint major market turning points.
Severino asserted that this indicator on the 12-week timeframe has never missed a top or bottom call, indicating that Bitcoin and altcoins may have indeed topped out. The expert has been warning for a while now that the Bitcoin top might be in and that a massive crash could be on the horizon for the flagship crypto.
He recently alluded to the Elliott Wave Theory and market cycles to explain why he is no longer bullish on Bitcoin and altcoins. He also highlighted other indicators, such as the Parabolic SAR (Stop and Reverse) and Average Directional Index (ADX), to show that BTC’s bullish momentum is fading. The expert also warned that a sell signal could send BTC into a Supertrend DownTrend, with the flagship crypto dropping to as low as $22,000.
A Different Perspective For BTC
Crypto analyst Kevin Capital has provided a different perspective on Bitcoin’s price action. While noting that BTC is in a correctional phase, he affirmed that it will soon be over. Kevin Capital claimed that the question is not whether this phase will end. Instead, it is about how strong Bitcoin’s bounce will be and whether the flagship crypto will make new highs or record a lackluster lower high followed by a bear market.
Related Reading
The analyst added that Bitcoin’s price action when that time comes will also be trackable using other methods, such as money flow, macro fundamentals, and overall spot volume. The major focus is on the macro fundamentals as market participants look forward to Donald Trump’s much-anticipated reciprocal tariffs, which will be announced tomorrow.
At the time of writing, the Bitcoin price is trading at around $83,000, up around 1% in the last 24 hours, according to data from CoinMarketCap.
Featured image from Unsplash, chart from Tradingview.com
Source link

Cryptocurrencies will likely be volatile this week once President Donald Trump’s reciprocal tariffs go into effect and the U.S. publishes nonfarm payroll data.
The week started on a dull note, with most coins remaining in a bear market. At last check, Bitcoin (BTC) had dropped to $82,432.00.
The crypto fear and greed index has slumped to the fear zone 25. Some of the top cryptocurrencies to watch this week are Solana, Polkadot, and Cronos.
Solana

Solana (SOL), the popular layer-1 network, will be in the spotlight this week since its price is hovering above the key support level at $119.5. As shown above, it has failed to drop below this level several times since April last year, a sign that bears have been afraid of shorting below it.
Therefore, a drop below $119.5 will confirm a bearish breakdown and point to further downside. Besides, the Solana price formed a death cross pattern on March 3 as the 50-day and 200-day moving averages crossed each other.
A drop below $119.6 indicates a further drop to $100.
Cronos

Cronos, formerly Crypto.com, will be one of the top cryptocurrencies to watch this week because of its strong performance last week. It jumped by 30% in the last seven days, and by 54% from its lowest point this year.
Cronos price has bounced back after Crypto.com partnered with Donald Trump’s Trump Media to launch ETFs. It also rose after the community voted to allow the creation of another 70 billion CRO tokens, which will be used to create a Strategic Crypto Reserve.
The community also voted to burn 50 million CRO tokens. The daily chart shows that the Cronos price rebounded after hitting the crucial support level at $0.0715, where it failed to drop below in August and November last year.
A breakout above this month’s high of $0.1197 will point to further gains, potentially to the 50% retracement level at $0.133.
Polkadot

Polkadot (DOT) will be a top crypto to watch because its price is at a crucial support level. DOT was trading at $4.08, a few points above the key support point at $3.60.
This support is crucial since it failed to drop below it several times since 2022.
Polkadot price has also formed a falling wedge pattern, with the two lines nearing their confluence level. This price action points toward a strong bullish breakout in most periods, which may happen this week. Such a move would see DOT price jump to $12.
Source link
3M Bollinger Bands
Ethereum Price Hits 300-Week MA For The Second Time Ever, Here’s What Happened In 2022
Reason to trust
![]()
Strict editorial policy that focuses on accuracy, relevance, and impartiality
Created by industry experts and meticulously reviewed
The highest standards in reporting and publishing
Strict editorial policy that focuses on accuracy, relevance, and impartiality
Morbi pretium leo et nisl aliquam mollis. Quisque arcu lorem, ultricies quis pellentesque nec, ullamcorper eu odio.
Ethereum has once again fallen below the $2,000 mark, a psychological level it had briefly reclaimed earlier this week. The market-wide correction over the past 24 hours has weighed on Ethereum’s recovery momentum, and the leading altcoin has seen a dip in sentiment that could lead to a deeper decline or a sharp mid-term rebound.
Short-term sentiment is cautious, but a new analysis from a well-followed crypto analyst has brought attention to a significant technical event that opens up a bullish perspective for the Ethereum price.
Ethereum Hits 300-Week Moving Average Again: What Happened The Last Time?
Taking to social media platform X, crypto analyst CryptoBullet pointed out that Ethereum has now touched the 300-week moving average for only the second time in its history. The first instance was in June 2022, during the market-wide crash that saw the Ethereum price plummet to as low as $880 before beginning a long, slow recovery.
Related Reading
The second occurrence has come this month, March 2025, just as Ethereum continues to extend its struggles in gaining a footing above $2,000. With Ethereum touching the 300-week moving average again, we can only look back to see what happened last time to get a perspective of what to expect now.
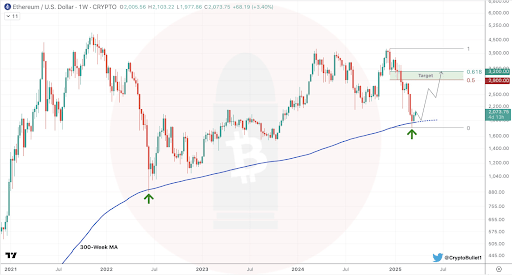
In June 2022, Ethereum’s touch of the 300-week moving average marked the beginning of a long-term recovery phase. After the bounce from that level, the Ethereum price surged more than 140% over the next eight weeks, eventually pushing above $2,100 in August 2022 before another correction.
Mid-Term Rebound In Focus For ETH, But Resistance Ahead
CryptoBullet noted the significance of this moving average, framing it as a key historical support zone. The analyst argued that regardless of bearish sentiment in the short term, this kind of macro-level support typically sets the stage for a meaningful bounce.
Related Reading
“Even if you’re a bear, you can’t deny that we hit a very important support level,” he wrote, adding that his price target for the coming bounce is between $2,900 and $3,200. Nonetheless, the bounce will depend on how the Ethereum price reacts to the level, as a continued downside move would cancel out any bullish momentum.
For now, Ethereum’s price is trapped under bearish sentiment, and bulls will need to reclaim the $2,000 zone before any sustainable bounce toward the $2,900 and $3,200 range can begin to materialize. Furthermore, the recent price correction in the past 24 hours increases the risks of the Ethereum price closing March below the 3M Bollinger bands, which is currently just around $2,000. A close below the 3M Bollinger bands could spell trouble for the leading altcoin.
However, if CryptoBullet’s analysis proves to be accurate, Ethereum may soon enter a period of stronger price action that plays out over the coming weeks. At the time of writing, Ethereum is trading at $1,907, down by 5.82% in the past 24 hours.
Featured image from Unsplash, chart from Tradingview.com
Source link

Bitcoin Price (BTC) Rises Ahead of President Trump Tariff Announcement

XRP Price to $27? Expert Predicts Exact Timeline for the Next Massive Surge
Bitcoin And Altcoins Fischer Transform Indicator Turn Bearish For The First Time Since 2021

Grayscale files S-3 for Digital Large Cap ETF

279% Rally in 2025 for One Under-the-Radar Altcoin ‘Very Likely,’ According to Crypto Analyst

Human Rights Foundation Donates 1 Billion Satoshis To Fund Bitcoin Development

Dogecoin, Cardano Lead Gains as Crypto Majors Rally

Fartcoin price surges 35% as recovery gains momentum

$1M Premium Paid for $70K Bitcoin Put Option

How DePIN’s Revenue Growth is Attracting Equity Investors – DePIN Token Economics Report

Bitcoin Poised For A Q2 Recovery? Analyst Points 2017 Similarities

Binance ends Tether USDT trading in Europe to comply with MiCA rules

Crypto Trader Warns of Potential 33% Dogecoin Drop, Unveils Downside Price Target for Ethereum

Rhode Island Bill Would Allow State Residents Spend $10,000 Monthly In Bitcoin Tax Free

There’s More to North Korea’s Hacking Ops Than Just Lazarus Group: Paradigm

Arthur Hayes, Murad’s Prediction For Meme Coins, AI & DeFi Coins For 2025

Expert Sees Bitcoin Dipping To $50K While Bullish Signs Persist

Aptos Leverages Chainlink To Enhance Scalability and Data Access

Bitcoin Could Rally to $80,000 on the Eve of US Elections

Sonic Now ‘Golden Standard’ of Layer-2s After Scaling Transactions to 16,000+ per Second, Says Andre Cronje

Institutional Investors Go All In on Crypto as 57% Plan to Boost Allocations as Bull Run Heats Up, Sygnum Survey Reveals

Crypto’s Big Trump Gamble Is Risky

Ripple-SEC Case Ends, But These 3 Rivals Could Jump 500x

Has The Bitcoin Price Already Peaked?

A16z-backed Espresso announces mainnet launch of core product

Xmas Altcoin Rally Insights by BNM Agent I

Blockchain groups challenge new broker reporting rule

The Future of Bitcoin: Scaling, Institutional Adoption, and Strategic Reserves with Rich Rines

Trump’s Coin Is About As Revolutionary As OneCoin

Is $200,000 a Realistic Bitcoin Price Target for This Cycle?
 24/7 Cryptocurrency News5 months ago
Arthur Hayes, Murad’s Prediction For Meme Coins, AI & DeFi Coins For 2025
 Bitcoin3 months ago
Expert Sees Bitcoin Dipping To $50K While Bullish Signs Persist
 24/7 Cryptocurrency News3 months ago
Aptos Leverages Chainlink To Enhance Scalability and Data Access
 Bitcoin5 months ago
Bitcoin Could Rally to $80,000 on the Eve of US Elections
 Altcoins2 months ago
Sonic Now ‘Golden Standard’ of Layer-2s After Scaling Transactions to 16,000+ per Second, Says Andre Cronje
 Bitcoin5 months ago
Institutional Investors Go All In on Crypto as 57% Plan to Boost Allocations as Bull Run Heats Up, Sygnum Survey Reveals
 Opinion5 months ago
Crypto’s Big Trump Gamble Is Risky
- Price analysis5 months ago
Ripple-SEC Case Ends, But These 3 Rivals Could Jump 500x
