
Bitcoin
Bitcoin Support Thins Below $78,000 As Cost Basis Clusters Shift Toward $95,000
Reason to trust
![]()
Strict editorial policy that focuses on accuracy, relevance, and impartiality
Created by industry experts and meticulously reviewed
The highest standards in reporting and publishing
Strict editorial policy that focuses on accuracy, relevance, and impartiality
Morbi pretium leo et nisl aliquam mollis. Quisque arcu lorem, ultricies quis pellentesque nec, ullamcorper eu odio.
Bitcoin’s price action in the past 48 hours has seen it approaching the $80,000 price level again, with risks of breaking to the downside. Looking at on-chain data shows a notable support level between $80,920 and $78,000 that must not be broken.
Related Reading
Particularly, on-chain analytics from Glassnode point to a thinning of support at the $78,000 level, where only minimal cost basis clusters now exist. The insight follows a sharp move that saw savvy traders scoop up nearly 15,000 Bitcoin at the March 10 low before cashing out at the $87,000 local top.
Support Cushion Rises With Clusters Between $80,000 And $84,000
Bitcoin started the month of March with a crazy crash that saw its price hit below $77,000 on March 10 and March 11. Most of the month was spent by Bitcoin embarking on a recovery from this level, eventually reaching as high as $88,500 last week.
Interestingly, on-chain data from Glassnode shows that some Bitcoin traders took advantage of the crash and bought about 15,000 BTC at this low. However, many addresses from this same cohort sold at the $87,000 local top, leaving behind a depleted buffer zone that may no longer offer the same price stability.
Bitcoin’s strongest cost basis clusters have steadily migrated upward from $78,000 throughout the month, with the most prominent support levels now sitting between $80,920 and $84,100. Approximately 20,000 BTC were acquired at $80,920, 50,000 BTC at $82,090, and another 40,000 BTC at around $84,100. These fresh accumulations are now the new zones of confidence among recent buyers that may offer cushions for the recent market dip.
At the time of writing, Bitcoin is trading at $83,120, meaning that it has lost the zone of 40,000 BTC around $84,100. This puts the onus on $82,090 and, subsequently, the $80,920 price levels. However, if the correction sharpens further, it wouldn’t be until after $78,000 that structural support reappears at $74,000 and $71,000, where long-term conviction buying occurred, estimated at 49,000 BTC and 41,000 BTC, respectively.
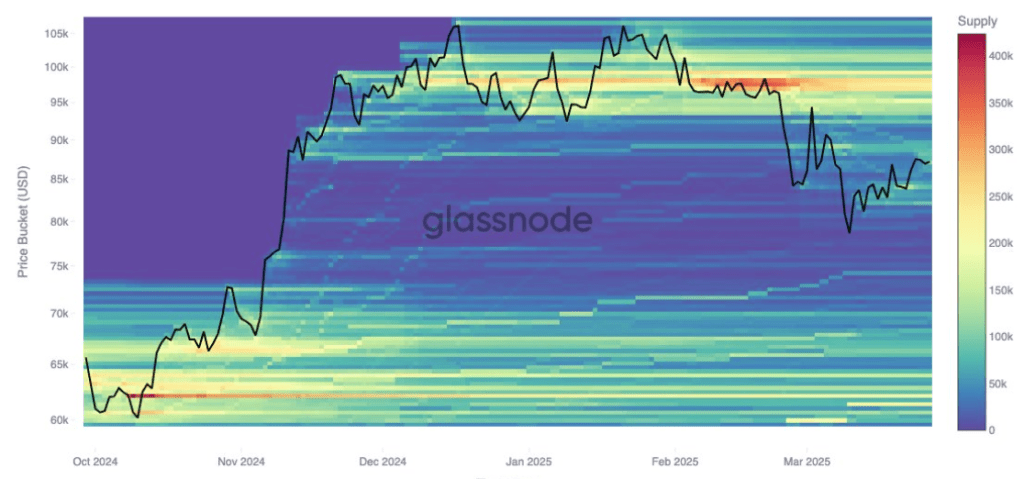
Image From X: Glassnode
$95,000 Cost Basis Cluster Grows With Cooling Demand
As support continues to climb gradually, resistance appears to be firming near the $95,000 mark. Investor cost basis data shows an increase of 12,000 BTC clustered at this level since March 24.
This implies that some investors now anticipate a top forming around $95,000, and selling activity could become more pronounced if prices approach that zone. This resistance, alongside the support levels, could see Bitcoin confined within a narrowing range in the short term.
Related Reading
Glassnode data confirms that long-term holders (addresses holding Bitcoin for more than 150 days) have been the primary source of profit-taking for a while. Long-term holders’ profit-taking is now nearly matched by the losses endured by short-term traders who have been holding Bitcoin for less than 155 days.
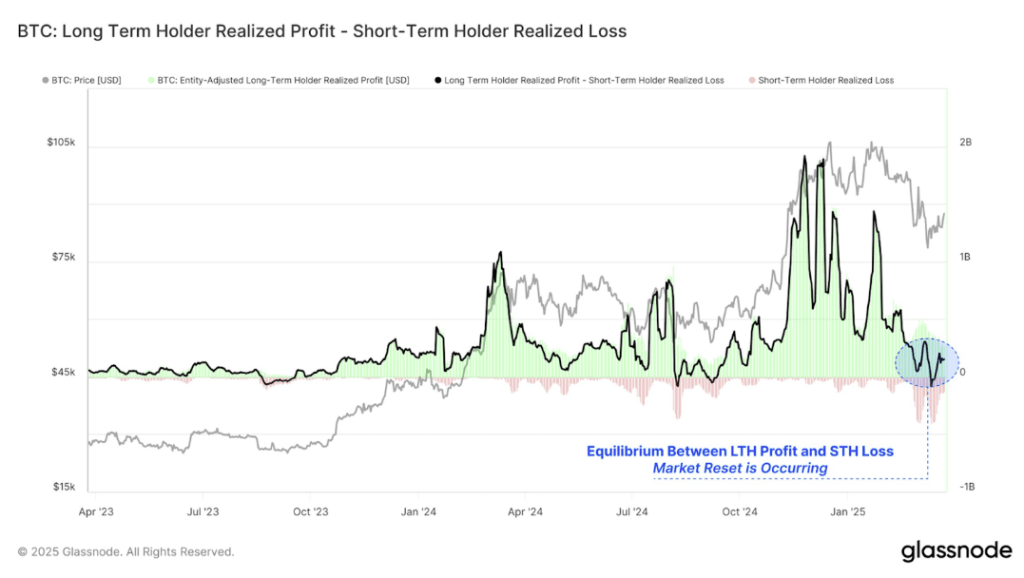
Image From X: Glassnode
Featured image from Tech Research Online, chart from TradingView
Source link


Reason to trust
![]()
Strict editorial policy that focuses on accuracy, relevance, and impartiality
Created by industry experts and meticulously reviewed
The highest standards in reporting and publishing
Strict editorial policy that focuses on accuracy, relevance, and impartiality
Morbi pretium leo et nisl aliquam mollis. Quisque arcu lorem, ultricies quis pellentesque nec, ullamcorper eu odio.
Technical expert Tony Severino has warned that the Bitcoin and altcoins Fischer Transform indicator has flipped bearish for the first time since 2021. The analyst also revealed the implications of this development and how exactly it could impact these crypto assets.
Bitcoin And Altcoins Fischer Transform Indicator Turns Bearish
In an X post, Severino revealed that the total crypto market cap 12-week Fisher Transform has flipped bearish for the first time since December 2021. Before then, the indicator had flipped bearish in January 2018. In 2021 and 2018, the total crypto market cap dropped 66% and 82%, respectively. This provides a bearish outlook for Bitcoin and altcoins, suggesting they could suffer a massive crash soon enough.
Related Reading
In another X post, the technical expert revealed that Bitcoin’s 12-week Fischer Transform has also flipped bearish. Severino noted that this indicator converts prices into a Gaussian normal distribution to smooth out price data and filter out noise. In the process, it helps generate clear signals that help pinpoint major market turning points.
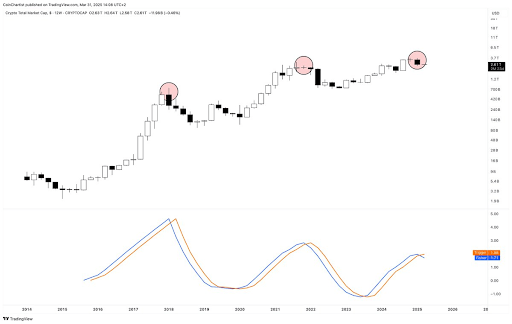
Severino asserted that this indicator on the 12-week timeframe has never missed a top or bottom call, indicating that Bitcoin and altcoins may have indeed topped out. The expert has been warning for a while now that the Bitcoin top might be in and that a massive crash could be on the horizon for the flagship crypto.
He recently alluded to the Elliott Wave Theory and market cycles to explain why he is no longer bullish on Bitcoin and altcoins. He also highlighted other indicators, such as the Parabolic SAR (Stop and Reverse) and Average Directional Index (ADX), to show that BTC’s bullish momentum is fading. The expert also warned that a sell signal could send BTC into a Supertrend DownTrend, with the flagship crypto dropping to as low as $22,000.
A Different Perspective For BTC
Crypto analyst Kevin Capital has provided a different perspective on Bitcoin’s price action. While noting that BTC is in a correctional phase, he affirmed that it will soon be over. Kevin Capital claimed that the question is not whether this phase will end. Instead, it is about how strong Bitcoin’s bounce will be and whether the flagship crypto will make new highs or record a lackluster lower high followed by a bear market.
Related Reading
The analyst added that Bitcoin’s price action when that time comes will also be trackable using other methods, such as money flow, macro fundamentals, and overall spot volume. The major focus is on the macro fundamentals as market participants look forward to Donald Trump’s much-anticipated reciprocal tariffs, which will be announced tomorrow.
At the time of writing, the Bitcoin price is trading at around $83,000, up around 1% in the last 24 hours, according to data from CoinMarketCap.
Featured image from Unsplash, chart from Tradingview.com
Source link
Altcoins
279% Rally in 2025 for One Under-the-Radar Altcoin ‘Very Likely,’ According to Crypto Analyst

A closely followed crypto strategist believes that the native asset of a layer-2 scaling solution could witness an over 3x rally this year.
Pseudonymous analyst Inmortal tells his 231,000 followers on the social media platform X that he’s bullish on Mantle (MNT), noting that he believes the altcoin has already printed a 2025 bottom at around $0.6.
According to the trader, a 279% rally for MNT this year is a high-probability scenario.
“Starting to feel like bottom is in.
Big players have been buying over the last few weeks, and it shows.
$3 in 2025 is very likely, high-conviction play for me.”
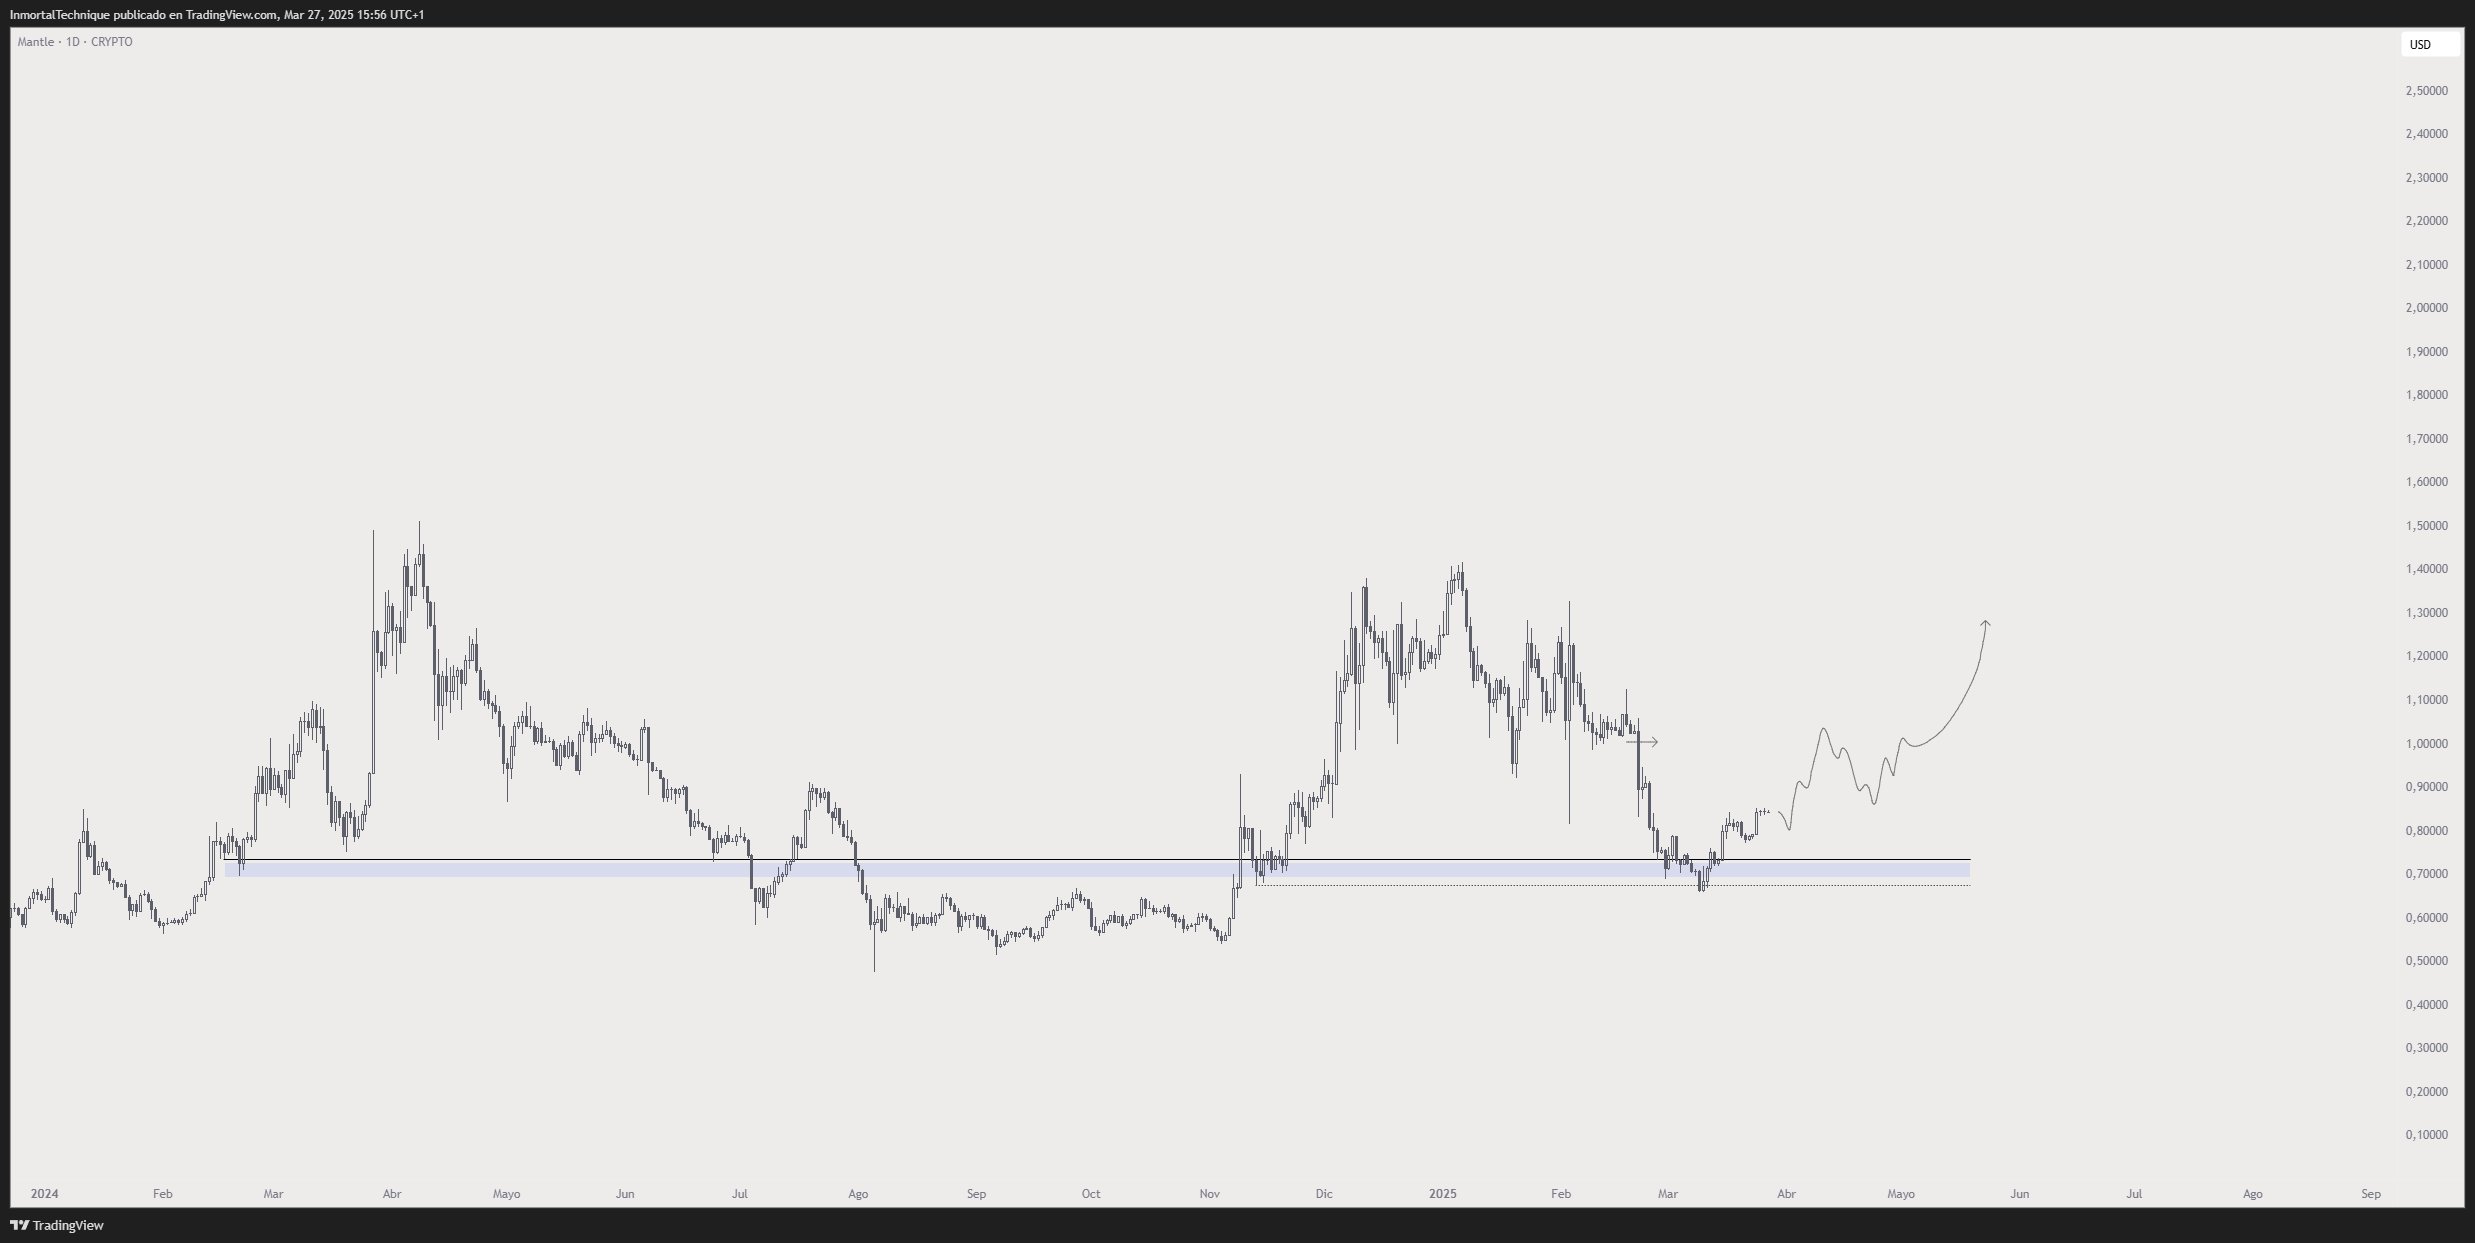
Based on the trader’s chart, he seems to predict that MNT will surge to $1.30 in the coming months.
At time of writing, MNT is worth $0.79.
Turning to Bitcoin, the trader unveils a potential path for BTC to print a durable bottom this year. According to Inmortal, BTC could temporarily drop below $70,000 before igniting the next stage of the bull market en route to a new all-time high of $135,000.
“They will try to shake you out, but this is the bottom.
Save the tweet.
BTC.”
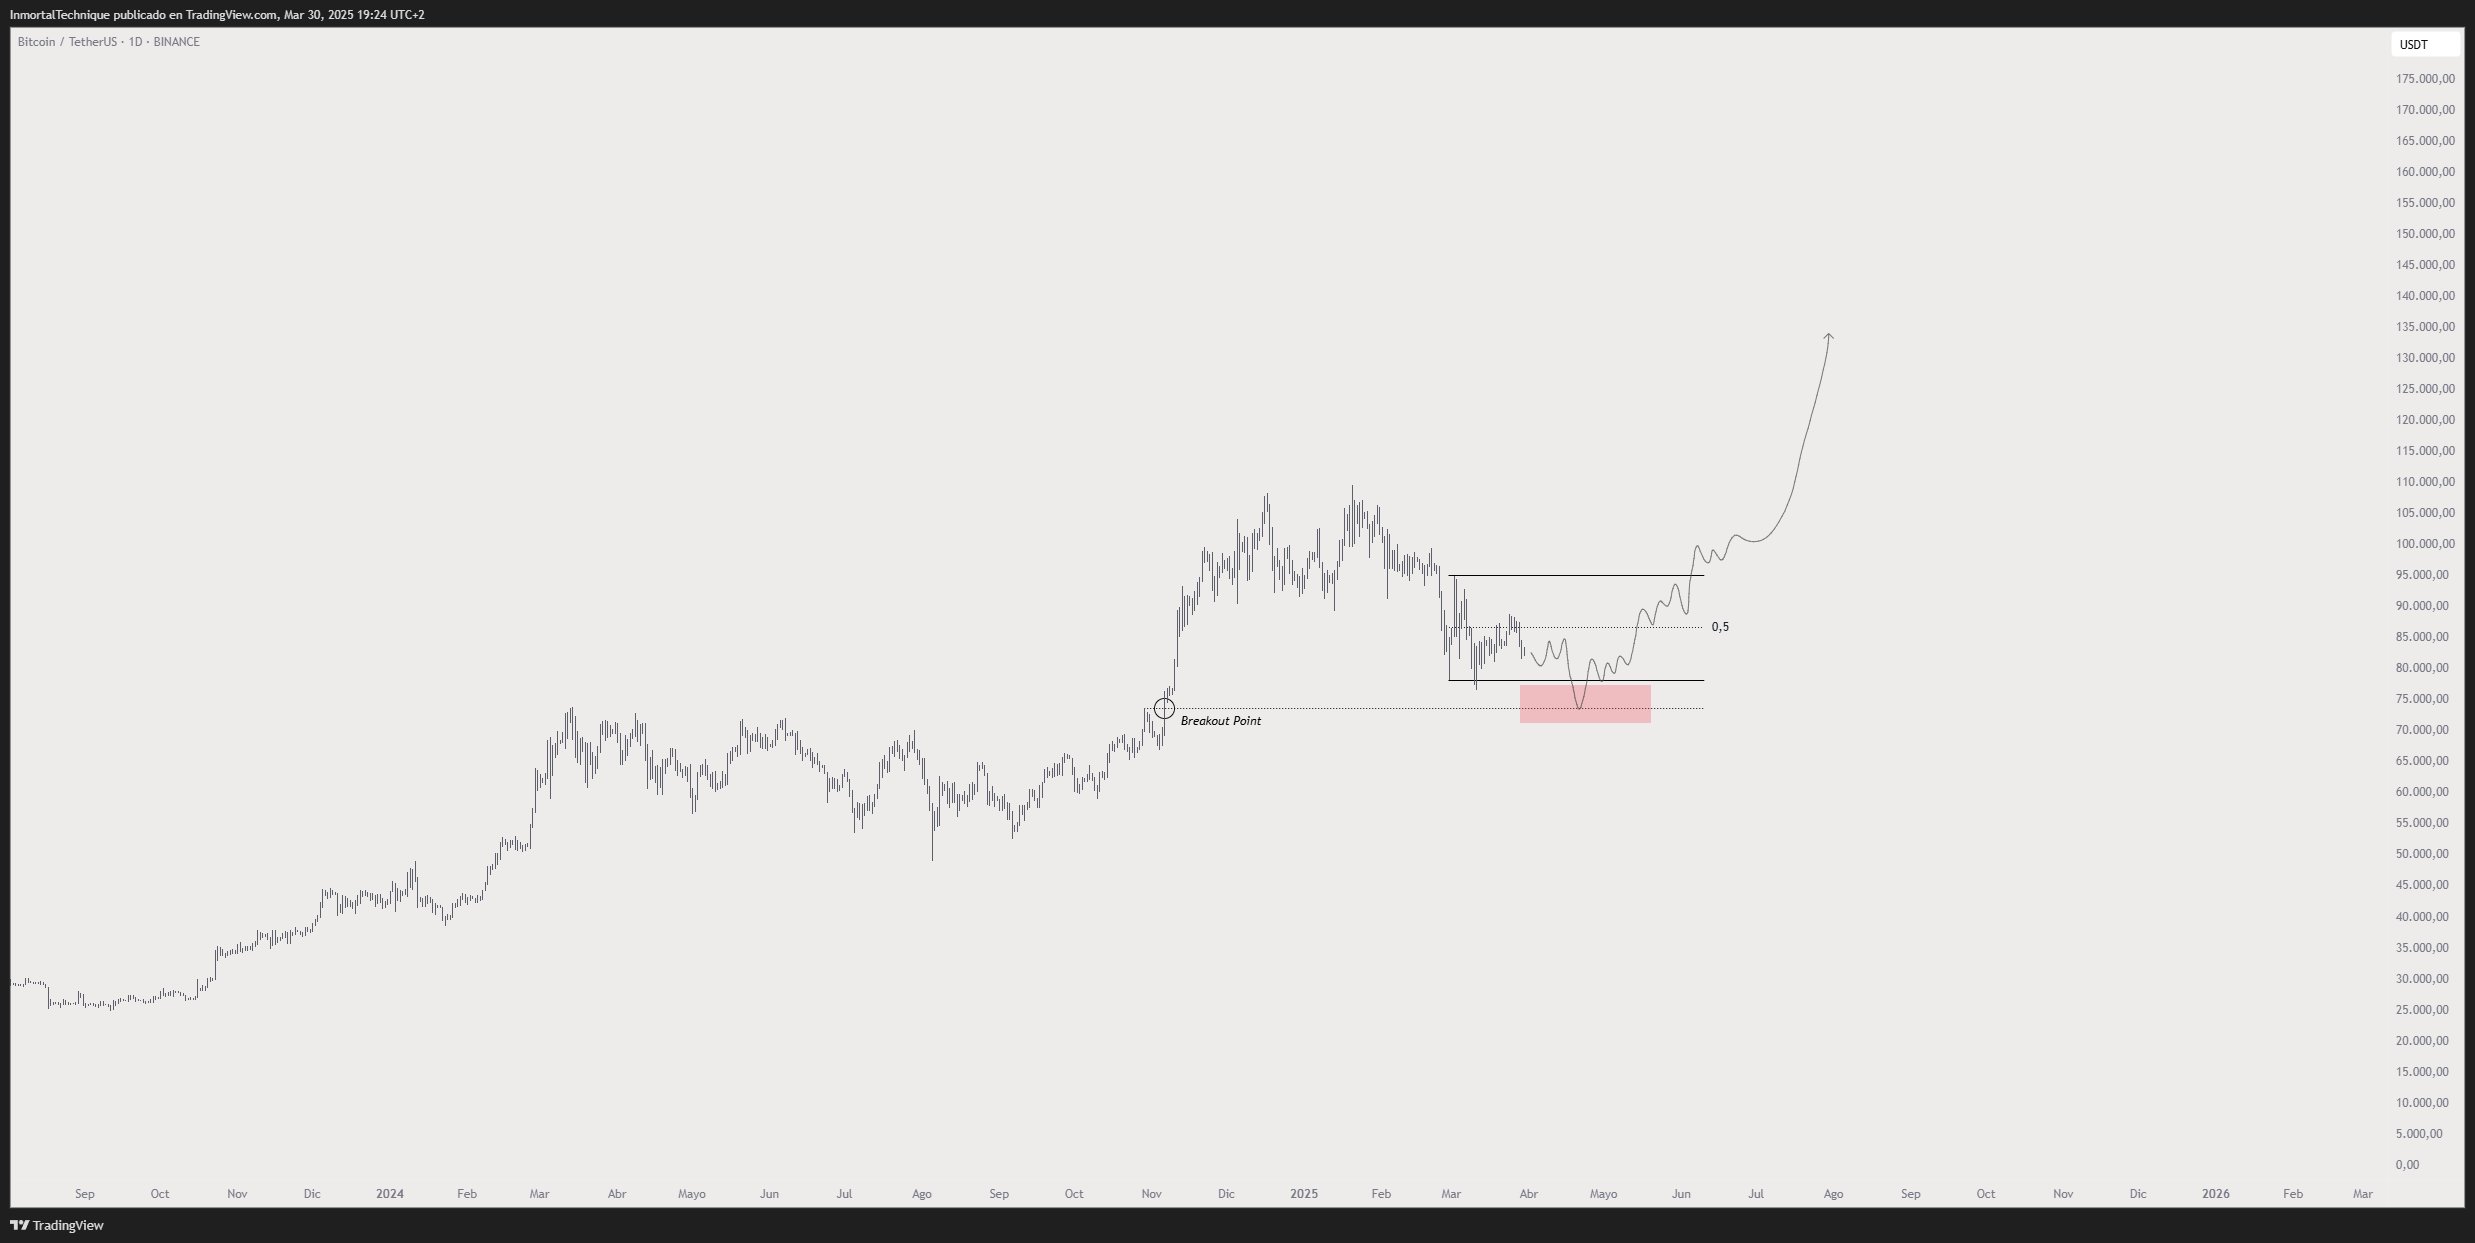
At time of writing, BTC is trading for $82,374.
As for Ethereum, Inmortal predicts that the price of ETH may plummet below $1,500 before sparking a short-term rally toward $2,000.
“Expansions lead to retraces. Retraces lead to bounces.
Bounce soon.”
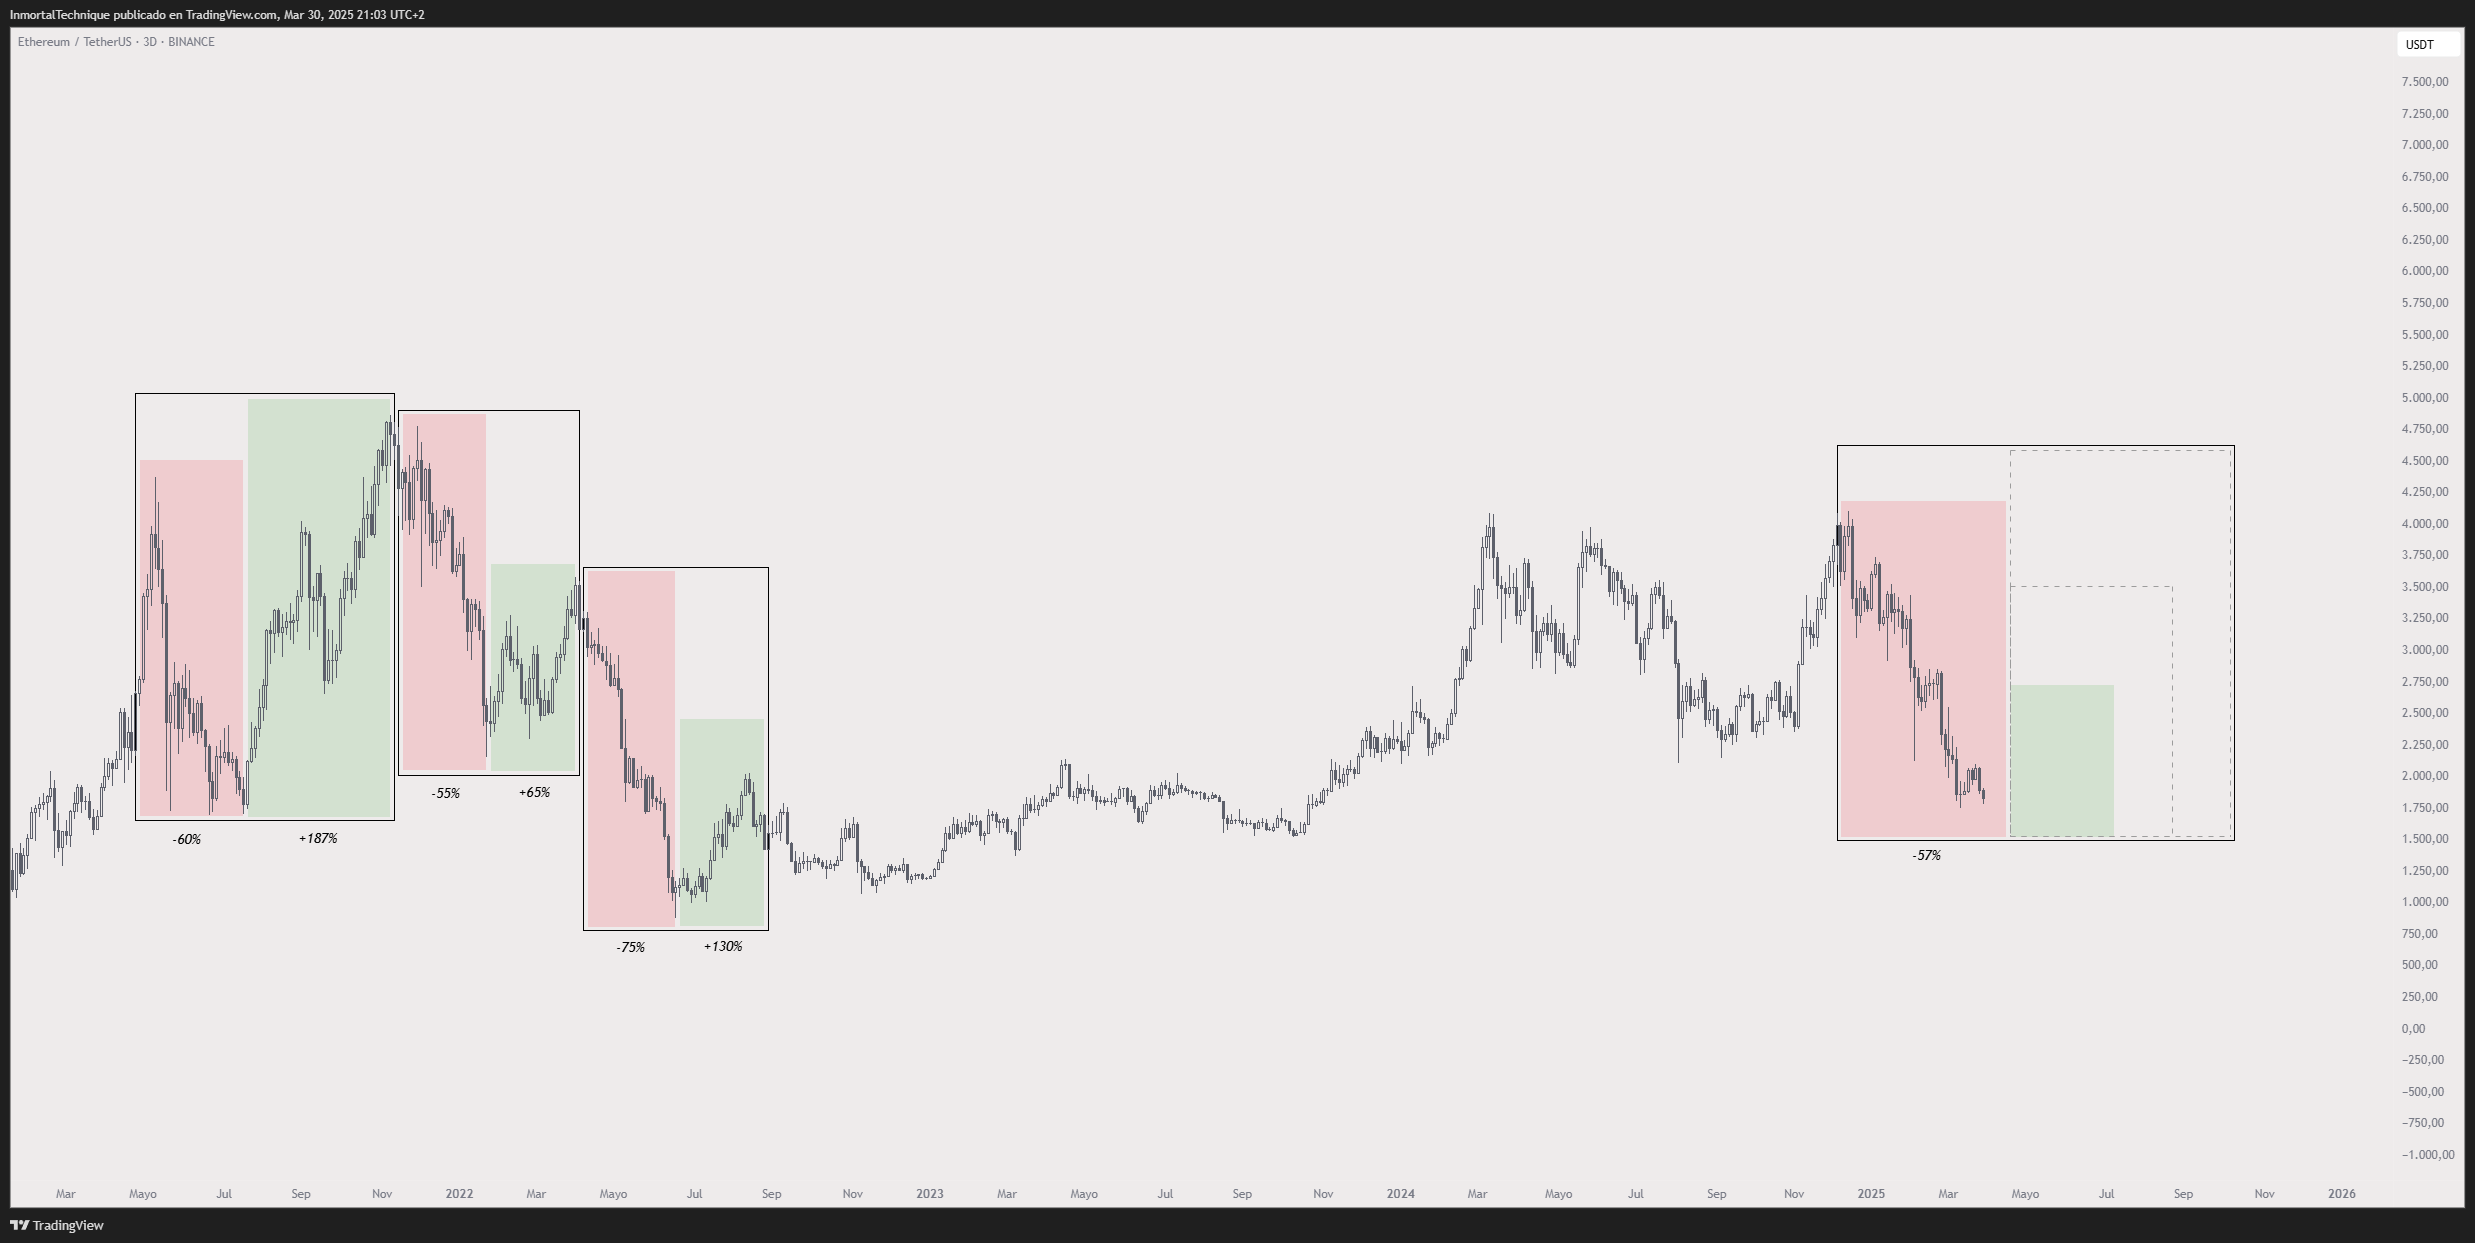
At time of writing, ETH is trading at $1,822.
Follow us on X, Facebook and Telegram
Don’t Miss a Beat – Subscribe to get email alerts delivered directly to your inbox
Check Price Action
Surf The Daily Hodl Mix

Disclaimer: Opinions expressed at The Daily Hodl are not investment advice. Investors should do their due diligence before making any high-risk investments in Bitcoin, cryptocurrency or digital assets. Please be advised that your transfers and trades are at your own risk, and any losses you may incur are your responsibility. The Daily Hodl does not recommend the buying or selling of any cryptocurrencies or digital assets, nor is The Daily Hodl an investment advisor. Please note that The Daily Hodl participates in affiliate marketing.
Generated Image: Midjourney
Source link

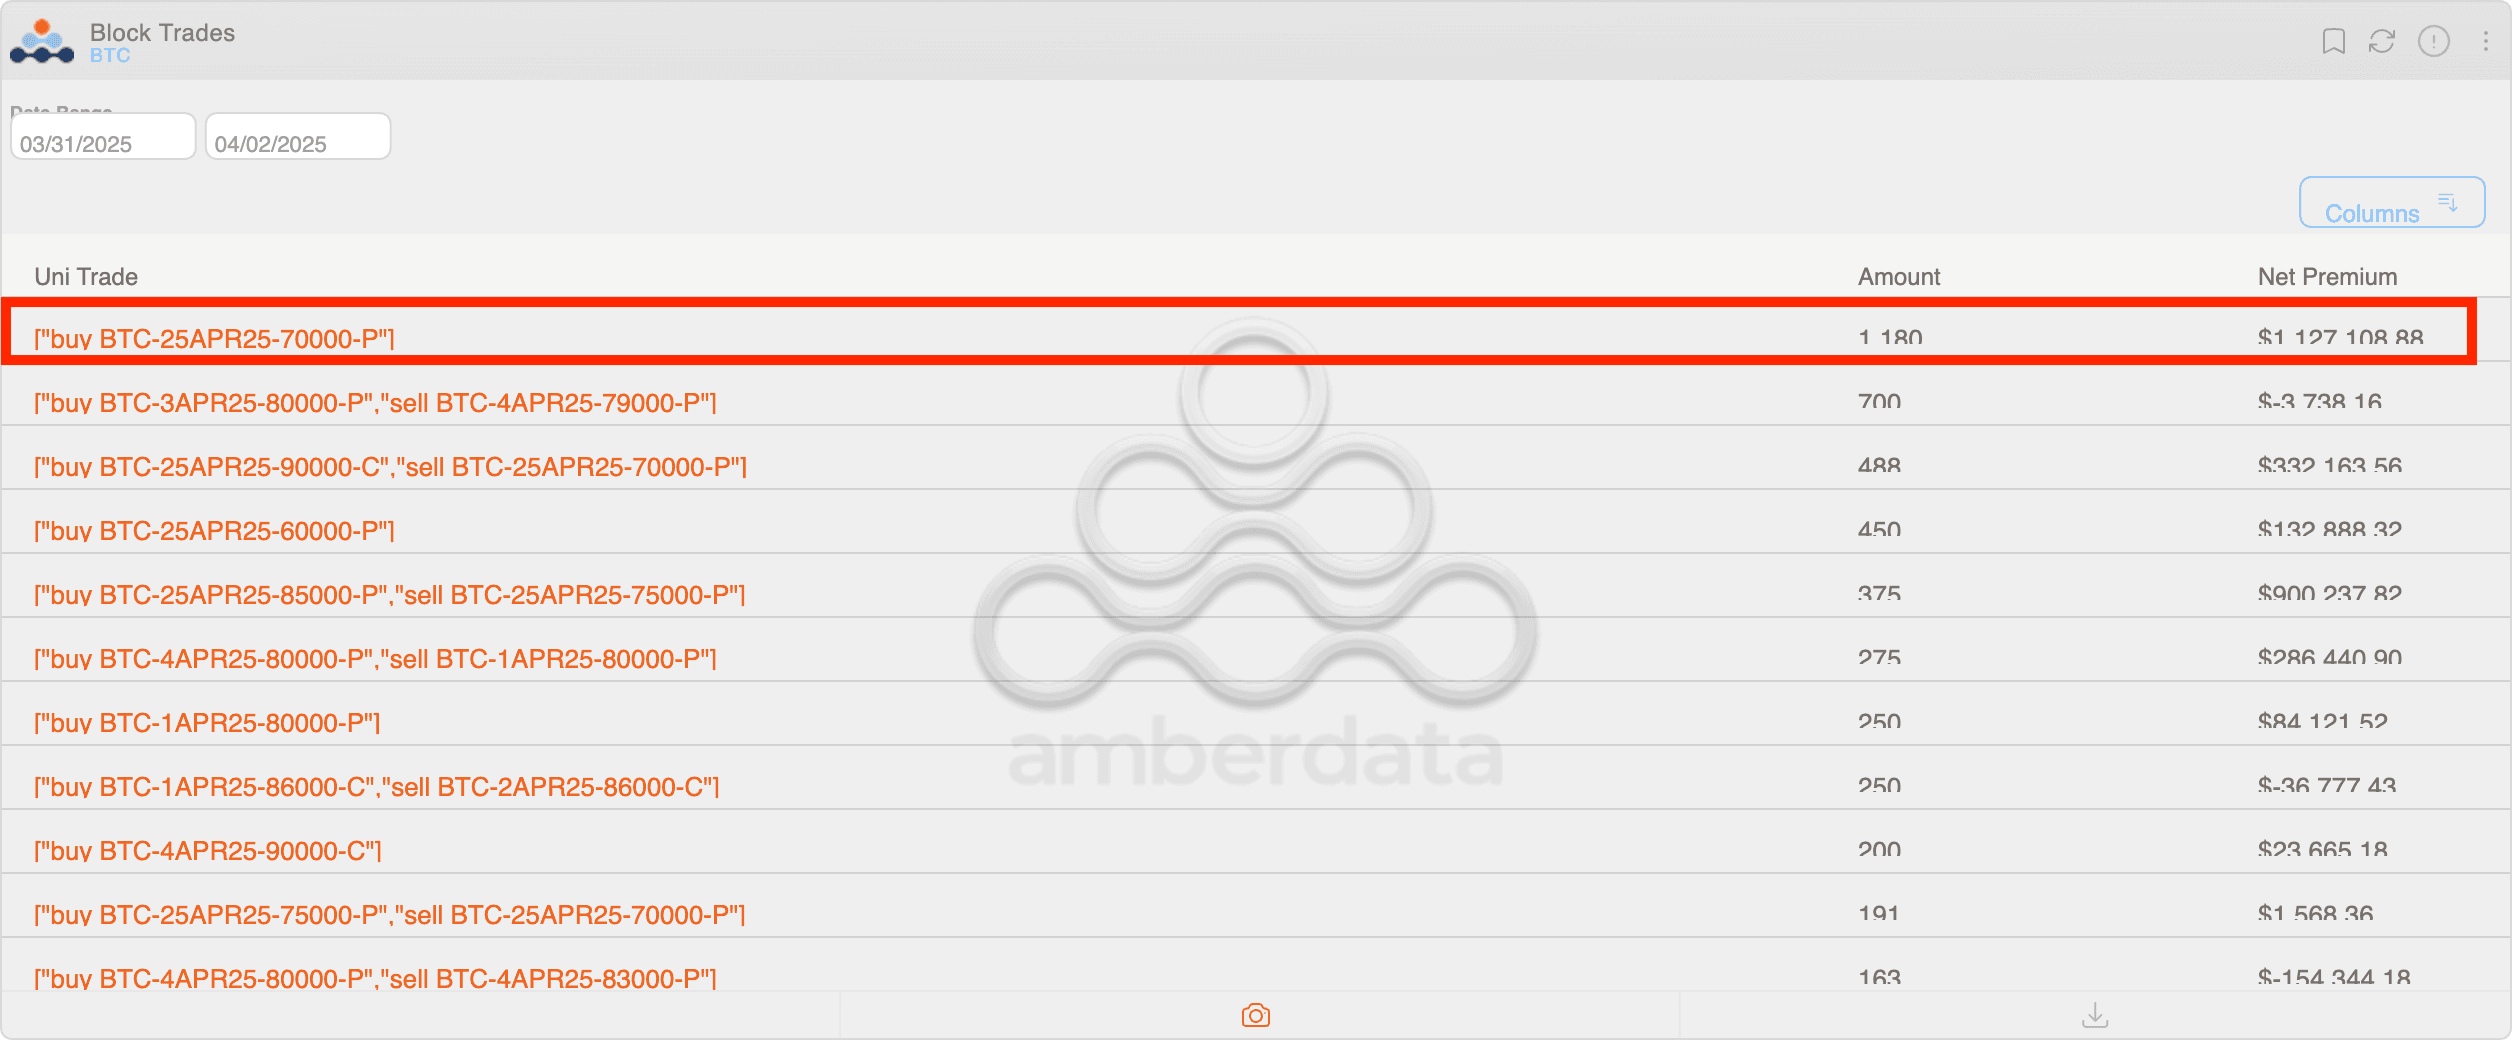
A large bitcoin (BTC) options bet crossed the tape on Deribit as the first quarter drew to a close on Monday, revealing bearish sentiment from the trader behind the move.
The so-called block trade carried a premium of more than $1 million for 1,180 contracts of the $70,000 put option expiring April 25, according to data tracked by Amberdata.
A put option gives the purchaser the right, but not the obligation, to sell the underlying asset at a predetermined price at a later date. A put buyer is essentially bearish on the market, in this case, anticipating a price drop to below $70,000 from the current $84,000.
A block trade is a large, privately negotiated transaction executed outside the public market, typically by institutions, to avoid affecting the going market rate.
Other notable trades included a put ratio spread, featuring long positions in the $75,000 strike put and double short positions in the $70,000 put; and a risk reversal, involving a long position in the $90,000 call and a short position in the $70,000 put, as Pelion Capital founder Tony Stewart noted.
The bearish flow in the $70,000 put follows purchases of put options expiring April 4 in the $78,000 to $85,000 range last week and increased demand for the $76,000 put option expiring on April 25.
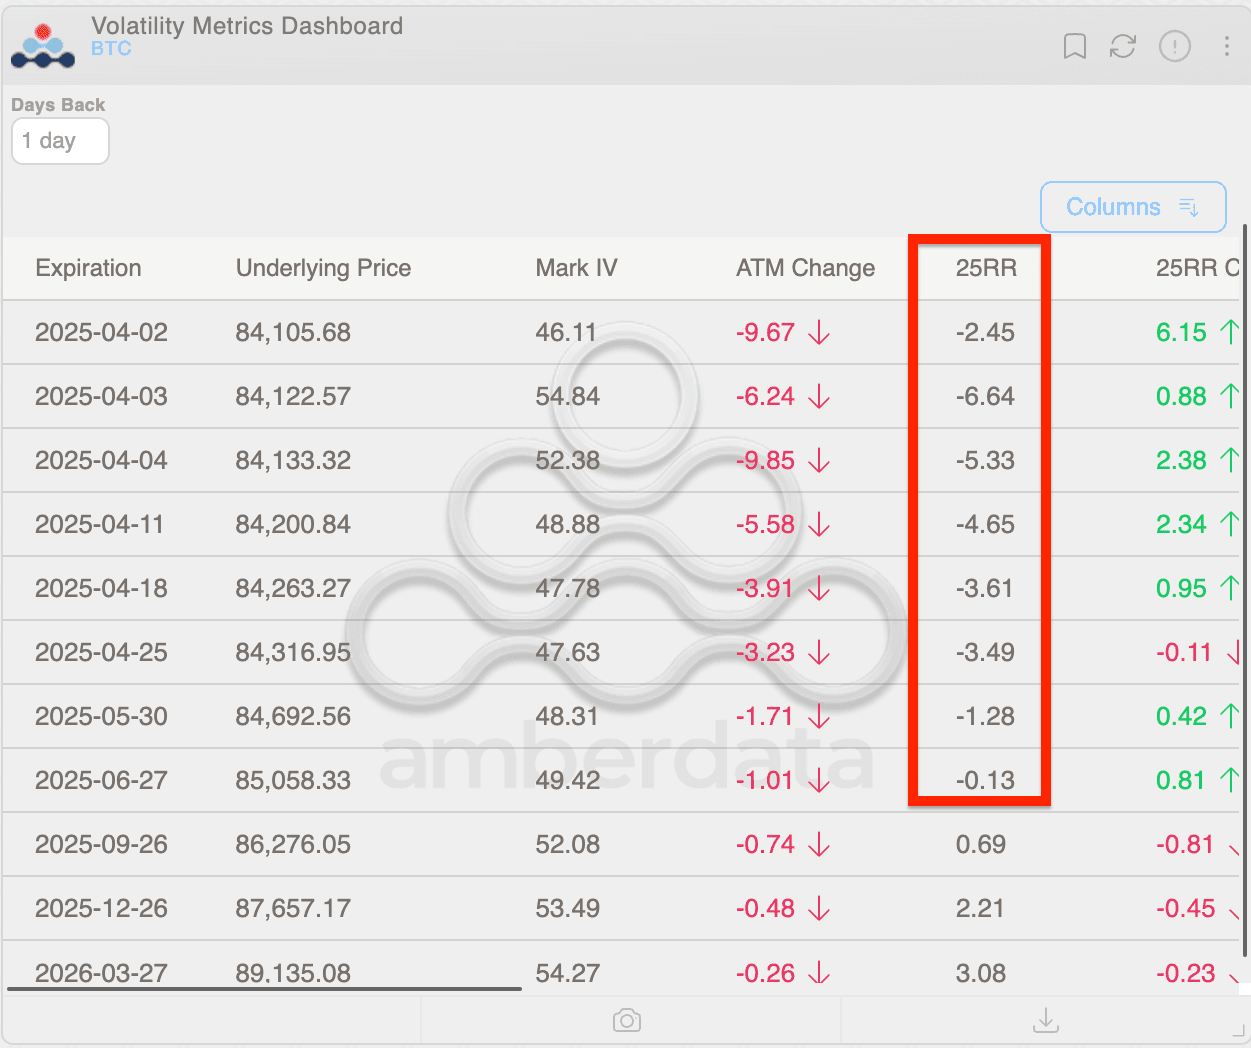
Broadly speaking, BTC puts are trading at a premium to calls, exhibiting downside sentiment out to the May-end expiry, as evident from the negative values in risk reversals.
The bias for puts offering downside protection likely reflects investor anxiety surrounding President Donald Trump’s expected reciprocal tariffs announcement on Wednesday. An aggressive move could weigh on risk assets, including cryptocurrencies.
Source link
Bitcoin And Altcoins Fischer Transform Indicator Turn Bearish For The First Time Since 2021

Grayscale files S-3 for Digital Large Cap ETF

279% Rally in 2025 for One Under-the-Radar Altcoin ‘Very Likely,’ According to Crypto Analyst

Human Rights Foundation Donates 1 Billion Satoshis To Fund Bitcoin Development

Dogecoin, Cardano Lead Gains as Crypto Majors Rally

Fartcoin price surges 35% as recovery gains momentum

$1M Premium Paid for $70K Bitcoin Put Option

How DePIN’s Revenue Growth is Attracting Equity Investors – DePIN Token Economics Report

Bitcoin Poised For A Q2 Recovery? Analyst Points 2017 Similarities

Binance ends Tether USDT trading in Europe to comply with MiCA rules

Crypto Trader Warns of Potential 33% Dogecoin Drop, Unveils Downside Price Target for Ethereum

Rhode Island Bill Would Allow State Residents Spend $10,000 Monthly In Bitcoin Tax Free

There’s More to North Korea’s Hacking Ops Than Just Lazarus Group: Paradigm

zkLend hacker loses 2,930 ETH to Tornado Cash phishing scam

23andMe Is a Wake-Up Call on Data Sovereignty

Arthur Hayes, Murad’s Prediction For Meme Coins, AI & DeFi Coins For 2025

Expert Sees Bitcoin Dipping To $50K While Bullish Signs Persist

Aptos Leverages Chainlink To Enhance Scalability and Data Access

Bitcoin Could Rally to $80,000 on the Eve of US Elections

Sonic Now ‘Golden Standard’ of Layer-2s After Scaling Transactions to 16,000+ per Second, Says Andre Cronje

Institutional Investors Go All In on Crypto as 57% Plan to Boost Allocations as Bull Run Heats Up, Sygnum Survey Reveals

Crypto’s Big Trump Gamble Is Risky

Ripple-SEC Case Ends, But These 3 Rivals Could Jump 500x

Has The Bitcoin Price Already Peaked?

A16z-backed Espresso announces mainnet launch of core product

Xmas Altcoin Rally Insights by BNM Agent I

Blockchain groups challenge new broker reporting rule

The Future of Bitcoin: Scaling, Institutional Adoption, and Strategic Reserves with Rich Rines

Trump’s Coin Is About As Revolutionary As OneCoin

Is $200,000 a Realistic Bitcoin Price Target for This Cycle?
 24/7 Cryptocurrency News5 months ago
Arthur Hayes, Murad’s Prediction For Meme Coins, AI & DeFi Coins For 2025
 Bitcoin3 months ago
Expert Sees Bitcoin Dipping To $50K While Bullish Signs Persist
 24/7 Cryptocurrency News3 months ago
Aptos Leverages Chainlink To Enhance Scalability and Data Access
 Bitcoin5 months ago
Bitcoin Could Rally to $80,000 on the Eve of US Elections
 Altcoins2 months ago
Sonic Now ‘Golden Standard’ of Layer-2s After Scaling Transactions to 16,000+ per Second, Says Andre Cronje
 Bitcoin5 months ago
Institutional Investors Go All In on Crypto as 57% Plan to Boost Allocations as Bull Run Heats Up, Sygnum Survey Reveals
 Opinion5 months ago
Crypto’s Big Trump Gamble Is Risky
- Price analysis5 months ago
Ripple-SEC Case Ends, But These 3 Rivals Could Jump 500x
