
Bitcoin Magazine Pro
Why Smart Investors Buy Bitcoin Not Real Estate

In today’s dynamic economic landscape, seasoned investors are reevaluating their portfolios and considering the potential of Bitcoin as an alternative to traditional assets like real estate. With a finite supply and transformative growth potential, Bitcoin presents a compelling case for forward-thinking investment strategies.
Real Estate: The Illusion of Stability
Real estate has long been regarded as a safe haven for preserving wealth. However, the housing market is not immune to systemic risks such as interest rate hikes, government intervention, and economic downturns. Moreover, property investments often require significant maintenance costs, taxes, and liquidity sacrifices.
Bitcoin, in contrast, offers unparalleled portability, resistance to confiscation, and immunity from local economic or geopolitical disruptions. Unlike property, Bitcoin has no maintenance costs or physical constraints.
The Rise of Bitcoin as a Store of Value
Bitcoin’s limited supply of 21 million coins establishes it as “digital gold” for the 21st century. Over the past decade, Bitcoin has consistently outperformed other asset classes, delivering exponential returns despite volatility.
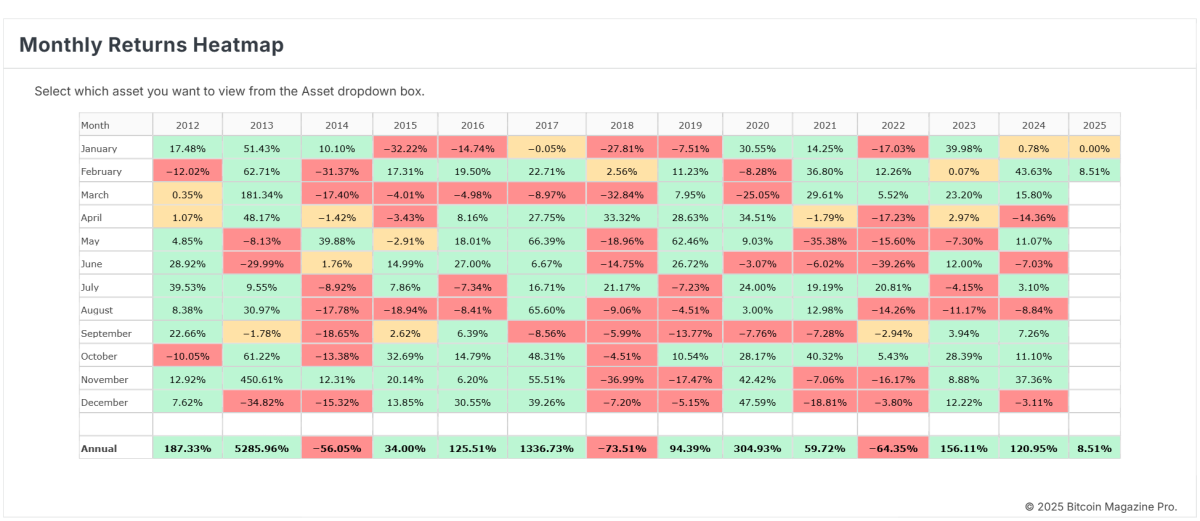
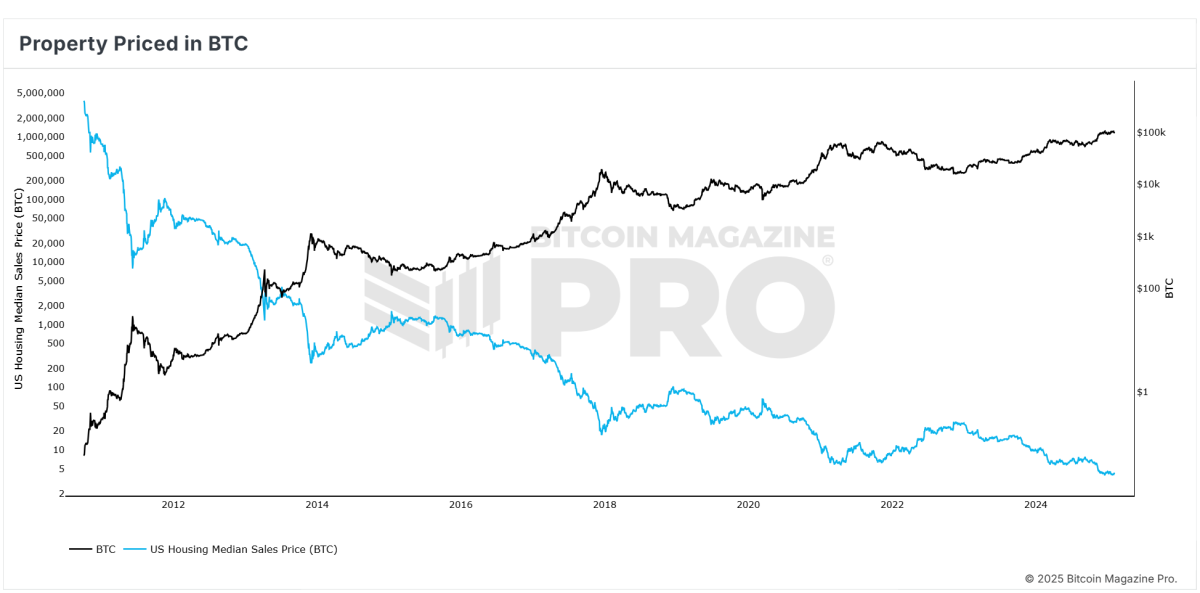
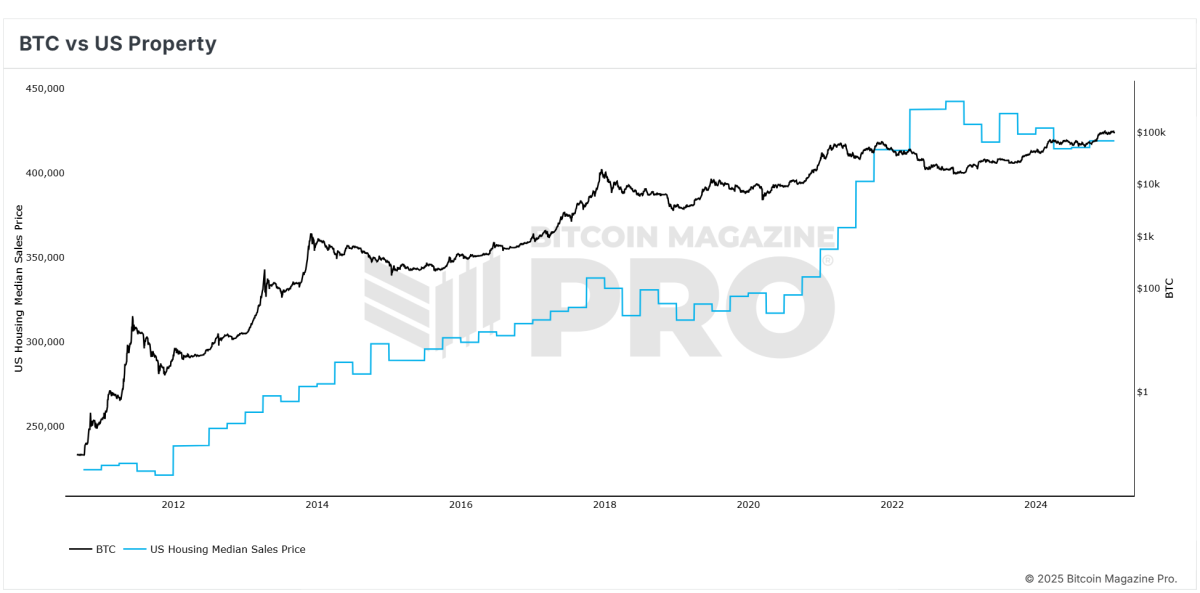
In comparison, real estate’s appreciation is often tied to inflation and government monetary policy, which can diminish its true value over time. Bitcoin, on the other hand, operates on a deflationary model, ensuring scarcity and preserving purchasing power.
Liquidity and Accessibility
Real estate investments often require lengthy transactions, high fees, and significant regulatory hurdles. Selling a property can take months, tying up capital and reducing agility. Bitcoin, however, offers instant liquidity and can be traded 24/7 on global exchanges. This accessibility empowers investors to move their wealth seamlessly across borders.
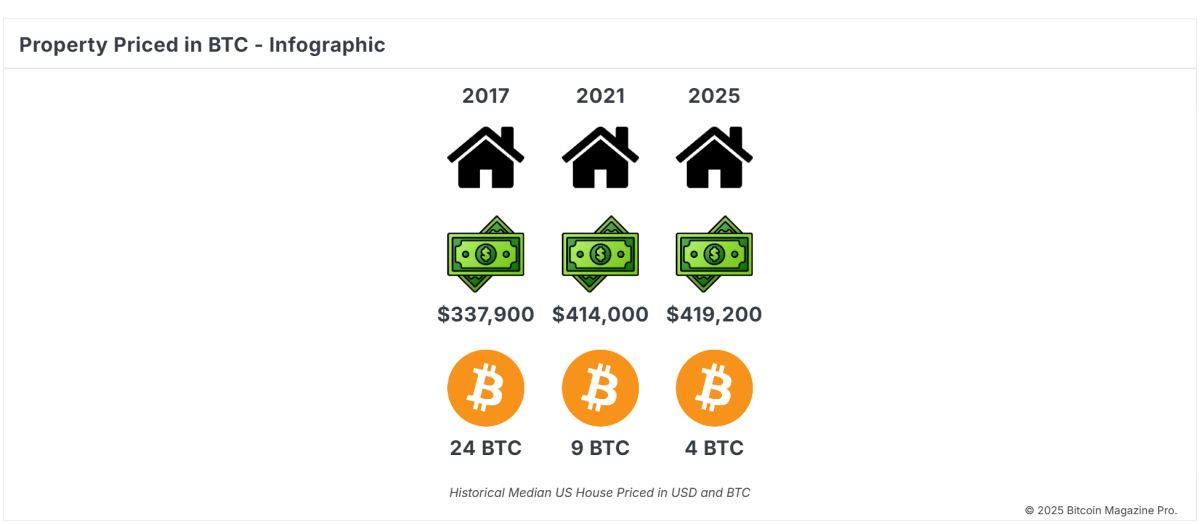
The data underscores Bitcoin’s ability to preserve and grow wealth more effectively than traditional property investments.
Hedging Against Inflation
Real estate prices often mirror inflationary trends but fail to outpace them significantly. Bitcoin, designed as a hedge against fiat currency devaluation, has demonstrated its resilience in inflationary periods. As central banks continue to print money at unprecedented rates, Bitcoin’s finite supply ensures its value is protected from monetary debasement.
Flexibility for Modern Investors
Today’s investors prioritize flexibility and global access. Real estate is a localized, illiquid asset that limits mobility. Bitcoin, by contrast, is borderless and allows for decentralized ownership without reliance on traditional financial systems. This feature is especially attractive to younger, tech-savvy investors who value freedom and control.
A Bold Vision for the Future
Bitcoin is more than just a speculative asset; it’s a financial revolution. By embracing Bitcoin, smart investors position themselves at the forefront of this paradigm shift. As Bitcoin adoption grows, its value proposition becomes increasingly clear: a robust, deflationary asset designed for the modern economy.
Conclusion
While real estate has historically been a cornerstone of investment portfolios, Bitcoin offers a transformative alternative that aligns with the demands of a rapidly evolving global economy. For those seeking to preserve wealth, hedge against inflation, and capitalize on groundbreaking technology, Bitcoin is the asset of choice. The question is no longer “Why Bitcoin?” but rather “Why not Bitcoin?”
If you’re interested in more in-depth analysis and real-time data, consider checking out Bitcoin Magazine Pro for valuable insights into the Bitcoin market.
Disclaimer: This article is for informational purposes only and should not be considered financial advice. Always do your own research before making any investment decisions.
Source link


Following a sharp multi-week selloff that dragged Bitcoin from above $100,000 to below $80,000, the recent price bounce has traders debating whether the Bitcoin bull market is truly back on track or if this is merely a bear market rally before the next macro leg higher.
Bitcoin’s Local Bottom or Bull Market Pause?
Bitcoin’s latest correction was deep enough to rattle confidence, but shallow enough to maintain macro trend structure. Price seems to have set a local bottom between $76K–$77K, and several reliable metrics are beginning to solidify the local lows and point towards further upside.
The Net Unrealized Profit and Loss (NUPL) is one of the most reliable sentiment gauges across Bitcoin cycles. As price fell, NUPL dropped into “Anxiety” territory, but following the rebound, NUPL has now reclaimed the “Belief” zone, a critical sentiment transition historically seen at macro higher lows.

The Value Days Destroyed (VDD) Multiple weighs BTC spending by both coin age and transaction size, and compares the data to a previous yearly average, giving insight into long term holder behavior. Current readings have reset to low levels, suggesting that large, aged coins are not being moved. This is a clear signal of conviction from smart money. Similar dynamics preceded major price rallies in both the 2016/17 and 2020/21 bull cycles.

Bitcoin Long-Term Holders Boost Bull Market
We’re also now seeing the Long Term Holder Supply beginning to climb. After profit-taking above $100K, long-term participants are now re-accumulating at lower levels. Historically, these phases of accumulation have set the foundation for supply squeezes and subsequent parabolic price action.

Bitcoin Hash Ribbons Signal Bull Market Cross
The Hash Ribbons Indicator has just completed a bullish crossover, where the short-term hash rate trend moves above the longer-term average. This signal has historically aligned with bottoms and trend reversals. Given that miner behavior tends to reflect profitability expectations, this cross suggests miners are now confident in higher prices ahead.

Bitcoin Bull Market Tied to Stocks
Despite bullish on-chain data, Bitcoin remains closely tied to macro liquidity trends and equity markets, particularly the S&P 500. As long as that correlation holds, BTC will be partially at the mercy of global monetary policy, risk sentiment, and liquidity flows. While rate cut expectations have helped risk assets bounce, any sharp reversal could cause renewed choppiness for Bitcoin.

Bitcoin Bull Market Outlook
From a data-driven perspective, Bitcoin looks increasingly well-positioned for a sustained continuation of its bull cycle. On-chain metrics paint a compelling picture of resilience for the Bitcoin bull market. The Net Unrealized Profit and Loss (NUPL) has shifted from “Anxiety” during the dip to the “Belief” zone after the rebound—a transition often seen at macro higher lows. Similarly, the Value Days Destroyed (VDD) Multiple has reset to levels signaling conviction among long-term holders, echoing patterns before Bitcoin’s rallies in 2016/17 and 2020/21. These metrics point to structural strength, bolstered by long-term holders aggressively accumulating supply below $80,000.
Further supporting this, the Hash Ribbons indicator’s recent bullish crossover reflects growing miner confidence in Bitcoin’s profitability, a reliable sign of trend reversals historically. This accumulation phase suggests the Bitcoin bull market may be gearing up for a supply squeeze, a dynamic that has fueled parabolic moves before. The data collectively highlights resilience, not weakness, as long-term holders seize the dip as an opportunity. Yet, this strength hinges on more than just on-chain signals—external factors will play a critical role in what comes next.
However, macro conditions still warrant caution, as the Bitcoin bull market doesn’t operate in isolation. Bull markets take time to build momentum, often needing steady accumulation and favorable conditions to ignite the next leg higher. While the local bottom between $76K–$77K seems to hold, the path forward won’t likely feature vertical candles of peak euphoria yet. Bitcoin’s tie to the S&P 500 and global liquidity trends means volatility could emerge from shifts in monetary policy or risk sentiment.
For example, while rate cut expectations have lifted risk assets, an abrupt reversal—perhaps from inflation spikes or geopolitical shocks—could test Bitcoin’s stability. Thus, even with on-chain data signaling a robust setup, the next phase of the Bitcoin bull market will likely unfold in measured steps. Traders anticipating a return to six-figure prices will need patience as the market builds its foundation.
If you’re interested in more in-depth analysis and real-time data, consider checking out Bitcoin Magazine Pro for valuable insights into the Bitcoin market.
Disclaimer: This article is for informational purposes only and should not be considered financial advice. Always do your own research before making any investment decisions.
Source link
After reaching an all-time high above $100,000, the Bitcoin price has entered a multi-week downtrend. This correction has naturally raised questions about whether Bitcoin is still aligned with the 2017 bull cycle. Here we’ll analyze the data to assess how closely Bitcoin’s current price action correlates with previous bull markets, and what we can expect next for BTC.
Bitcoin Price Trends in 2025 vs. 2017 Bull Cycle
Bitcoin’s price trajectory since the cycle lows set during the 2022 bear market has shown remarkable similarities to the 2015–2017 cycle, the bull market that culminated in Bitcoin reaching $20,000 in December 2017. However, Bitcoin’s recent downtrend marks the first major divergence from the 2017 pattern. If Bitcoin were still tracking the 2017 cycle, it should have been rallying to new all-time highs over the past month, instead, Bitcoin has been moving sideways and declining, suggesting that the correlation may be weakening.


Despite the recent divergence, the historical correlation between Bitcoin’s current cycle and the 2017 cycle remains surprisingly high. The correlation between the current cycle and the 2015–2017 cycle was around 92% earlier this year. The recent price divergence has reduced the correlation slightly to 91%, still an extremely high figure for financial markets.
How Bitcoin Market Behavior Echoes 2017 Cycle Patterns
The MVRV Ratio is a key indicator of investor behavior. It measures the relationship between Bitcoin’s current market price and the average cost basis of all BTC held on the network. When the MVRV ratio rises sharply, it indicates that investors are sitting on significant unrealized profits, a condition that often precedes market tops. When the ratio declines toward the realized price, it signals that Bitcoin is trading close to the average acquisition price of investors, often marking a bottoming phase.

The recent decline in the MVRV ratio reflects Bitcoin’s correction from all-time highs, however, the MVRV ratio remains structurally similar to the 2017 cycle with an early bull market rally, followed by multiple sharp corrections, and as such, the correlation remains at 80%.
Bitcoin Price Correlation with 2017 Bull Cycle Data
One possible explanation for the recent divergence is the influence of data lag. For example, Bitcoin’s price action has shown a strong correlation with Global Liquidity, the total supply of money in major economies; however, historical analysis shows that changes in liquidity often take around 2 months to reflect in Bitcoin’s price action.

By applying a 30-day lag to Bitcoin’s price action relative to the 2017 cycle, the correlation increases to 93%, which would be the highest recorded correlation between the two cycles. The lag-adjusted pattern suggests that Bitcoin could soon resume the 2017 trajectory, implying that a major rally could be on the horizon.

What 2017 Bull Cycle Signals Mean for Bitcoin Price Today
History may not repeat itself, but it often rhymes. Bitcoin’s current cycle may not deliver 2017-style exponential gains, but the underlying market psychology remains strikingly similar. If Bitcoin resumes its correlation with the lagging 2017 cycle, the historical precedent suggests that Bitcoin could soon recover from the current correction, and a sharp upward move could follow.
Explore live data, charts, indicators, and in-depth research to stay ahead of Bitcoin’s price action at Bitcoin Magazine Pro.
Disclaimer: This article is for informational purposes only and should not be considered financial advice. Always do your own research before making any investment decisions.
Source link

Bitcoin’s market structure is evolving, and its once-predictable four-year cycles may no longer hold the same relevance. In a recent conversation with Matt Crosby, lead analyst at Bitcoin Magazine Pro, Mitchell Askew, Head Analyst at Blockware Solutions, shared his perspective on how Bitcoin ETFs, mining advancements, and institutional adoption are reshaping the asset’s price behavior.
 Watch the Full Interview:
According to Askew, Bitcoin’s historical pattern of parabolic price increases followed by steep drawdowns is changing as institutional investors enter the market. At the same time, the mining industry is becoming more efficient and stable, creating new dynamics that affect Bitcoin’s supply and price trends.
Bitcoin’s Market Cycles Are Fading
Askew suggests that Bitcoin may no longer experience the extreme cycles of past bull and bear markets. Historically, halving events reduced miner rewards, triggered supply shocks, and fueled rapid price increases, often followed by corrections of 70% or more. However, the increasing presence of institutional investors is leading to a more structured, macro-driven market.
He explains that Spot Bitcoin ETFs and corporate treasury allocations are bringing consistent demand into Bitcoin, reducing the likelihood of extreme boom-and-bust price movements. Unlike retail traders, who tend to buy in euphoria and panic-sell during downturns, institutions are more likely to sell into strength and accumulate Bitcoin on dips.
Askew also notes that since Bitcoin ETFs launched in January 2024, price movements have become more measured, with longer consolidation periods before continued growth. This suggests Bitcoin is beginning to behave more like a traditional financial asset, rather than a speculative high-volatility market.
The Role of Bitcoin Mining in Price Stability
As a mining analyst at Blockware Solutions, Askew provides insight into how Bitcoin mining dynamics influence price trends. He notes that while many assume a rising hash rate is always bullish, the reality is more complex.
In the short term, increasing hash rate can be bearish, as it leads to higher competition among miners and more Bitcoin being sold to cover electricity costs. However, over the long term, a rising hash rate reflects greater investment in Bitcoin infrastructure and network security.
Another key observation from Askew is that Bitcoin’s hash rate growth lags behind price growth by 3-12 months. When Bitcoin’s price rises sharply, mining profitability increases, prompting more capital to flow into mining infrastructure. However, deploying new mining rigs and setting up facilities takes time, leading to a delayed impact on hash rate expansion.
Why Mining Profitability Is Stabilizing
Askew also highlights that mining hardware efficiency is reaching a plateau, which has significant implications for miners and Bitcoin’s supply structure.
If you’re thinking about Bitcoin mining, you MUST watch this clip.
There’s a trend developing in mining hardware that will bode extremely well for miners:
– Longer machine lifespans
– Slowing hashrate growth
– Increased lag between price growth and hashrate growthBitcoin… pic.twitter.com/H0ZjsCm7Rc
— Mitchell
(@MitchellHODL) March 19, 2025


In Bitcoin’s early years, new mining machines offered dramatic efficiency improvements, forcing miners to upgrade hardware every 1-2 years to remain competitive. Today, however, new models are only about 10% more efficient than the previous generation. As a result, mining rigs can now remain profitable for 4-8 years, reducing the pressure on miners to continuously reinvest in new equipment.
Electricity costs remain the biggest factor in mining profitability, and Askew explains that miners are increasingly seeking low-cost power sources to maintain long-term sustainability. Many companies, including Blockware Solutions, operate in rural U.S. locations with stable energy prices, ensuring better profitability even during market downturns.
Could the U.S. Government Start Accumulating Bitcoin?
Another important discussion point raised by Askew is the potential for a U.S. Strategic Bitcoin Reserve (SBR). Some policymakers have proposed that the U.S. government accumulate Bitcoin in the same way it holds gold reserves, recognizing its potential as a global store of value.
Askew explains that if such a reserve were implemented, it could create a massive supply shock, pushing Bitcoin’s price significantly higher. However, he cautions that government action is slow and would likely involve gradual accumulation rather than sudden large-scale purchases.
Even if implemented over several years, such a program could further reinforce Bitcoin’s long-term bullish trajectory by removing available supply from the market.
Bitcoin Price Predictions & Long-Term Outlook
Based on current trends, Askew remains bullish on Bitcoin’s long-term price trajectory, though he believes the market’s behavior is shifting toward more gradual, sustained growth rather than extreme speculative cycles.
 Bitcoin Price Targets for 2025:
- Base Case: $150K – $200K
- Bull Case: $250K+
Long-Term (10-Year) Forecast:
- Base Case: $500K – $1M
- Bull Case: Bitcoin flips gold’s $20T market cap → $1M+ per BTC
Askew sees several key factors driving Bitcoin’s price over the next decade, including: Steady institutional demand from ETFs and corporate treasuries.
Reduced mining hardware upgrades, leading to a more stable industry.
Potential government involvement in Bitcoin reserves.
Macroeconomic conditions such as interest rates, inflation, and global liquidity cycles.
He emphasizes that as Bitcoin’s market structure matures, it may become less susceptible to sharp price swings, making it a more attractive long-term asset for institutions.
Conclusion: A More Mature Bitcoin Market
According to Askew, Bitcoin is undergoing a structural shift that will shape its price trends for years to come. With institutional investors reducing market volatility, mining innovations improving efficiency, and potential government adoption, Bitcoin’s market behavior is beginning to resemble that of gold or other long-term financial assets.
While dramatic parabolic runs may become less frequent, Bitcoin’s long-term trajectory appears stronger and more sustainable than ever. Askew’s perspective reinforces the idea that Bitcoin is no longer just a speculative asset—it is evolving into a key financial instrument with increasing global adoption.
If you’re interested in more in-depth analysis and real-time data, consider checking out Bitcoin Magazine Pro for valuable insights into the Bitcoin market.
Disclaimer: This article is for informational purposes only and should not be considered financial advice. Always do your own research before making any investment decisions.
Source link

This Week in Crypto Games: ‘Off the Grid’ Token, GameStop Goes Bitcoin, SEC Clears Immutable

Binance debuts centralized exchange to decentralized exchange trades

Why Is the Crypto Market Down Today? Bitcoin Drops to $82K as Traders Flee Risk Assets Amid Macro Worries

BTCFi: From passive asset to financial powerhouse?

Hyperliquid Delists $JELLY, Potentially Causing $900K in Losses. Here’s Why Best Wallet Token Can 100x

Cryptocurrencies to Sell Fast if Bitcoin Price Plunges Below $80K

‘Extremely High’ Odds of V-Shaped Recovery for Stock Market, According to Fundstrat’s Tom Lee

Is XRP price around $2 an opportunity or the bull market’s end? Analysts weigh in

What is Dogwifhat (WIF)? The Solana Dog Meme Coin With a Hat

Ethereum’s time is ‘meow?’ Vitalik Buterin video go ‘vrial’

Bitcoin Miner MARA Starts Massive $2B At-the-Market Stock Sale Plan to Buy More BTC

Paul Atkins “Conflict of Interest” Triggers $220M Withdrawals from Ripple Markets

Bitcoin CME Gap Close About To Happen With Push Toward $83k

Listing an altcoin traps exchanges on ‘forever hamster wheel’ — River CEO

Nasdaq Files To Launch a New Grayscale Avalanche (AVAX) Exchange-Traded Fund


 24/7 Cryptocurrency News5 months ago
Arthur Hayes, Murad’s Prediction For Meme Coins, AI & DeFi Coins For 2025

 Bitcoin2 months ago
Expert Sees Bitcoin Dipping To $50K While Bullish Signs Persist

 24/7 Cryptocurrency News3 months ago
Aptos Leverages Chainlink To Enhance Scalability and Data Access

 Bitcoin5 months ago
Bitcoin Could Rally to $80,000 on the Eve of US Elections

 Altcoins2 months ago
Sonic Now ‘Golden Standard’ of Layer-2s After Scaling Transactions to 16,000+ per Second, Says Andre Cronje

 Bitcoin5 months ago
Institutional Investors Go All In on Crypto as 57% Plan to Boost Allocations as Bull Run Heats Up, Sygnum Survey Reveals

 Opinion5 months ago
Crypto’s Big Trump Gamble Is Risky

 Price analysis5 months ago
Ripple-SEC Case Ends, But These 3 Rivals Could Jump 500x
