
Bitcoin price
Bitcoin Price Set To Explode as Global Liquidity Z Score Flashes Buy Signal

Bitcoin (BTC) showed strength over the weekend after a 2.45% rally to the upside. This minor rally aligns with the US stock market’s positive outlook and rising global liquidity, which promotes a risk-on behavior among investors. With the global liquidity index’s Z score flashing a buy signal, Bitcoin price could be set for explosive growth in the near future.
Bitcoin Price Today
Bitcoin price today is up 1.39%, continuing its weekend rally, slowly approaching the $90,000 psychological level. BTC saw a 4.24% gain last week, marking the second positive week after a brutal 15% sell-off in the first week of March.
Odds of BTC Rally Improves as Global Liquidity Explodes
According to data provider Alpha Edge, the traditional Global Liquidity Index is not a great tool to track. However, the Z-score of this metric shows that every time the liquidity index has fallen to -3, it was a strong buy signal. On the other hand, a +3 reading of the Z score is a sell signal. After the early March crash, the Global Liquidity Index flashed a buy signal, suggesting that an explosive uptrend is next for BTC price.
“The Divergence metric between Global Liquidity and Bitcoin has flashed a rare green buy signal. Historically, every green buy or red sell offered a good opportunity to add or sell.”

With abundant liquidity, risk-on behaviour is a must, as seen in late 2021 and 2023, which were followed by periods of exponential rally in BTC price.
Reduced Selling Pressure Points to Bullish Bitcoin Outlook
Adding credence to this outlook is the net Taker Volume indicator that has been reducing since late February 2025. A decline in this metric shows that the selling pressure is dwindling, which further hints at a potential bullish reversal in Bitcoin price trend.
Analyst Axel Adler Jr, who pointed out this outlook, says,
“In the absence of negative macroeconomic or market catalysts, the current week holds potential for moderate growth.”

In conclusion, the two positive weekly closes, coupled with increasing global liquidity and declining taker volume, hint at a bullish Bitcoin price prediction. Let’s explore key BTC levels to watch for when this scenario unfolds.
Key BTC Price Levels to Watch as $1.5B Positions At Risk of Liquidation
Liquidation map data from CoinGlass shows that $87,813 is critical; a BTC price breakout above this could liquidate $640 million worth of short positions. On the contrary, a breakdown below $85,633 will liquidate $942 million in long positions
In total, a spike in Bitcoin price below $85,633 followed by a continuation of the uptrend toward $90K could result in a liquidation event earily worth more than $1.5 billion.

Conclusion
The combination of the Global Liquidity Index’s Z score flashing a buy signal, declining net Taker Volume, and positive weekly closes suggests that Bitcoin price is set for an explosive growth in the near future.
Akash Girimath
Senior Cryptocurrency Analyst & Market Strategist
Engineer-turned-analyst Akash Girimath delivers data-driven insights on cryptocurrency markets, DeFi, and blockchain technology for platforms like AMBCrypto and FXStreet. Specializing in technical analysis, on-chain analytics, and risk management, he empowers institutional investors and retail traders to navigate market volatility and regulatory shifts.
A hands-on strategist, Akash merges active crypto portfolio management with research on Web3, NFTs, and tokenomics. At AMBCrypto, he led cross-functional teams to redesign content frameworks, achieving record-breaking traffic growth through scalable editorial strategies. His analyses dissect market sentiment, investment strategies, and price predictions, blending macroeconomic trends with real-world trading expertise.
Known for mentoring analysts and optimizing workflows for high-impact reporting, Akash’s work is cited across global crypto publications, reaching 500k+ monthly readers. Follow his insights on YouTube, X, and LinkedIn for cutting-edge perspectives on decentralized ecosystems and crypto innovation.
Disclaimer: The presented content may include the personal opinion of the author and is subject to market condition. Do your market research before investing in cryptocurrencies. The author or the publication does not hold any responsibility for your personal financial loss.
Source link


The crypto market has dropped today, March 28, with Bitcoin price dropping below $86,000. This decline in BTC price has also affected Ethereum, XRP, and Dogecoin. This widespread market crash has been caused by a massive sell-off in the spot market as depicted by data from Bitfinex. Macroeconomic concerns such as Trump’s fresh tariffs and the PCE inflation data are also causing market anxiety.
Why is BTC, ETH, XRP, and DOGE Dropping Today?
Bitcoin price struggles to defend the support level at $86,000 following a 1.6% dip in 24 hours. At the same time, Ethereum and XRP have fallen by 5% and 4%, respectively. Dogecoin price has experienced the biggest single-day loss of 7% despite analysts sharing a positive DOGE outlook.
One of the reasons why the Bitcoin price is dropping today is an influx of selling activity on the Bitfinex exchange. This selling activity is shown by the spot CVD indicator that points out a large number of sell orders on Bitcoin while buying pressure weakens. The spot CVD has been on a downtrend since early this week, a sign that traders are capitulating.

Ethereum price is also dropping today because of low demand from buyers. One analyst on X noted that selling pressure has been weighing on ETH since December last year. If this continues, Ethereum will continue to drop further and possibly fall below $2,000.
Additionally, the BTC Deribit Skew shows that the market sentiment towards Bitcoin is now bearish. Analyst Nazro has observed an increase in the number of traders that are purchasing put options in the $80,000 to $85,000 price range. When many traders are buying put options instead of call options, it shows that they anticipate the Bitcoin price to continue dropping.

This negative market sentiment adds to the factors that are making the crypto market to drop today.
muthoni
Muthoni Mary is a seasoned crypto market analyst and writer with over three years of experience dissecting blockchain trends, price movements, and market dynamics. With a sharp eye for technical analysis and an in-depth understanding of on-chain metrics, she delivers insightful, data-driven content that helps investors navigate the fast-paced world of digital assets.
Disclaimer: The presented content may include the personal opinion of the author and is subject to market condition. Do your market research before investing in cryptocurrencies. The author or the publication does not hold any responsibility for your personal financial loss.
Source link
Bitcoin
Crypto Pundit Makes Case For Bitcoin Price At $260,000, But This Invalidation Level Threatens The Rally

Reason to trust
![]()
Strict editorial policy that focuses on accuracy, relevance, and impartiality
Created by industry experts and meticulously reviewed
The highest standards in reporting and publishing
Strict editorial policy that focuses on accuracy, relevance, and impartiality
Morbi pretium leo et nisl aliquam mollis. Quisque arcu lorem, ultricies quis pellentesque nec, ullamcorper eu odio.
A prominent crypto pundit has outlined a compelling case for the Bitcoin price outlook, predicting a surge to a target as high as $260,000 this bull cycle. However, a critical invalidation level stands in the way of this bullish scenario, threatening Bitcoin’s projected rally if breached.
On March 26, Gert van Lagen, a well-known crypto analyst on the X social media platform, predicted that the Bitcoin price could hit a bullish target between $200,000 and $300,000. The analyst’s chart suggests that Bitcoin’s price action in the past few years has closely followed a classic market cycle structure, moving through the Accumulation, Redistribution, Re-accumulation, and Distribution phases.
Bitcoin Price Eyes New ATH Above $260,000
Related Reading
After consolidating for seven months in mid-2023 – early 2024, Bitcoin formed a range, allowing the market to absorb supply before another price breakout. Notably, this trend continued in 2025, with BTC breaking out of a seven-month re-accumulation phase.
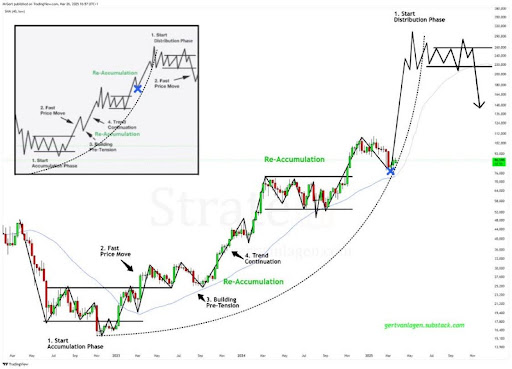
Based on the trajectory of Lagen’s price chart, Bitcoin’s next leg up is a sharp rise to $240,000, followed by a brief correction before rallying to a price peak between $290,000 and $300,000. After hitting this ATH, the analyst predicts that Bitcoin will decline and undergo a period of choppy trading, experiencing price fluctuations between $220,000 and $260,000.
Interestingly, Bitcoin’s projected rise to an ATH and the following sideways trading are expected to occur during its distribution phase, which is typically characterized by increased sell-offs and market volatility. Once BTC experiences a final surge to $260,000, Lagen predicts a price crash toward $148,000 – $136,000, marking the possible end of the bull rally and the start of the bear market.
Key Invalidation Level Threatening BTC’s Rally
Lagen’s optimistic price forecast for Bitcoin is being threatened by a key invalidation level, which could halt the cryptocurrency’s potential surge to $200,000 – $300,000. Although Bitcoin’s bullish structure remains intact, the analyst warns that a weekly close below the 40-week LSMA would invalidate its breakout.
Related Reading
As of writing, the Bitcoin price is consolidating above this key invalidation level at $73,900. As long as it holds above this level, Lagen believes that its bullish trajectory will be sustained. However, a drop below $73,900, which already represents a 15% decline from BTC’s current market price, could postpone the projected surge or cancel it altogether.
Featured image from Adobe Stock, chart from Tradingview.com
Source link

Bitcoin’s price rose 2.6% on Sunday, March 23, crossing the $86,000 mark after a three-day consolidation around $84,000. With growing market optimism following the recent Fed rate pause, speculative BTC traders deployed increased leverage over the weekend. Will BTC advance above $90,000, or will it reverse to $80,000 in the week ahead?
Bitcoin (BTC) Retakes $85,500 After Three-Day Consolidation
After a prolonged consolidation phase, Bitcoin (BTC) made a major recovery bounce on Sunday. Following Trump’s appearance at Blockworks’ Digital Asset Summit, many short-term traders opted to take profits on their BTC holdings.
Despite the decline, Bitcoin continues to find buyers, as the recent U.S. Fed rate pause announced on Wednesday prompted macro-sensitive capital to flow toward risky assets.

Bullish tailwinds from the Fed rate pause counteracted the downward pressure from profit-taking, leading to a three-day stalemate at the $84,000 level since Thursday.
However, as sell-side pressure subsided, BTC price recorded a major breakout above $86,000 on Sunday, March 23. The chart above shows how BTC rose 2.6%, hitting a daily peak of $85,600.
BTC Options Volume nears $800M as Whales Return After Fed Rate Pause
Bitcoin price demonstrated remarkable resilience consolidating around $84,000 over the past three days, as macro-sensitive institutional investors reassess their stance on U.S. economic policies.
Earlier this month, fears of inflationary pressure from Trump’s proposed tariffs triggered a cautious retreat from risk assets, including Bitcoin. However, with recent CPI and PPI reports showing inflation cooling and the Federal Reserve opting to pause rate hikes, large investors appear to be re-entering the market.
This shift in sentiment is reflected in broader financial markets. The S&P 500 surged by 32 points following the Fed rate pause, signalling renewed risk appetite. As Bitcoin mirrors this trend, it has seen a sharp uptick in speculative trading activity from large investors.
Validating this stance, Coinglass derivatives market data shows BTC’s options trading volume skyrocketed 24% in the last 24 hours, pushing total volume above $793 million.

What Does 24% Options Trading Surge Mean for Bitcoin Price Action This Week?
Options trading is a derivatives market strategy that allows traders to bet on the future price movements of an asset without directly purchasing it. This technique is particularly popular among institutional investors and whales because leverage enables traders to control large positions with relatively small capital, amplifying returns, especially during periods of market volatility.
Given that options trading volume surged 24% over the last day, it suggests that whales and institutional investors are taking bullish positions on BTC’s near-term price movements.
Why is BTC Options Volume Rising?
The renewed interest in BTC options trading aligns with key macroeconomic narratives:
- Fed Rate Pause Fuels Risk Appetite – With the Fed pausing rate hikes, liquidity-sensitive assets like Bitcoin become more attractive.
- S&P 500 Rally Indicates Broader Market Confidence – TradFi investors reallocating capital to stocks may also be expanding exposure to BTC.
- Altcoin Season Rotation – With BTC holding steady above $85,000, traders are betting on volatility to capture short-term gains.
Bitcoin Price Forecast: Data Supports Bullish Outlook, But $90K Flip Unlikely
Beyond options trading, other key metrics reinforce a positive BTC outlook for the week ahead:
- Open Interest Rose 3.88% to $54.04B – A sign that new capital is entering the derivatives market.
- Long/Short Ratio at 1.28 on OKX & 1.2217 on Binance – Indicates more traders are placing long bets.
- Liquidations Favor Shorts – Over the last 12 hours, $14.2M in short positions were wiped out, compared to just $2.82M in longs.
With Bitcoin showing strong demand above $86,000 and institutional investors actively positioning through options, a bullish breakout toward $90,000 remains a distinct possibility. However, signals on the daily Bitcoin price forecast charts below suggest the rally could face significant resistance below the $90,000 mark.
Despite these bullish signals, the technical chart presents a nuanced picture. While Bitcoin has reclaimed $85,600, the looming death cross—where the 50-day moving average trends below the 200-day moving average—remains a cause for concern. This bearish formation suggests that unless BTC can decisively break above $87,200, a retracement toward the $80,000 region remains plausible.
Bulls must clear this key resistance zone to sustain momentum toward $90,000. If BTC fails to establish support above $87,200, bears could regain control, triggering a potential pullback.
Frequently Asked Questions (FAQs)
Bitcoin’s bullish momentum suggests it could approach $90,000, but resistance around $87,200 and technical signals indicate potential pullbacks.
Institutional investors and whales are increasing leverage after the Fed rate pause, betting on Bitcoin’s near-term price movement.
The Fed rate pause, stock market trends, and increased institutional activity in options trading are driving Bitcoin’s recent price movements.
ibrahim
Crypto analyst covering derivatives markets, macro trends, technical analysis, and DeFi. His works feature in-depth market insights, price forecasts, and institutional-grade research on digital assets.
Disclaimer: The presented content may include the personal opinion of the author and is subject to market condition. Do your market research before investing in cryptocurrencies. The author or the publication does not hold any responsibility for your personal financial loss.
Source link

Nasdaq Files To Launch a New Grayscale Avalanche (AVAX) Exchange-Traded Fund

How To Measure The Success Of A Bitcoin Treasury Company

Why ‘Tiger King’ Joe Exotic Launched a Solana Meme Coin From Behind Bars

Trump pardons BitMEX, is ‘Bitcoin Jesus’ Roger Ver next?

Terraform Labs to Open Claims Portal for Investors on March 31

BitGo CEO Calls For Regulation Amid Galaxy Digital’s Settlement

Ethereum Bulls Disappointed As Recovery Attempt Fails At $2,160 Resistance

US recession 40% likely in 2025, what it means for crypto — Analyst

Crypto Investment Firm Galaxy Digital Settles With New York AG for $200,000,000 Over Luna Allegations

Bitcoin Covenants: CHECKTEMPLATEVERIFY (BIP 119)

This Week in Bitcoin: GameStop Reveals Reserve, But Inflation Fears Rear Their Head

Solana price prepares a wild ride as risks rise

FTX to Begin $11.4B Creditor Payouts in May After Years-Long Bankruptcy Battle

Here’s Why Crypto Market Is Bleeding Today

Support Or Resistance? Chainlink (LINK) Investor Data Suggests Key Price Zones


 24/7 Cryptocurrency News5 months ago
Arthur Hayes, Murad’s Prediction For Meme Coins, AI & DeFi Coins For 2025

 Bitcoin2 months ago
Expert Sees Bitcoin Dipping To $50K While Bullish Signs Persist

 24/7 Cryptocurrency News3 months ago
Aptos Leverages Chainlink To Enhance Scalability and Data Access

 Bitcoin5 months ago
Bitcoin Could Rally to $80,000 on the Eve of US Elections

 Altcoins2 months ago
Sonic Now ‘Golden Standard’ of Layer-2s After Scaling Transactions to 16,000+ per Second, Says Andre Cronje

 Bitcoin5 months ago
Institutional Investors Go All In on Crypto as 57% Plan to Boost Allocations as Bull Run Heats Up, Sygnum Survey Reveals

 Opinion5 months ago
Crypto’s Big Trump Gamble Is Risky

 Price analysis5 months ago
Ripple-SEC Case Ends, But These 3 Rivals Could Jump 500x

✓ Share: