
Ethereum
Ethereum ‘commoditized itself’ by shifting value to layer-2s, Standard Chartered says


Standard Chartered analysts say Ethereum is going through a “midlife crisis,” with ETH struggling to hold around $2,000.
Ethereum (ETH) has seemingly stuck in limbo as it’s giving away its value for free to layer-2 networks while struggling to keep investors interested. The world’s second-largest cryptocurrency by market capitalization has dropped 40% in the past three months, with Standard Chartered analysts now saying the network if facing “midlife crisis.”
In an interview with the Financial Times, Standard Chartered’s head of digital assets research Geoff Kendrick said the network “gave away value for free” as with layer-2 networks Ethereum has “essentially commoditized itself.”
Now, Ethereum is struggling with keeping its price from falling even further. As of press time, ETH is trading at around $2,054, after plunging to $1,813 earlier in March. Kaiko’s research analyst Adam McCarthy says the decline might be tied due to the fact that Ethereum “is just not interesting to most people.”
“It’s hard to get too excited about amazing feats of engineering when there [are] so many competing things now in the attention economy.”
Adam McCarthy
At the same time, Ethereum’s developers are struggling with internal disagreements, and user activity on the network hasn’t picked up, noted Carol Alexander, a finance professor at the University of Sussex. She added that the decentralized finance vision now feels “much further away now than a year ago” and that decision-making in the Ethereum community has become “a bit of a shambles.”
Ethereum’s direction has been under scrutiny lately as even former Ethereum Foundation engineer Harikrishnan Mulackal criticized the network’s governance, saying it suffers from a “lack of a clear and cohesive vision.”
Per Mulackal, without stronger leadership, Ethereum could stagnate, suggesting that the network should push for faster updates and ship “one hard fork each quarter.” Otherwise, he said, Ethereum risks reproducing “exactly the same result” as the past five years.
Source link


Reason to trust
![]()
Strict editorial policy that focuses on accuracy, relevance, and impartiality
Created by industry experts and meticulously reviewed
The highest standards in reporting and publishing
Strict editorial policy that focuses on accuracy, relevance, and impartiality
Morbi pretium leo et nisl aliquam mollis. Quisque arcu lorem, ultricies quis pellentesque nec, ullamcorper eu odio.
Ethereum’s attempt to regain bullish momentum has hit a roadblock, as the price failed to break through the crucial $2,160 resistance level. After showing signs of recovery, ETH faced strong selling pressure at this key level, preventing a sustained breakout and disappointing bullish traders who were hoping for further upside.
Its inability to push past this resistance suggests that bears are still in control, keeping Ethereum’s price under pressure. With the momentum fading and the market sentiment turning cautious, traders are now closely watching key support zones to determine the next move.
Bearish Pressure Mounts: What’s Next For Ethereum?
Ethereum is facing increasing downside pressure as its latest recovery attempt was rejected at the $2,160 resistance level. The failed breakout has reinforced bearish sentiment, with key technical indicators signaling weakness. If buyers fail to step in, ETH could be at risk of deeper declines in the near term.
Related Reading
One of the major warning signs is weak volume during the recovery attempt. A strong breakout typically requires significant buying interest, but Ethereum’s rally lacked momentum, making it easier for sellers to regain control. This lack of conviction from bulls suggests that the upside move was not sustainable, allowing bears to push prices lower.
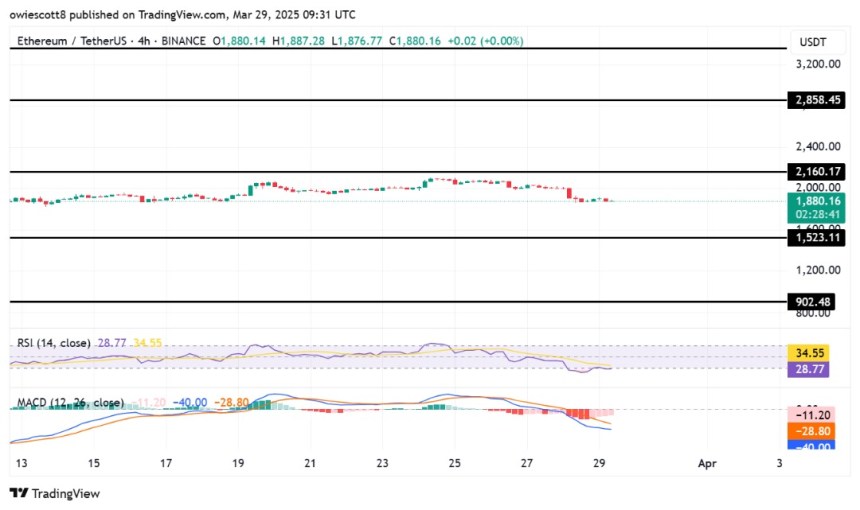
Additionally, the Relative Strength Index (RSI) has broken down, moving below key thresholds that indicate weakening bullish strength. The current declining RSI shows that buying pressure is fading, making it difficult for Ethereum to build upward momentum. If the RSI continues trending downward, it could further confirm a prolonged bearish phase.
The Moving Average Convergence Divergence (MACD) has also turned negative, with a breakdown below the signal line and a widening gap between the MACD and its moving average. This crossover indicates that bearish momentum is accelerating, reducing the chances of an immediate recovery. When combined with other bearish signals, the MACD breakdown further supports the case for a continued downside.
Looking ahead, ETH may retest key support zones. However, a strong bounce from lower levels could offer bulls another chance to regain lost ground. For now, the charts suggest that Ethereum remains vulnerable to further declines.
Support Levels To Watch: Can Bulls Prevent Further Decline?
With attention now turning to key support levels, the first major support to watch is around $1,523, a level that previously acted as a short-term demand zone. If Ethereum holds above this area, it might provide bulls with a foundation for another rebound attempt. However, a break below this level could signal growing bearish dominance, increasing the risk of deeper losses.
Related Reading
Below $1,523, the next key support lies at $902, aligning with previous price reactions and acting as a psychological level for traders. A failure to hold here may accelerate selling pressure, pushing ETH toward other support below.
Featured image from iStock, chart from Tradingview.com
Source link

Reason to trust
![]()
Strict editorial policy that focuses on accuracy, relevance, and impartiality
Created by industry experts and meticulously reviewed
The highest standards in reporting and publishing
Strict editorial policy that focuses on accuracy, relevance, and impartiality
Morbi pretium leo et nisl aliquam mollis. Quisque arcu lorem, ultricies quis pellentesque nec, ullamcorper eu odio.
Amid today’s market correction, Chainlink (LINK) has lost its recent gains, falling back to a crucial support level. An analyst suggests a monthly close above its current range could position the cryptocurrency for a 35% surge.
Related Reading
Chainlink Retest Crucial Price Zone
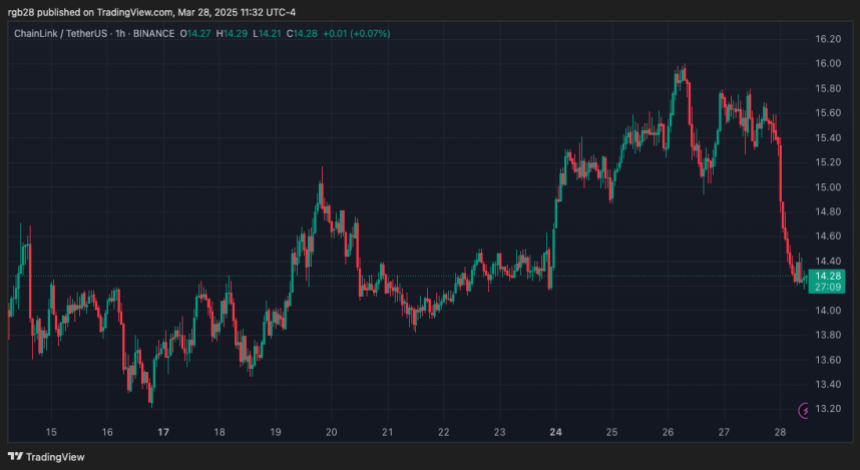
Chainlink has retraced 9.1% in the past 24 hours to retest the key $14 support zone again. The cryptocurrency surged 15.7% from last Friday’s lows to hit an 18-day high of $16 on Wednesday, momentarily recovering 35% from this month’s low.
However, the recent market correction halted the momentum of most cryptocurrencies, with Bitcoin (BTC) falling back to the $83,700 mark and Ethereum (ETH) dipping to the $1,860 support zone.
Today, LINK dropped from $15 to $14.07, losing all its Wednesday gains. Previously, analyst Ali Martinez noted that the cryptocurrency has been in an ascending parallel channel since July 2023.
Chainlink has hovered between the pattern’s upper and lower boundary for the last year and a half, surging to the channel’s upper trendline every time it retested the lower zone before dropping back.
Amid its recent price performance, the cryptocurrency is retesting the channel’s lower boundary, suggesting a bounce to the upper range could come if it holds its current price levels.
Meanwhile, Rekt Capital highlighted that the token is testing its multi-month symmetrical triangle pattern, which could determine the cryptocurrency’s next move.
As the analyst explained, Chainlink consolidated inside a “Macro Triangular market structure” for most of 2024 before breaking out of the pattern during the November market rally.
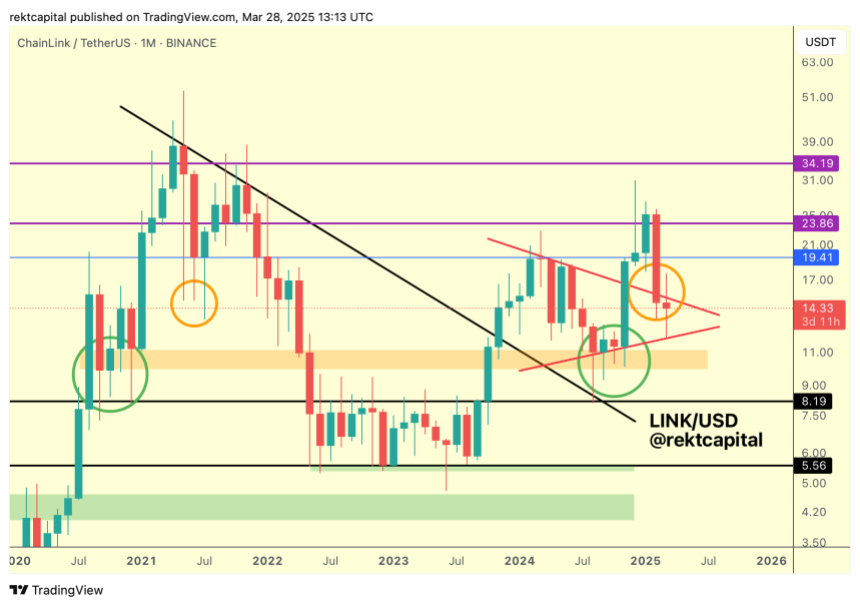
During the Q4 2024 breakout, the cryptocurrency hit a two-year high of $30.9 but failed to hold this level in the following weeks. As a result, it has been in a downtrend for the past three months, with LINK’s price falling back into the Macro Triangle.
“The main goal for LINK here is to retest the top of the pattern to secure a successful post-breakout retest,” Rekt Capital detailed, adding, “It’s possible this is a volatile post-breakout retest.”
LINK Needs To Hold This Level
Rekt Capital pointed out that, historically, Chainlink has had downside deviations into this price range: “Back in mid-2021, LINK produced a downside deviation into this price area in the form of multiple Monthly downside wicks.”
Nonetheless, the cryptocurrency is downside deviating “but in the form of actual candle-bodies closes rather than downside wicks” this time.
The analyst also highlighted that, like in 2021, LINK is trading within a historical demand area, at around $13-5 and $15.5, testing this zone as support. Based on this, the cryptocurrency must successfully hold this area to “position itself for upside going forward.”
Related Reading
Moreover, the retest is key for reclaiming the top of its triangular market structure. Breaking and recovering that level would “exact a successful post-breakout retest” and enable the price to target the $19 resistance in the future.
The analyst concluded that if LINK closes the month above the triangle top, it “would position price for a successful retest, despite the downside deviation.”
As of this writing, Chainlink trades at $14.09, a 6.9% drop in the monthly timeframe.
Featured Image from Unsplash.com, Chart from TradingView.com
Source link
3M Bollinger Bands
Ethereum Price Hits 300-Week MA For The Second Time Ever, Here’s What Happened In 2022
Reason to trust
![]()
Strict editorial policy that focuses on accuracy, relevance, and impartiality
Created by industry experts and meticulously reviewed
The highest standards in reporting and publishing
Strict editorial policy that focuses on accuracy, relevance, and impartiality
Morbi pretium leo et nisl aliquam mollis. Quisque arcu lorem, ultricies quis pellentesque nec, ullamcorper eu odio.
Ethereum has once again fallen below the $2,000 mark, a psychological level it had briefly reclaimed earlier this week. The market-wide correction over the past 24 hours has weighed on Ethereum’s recovery momentum, and the leading altcoin has seen a dip in sentiment that could lead to a deeper decline or a sharp mid-term rebound.
Short-term sentiment is cautious, but a new analysis from a well-followed crypto analyst has brought attention to a significant technical event that opens up a bullish perspective for the Ethereum price.
Ethereum Hits 300-Week Moving Average Again: What Happened The Last Time?
Taking to social media platform X, crypto analyst CryptoBullet pointed out that Ethereum has now touched the 300-week moving average for only the second time in its history. The first instance was in June 2022, during the market-wide crash that saw the Ethereum price plummet to as low as $880 before beginning a long, slow recovery.
Related Reading
The second occurrence has come this month, March 2025, just as Ethereum continues to extend its struggles in gaining a footing above $2,000. With Ethereum touching the 300-week moving average again, we can only look back to see what happened last time to get a perspective of what to expect now.
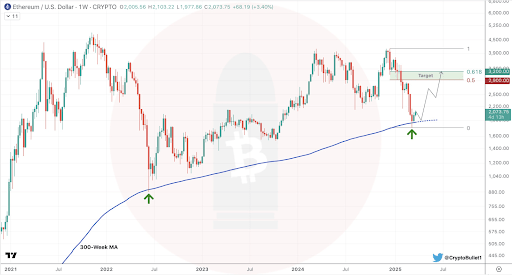
In June 2022, Ethereum’s touch of the 300-week moving average marked the beginning of a long-term recovery phase. After the bounce from that level, the Ethereum price surged more than 140% over the next eight weeks, eventually pushing above $2,100 in August 2022 before another correction.
Mid-Term Rebound In Focus For ETH, But Resistance Ahead
CryptoBullet noted the significance of this moving average, framing it as a key historical support zone. The analyst argued that regardless of bearish sentiment in the short term, this kind of macro-level support typically sets the stage for a meaningful bounce.
Related Reading
“Even if you’re a bear, you can’t deny that we hit a very important support level,” he wrote, adding that his price target for the coming bounce is between $2,900 and $3,200. Nonetheless, the bounce will depend on how the Ethereum price reacts to the level, as a continued downside move would cancel out any bullish momentum.
For now, Ethereum’s price is trapped under bearish sentiment, and bulls will need to reclaim the $2,000 zone before any sustainable bounce toward the $2,900 and $3,200 range can begin to materialize. Furthermore, the recent price correction in the past 24 hours increases the risks of the Ethereum price closing March below the 3M Bollinger bands, which is currently just around $2,000. A close below the 3M Bollinger bands could spell trouble for the leading altcoin.
However, if CryptoBullet’s analysis proves to be accurate, Ethereum may soon enter a period of stronger price action that plays out over the coming weeks. At the time of writing, Ethereum is trading at $1,907, down by 5.82% in the past 24 hours.
Featured image from Unsplash, chart from Tradingview.com
Source link

Nasdaq Files To Launch a New Grayscale Avalanche (AVAX) Exchange-Traded Fund

How To Measure The Success Of A Bitcoin Treasury Company

Why ‘Tiger King’ Joe Exotic Launched a Solana Meme Coin From Behind Bars

Trump pardons BitMEX, is ‘Bitcoin Jesus’ Roger Ver next?

Terraform Labs to Open Claims Portal for Investors on March 31

BitGo CEO Calls For Regulation Amid Galaxy Digital’s Settlement

Ethereum Bulls Disappointed As Recovery Attempt Fails At $2,160 Resistance

US recession 40% likely in 2025, what it means for crypto — Analyst

Crypto Investment Firm Galaxy Digital Settles With New York AG for $200,000,000 Over Luna Allegations

Bitcoin Covenants: CHECKTEMPLATEVERIFY (BIP 119)

This Week in Bitcoin: GameStop Reveals Reserve, But Inflation Fears Rear Their Head

Solana price prepares a wild ride as risks rise

FTX to Begin $11.4B Creditor Payouts in May After Years-Long Bankruptcy Battle

Here’s Why Crypto Market Is Bleeding Today

Support Or Resistance? Chainlink (LINK) Investor Data Suggests Key Price Zones


 24/7 Cryptocurrency News5 months ago
Arthur Hayes, Murad’s Prediction For Meme Coins, AI & DeFi Coins For 2025

 Bitcoin2 months ago
Expert Sees Bitcoin Dipping To $50K While Bullish Signs Persist

 24/7 Cryptocurrency News3 months ago
Aptos Leverages Chainlink To Enhance Scalability and Data Access

 Bitcoin5 months ago
Bitcoin Could Rally to $80,000 on the Eve of US Elections

 Altcoins2 months ago
Sonic Now ‘Golden Standard’ of Layer-2s After Scaling Transactions to 16,000+ per Second, Says Andre Cronje

 Bitcoin5 months ago
Institutional Investors Go All In on Crypto as 57% Plan to Boost Allocations as Bull Run Heats Up, Sygnum Survey Reveals

 Opinion5 months ago
Crypto’s Big Trump Gamble Is Risky

 Price analysis5 months ago
Ripple-SEC Case Ends, But These 3 Rivals Could Jump 500x
