Price analysis
Crypto Investor’s Brave Yet Hilarious Prediction Speculates If XRP Price Will Hit $3,000 This Cycle
Published
2 weeks agoon
By
admin
A renowned crypto investor has outlined a brave XRP price prediction saying that Ripple might rally to $3,000 this cycle. The analyst’s bullish forecast comes at a time when bearish headwinds are causing a downturn across the broader crypto market as XRP struggles to sustain levels above the crucial support of $2.
Crypto Investor Shares Brave XRP Price Prediction
Crypto investor Random Crypto Pal has shared a bold XRP price prediction and likened the 2017 XRP price rally to the 2025 price movement. He noted that in 2017, Ripple climbed from $0.003 to $3.31, which was an over 110,000% price gain, If it repeats this pattern, XRP could reach $3,000.
Pal’s bullish prediction has attracted criticism from other crypto investors. In response to his X post, one user noted that in 2017, XRP only needed billions of dollars to achieve the $3.31 price within months. However, for an upswing to $3,000, Ripple needed trillions of dollars in buying demand, which was not feasible.
More importantly, at a price of $3,000 and a circulating supply of $58 billion, XRP would have a $174 trillion market cap. This is more than six times higher than the annual US GDP. It would also be three times bigger than the entire US stock market, which has a market cap of $69 trillion.
This massive market cap valuation shows why a $3,000 XRP price prediction is hilarious. Ripple is unlikely to reach this level with the current amount of token supply.
Ripple Technical Analysis As Another Crash Looms
XRP price today trades at $2.09 with a 3.6% decline in 24 hours. Ripple is on the verge of another crash and might drop below $2 as investors flee from risk assets amid fears of President Trump’s tariffs and reduced odds that the Federal Reserve will trim interest rates.
On the one-day price chart, XRP had formed a rounding top pattern, which signals that the current trend might change to bearish. The height of this rounding top pattern indicates that Ripple could plunge by 17.45% from its current price level of $1.76.
Technical indicators support the bearish setup depicted by the rounding top pattern. The RSI is leaning towards being oversold and depicts bearish momentum while the ADX lime is also tipping north, another sign that the downtrend is strong.


As a recent Coingape article reported, if the XRP price drops below $1.90. It might crash to $1. Given that XRP has already dropped below the neckline of the rounding top, a crash is likely to happen in the near term.
XRP’s Liquidation Heatmap Supports Bearish Outlook
Besides the rounding top pattern, the liquidation heatmap supports the bearish outlook for XRP. Data from Coinglass shows that there is a hot liquidation zone at $2.05, where many long traders are at risk of being liquidated.


These liquidation zones tend to act as a magnet that pulls the price down. Moreover, the closure of long positions increases selling activity around an asset. This hints towards more bearish trends facing Ripple.
Frequently Asked Questions (FAQs)
According to crypto investor Pal, XRP can reach $3,000 if it repeats the 2017 cycle. However, this price target is unrealistic as it would need Ripple to add more than $173 trillion to its market cap.
Ripple has formed a rounding top pattern on the 1-day chart suggesting that the price might drop by 17% from the current price to $1.76.
XRP’s liquidation heatmap shows a strong magnet zone below the current price. XRP might drop to this level and trigger long liquidations that will push the price lower.
muthoni
Muthoni Mary is a seasoned crypto market analyst and writer with over three years of experience dissecting blockchain trends, price movements, and market dynamics. With a sharp eye for technical analysis and an in-depth understanding of on-chain metrics, she delivers insightful, data-driven content that helps investors navigate the fast-paced world of digital assets.
Disclaimer: The presented content may include the personal opinion of the author and is subject to market condition. Do your market research before investing in cryptocurrencies. The author or the publication does not hold any responsibility for your personal financial loss.
Source link
You may like


Crypto markets ‘relatively orderly’ despite Trump tariff chaos: NYDIG


Fartcoin ‘Hot Air Rises’ — $1.50 Just A Whiff Away

What happened to the RWA token?


Crypto Strategist Sees Solana-Based Memecoin Surging Higher, Says One AI Altcoin Flashing Strong Chart

Mantra Team Responds As The OM Token Price Crashes Over 80% In 24 Hours


This Week in Crypto Games: Gaming Tokens Crash Out, Eve Frontier Opens Up
Markets
Popcat price surges as exchange reserves fall, profit leaders hold
Published
19 hours agoon
April 13, 2025By
admin
Popcat, a top Solana meme coin, has staged a strong comeback as investors bought the dip and exchange reserves dropped.
Popcat (POPCAT) rose for four consecutive days, reaching a high of $0.25, its highest level since March 25. It has jumped by almos 100% from its lowest level this month.
The jump happened as crypto investors bought the dip in some specific Solana (SOL) meme coins like Fartcoin (FARTCOIN), Goatseus Maximus, Fartboy, and Vine.
Nansen data shows that more investors are moving their Popcat tokens from exchanges to self-custody. Exchange balances have dropped by almost 10% in the last seven days to 239.5 million, down from 262 million the same day last week. Most of these outflows were from Bybit, Raydium, and Coinbase.
The weekly supply of Popcat tokens on exchanges dropped by 2.3% to 24%. Falling exchange reserves is a bullish sign, signaling that more investors are taking a long-term view of the coin and are not dumping their tokens.
More data shows that the most profitable Popcat traders in the last seven days are not selling. The top trader has made a profit of $173,000 and still holds 97% of his position. The chart below shows that many of these traders still hold their tokens.

Popcat price analysis
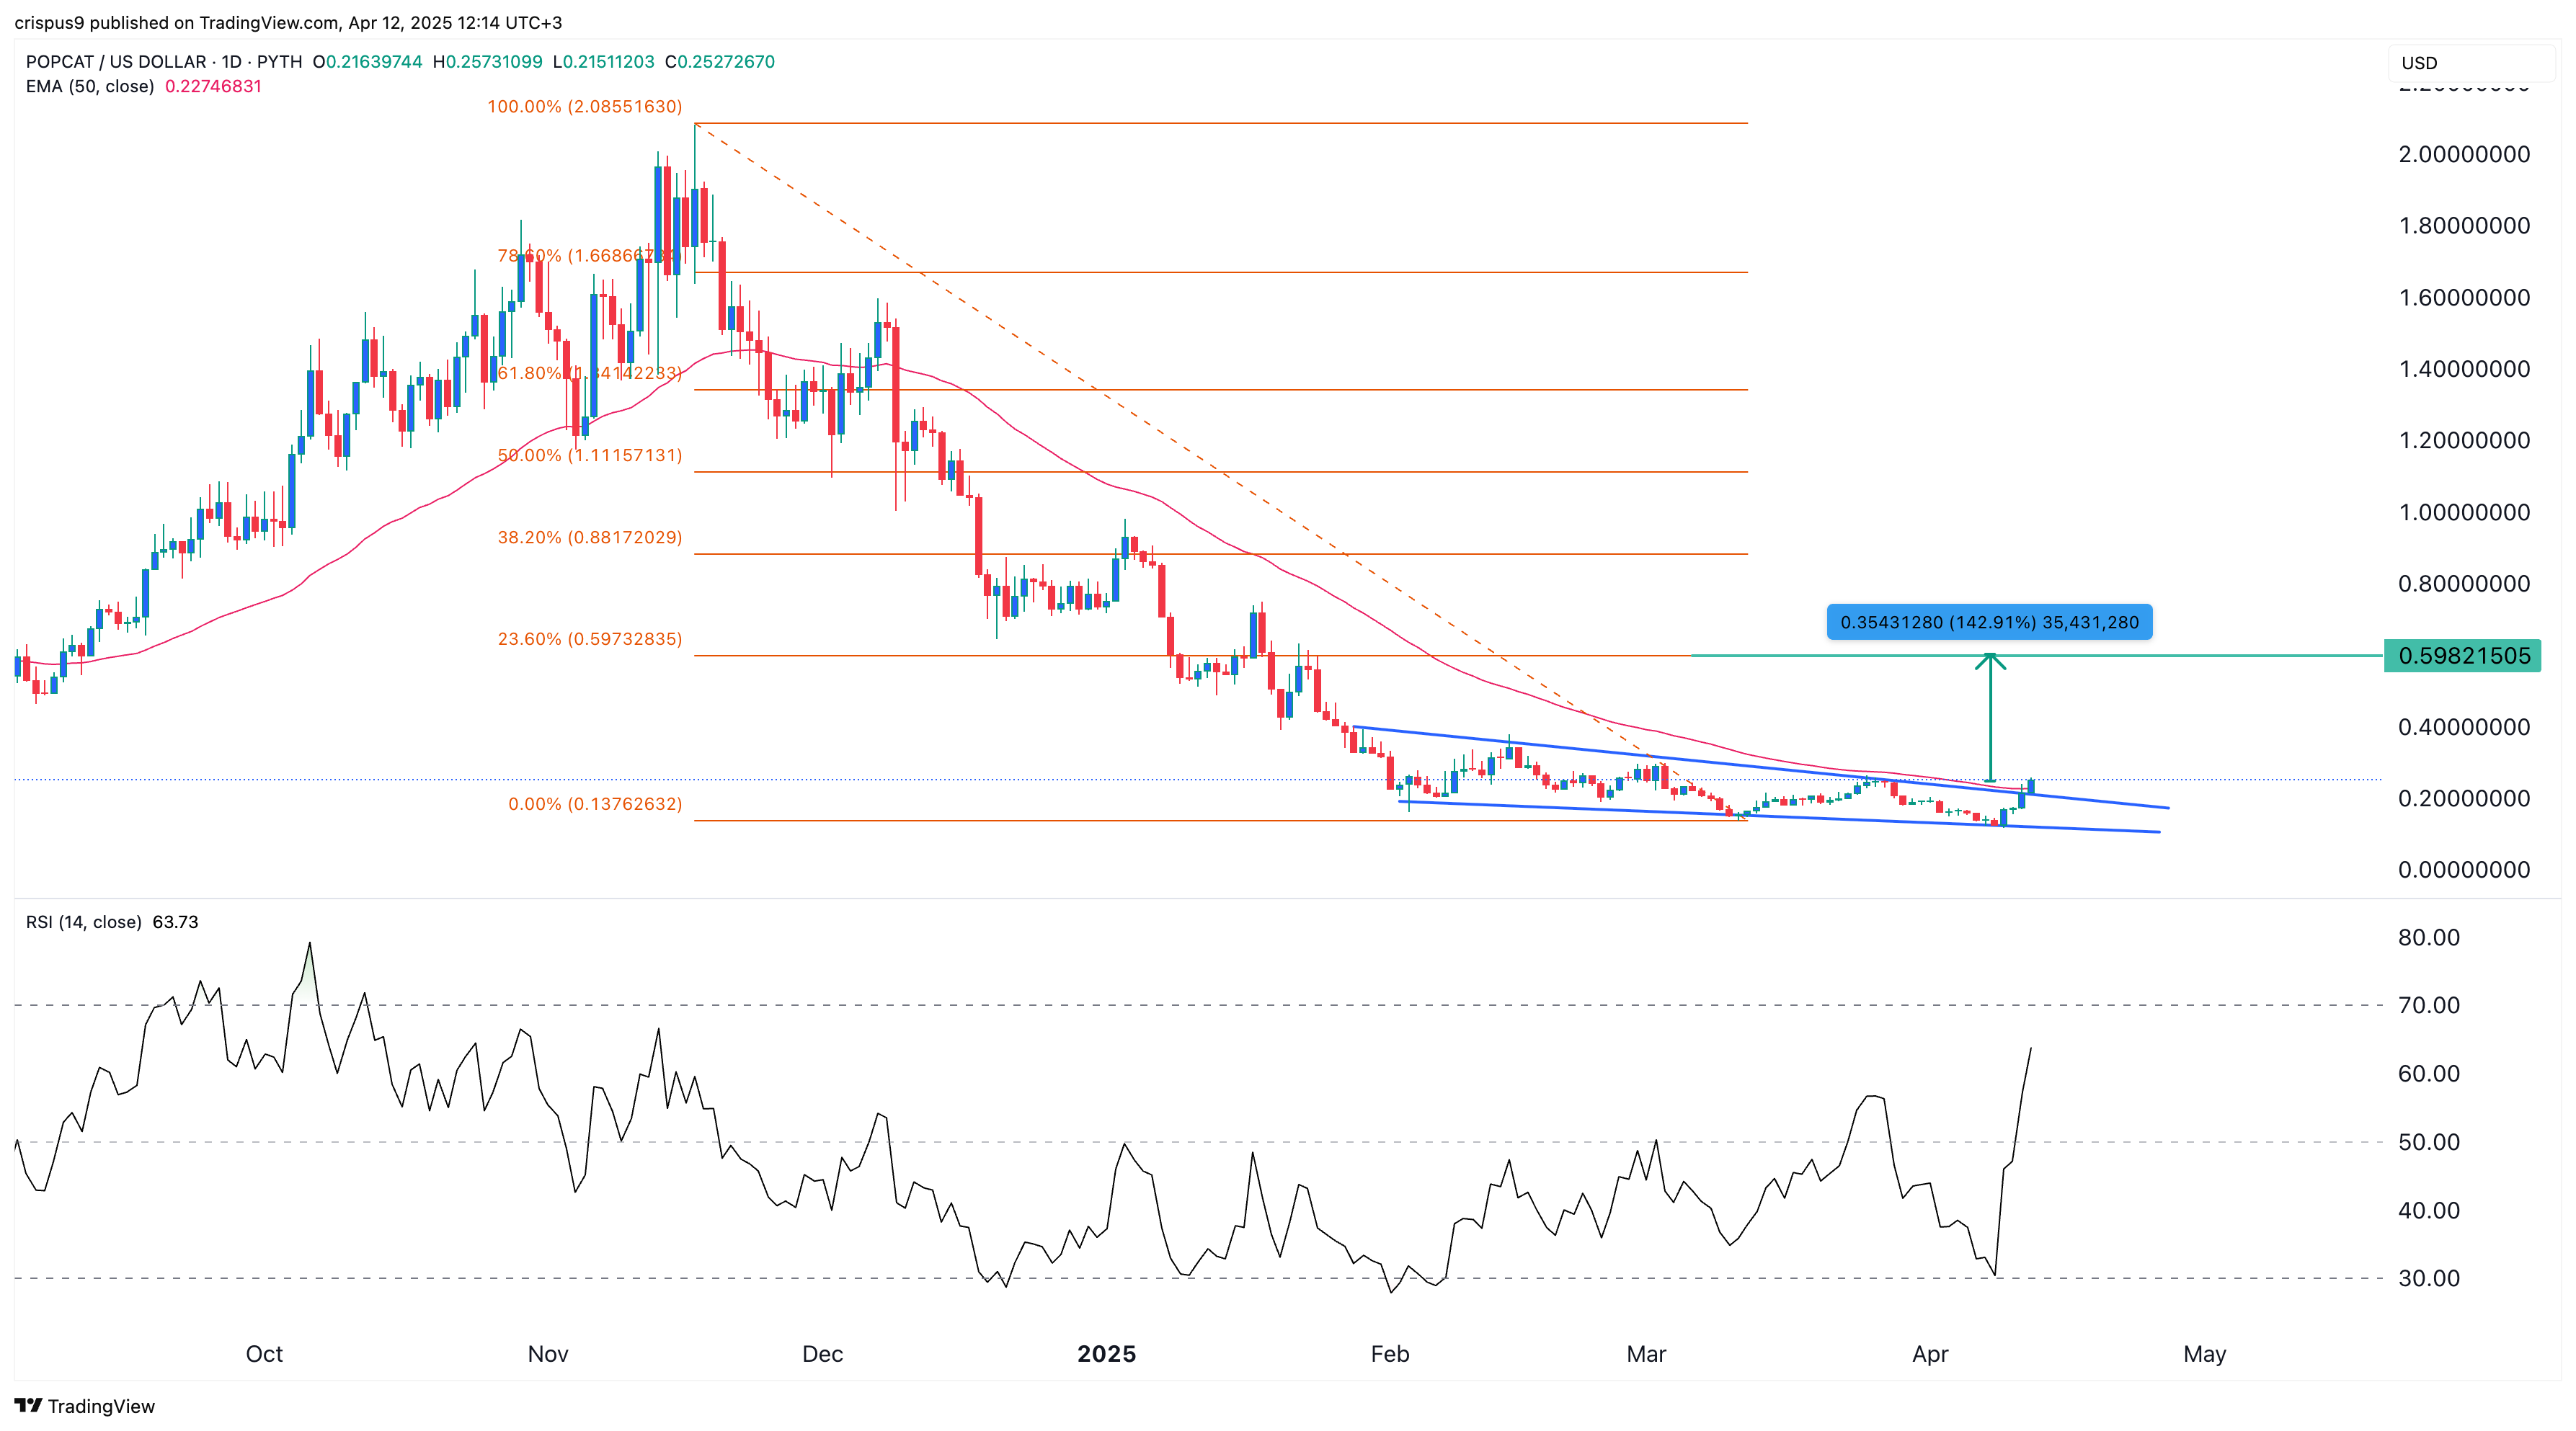
The daily chart shows that the Popcat price has bounced back in the past few days. This rebound happened after the token formed a falling wedge pattern, which is shown in blue. This pattern is made up of two descending and converging trendlines.
The Popcat token has moved slightly above the 50-day moving average, while the Relative Strength Index and other oscillators have pointed upward.
Therefore, the coin will likely keep rising as bulls target the 23.6% retracement level at $0.5982, up 142% from the current level.
Source link
Pi Network Price
3 Altcoins to Buy as US Senate Banking Chair Gives August Deadline For Major Crypto Bills
Published
21 hours agoon
April 13, 2025By
admin
The US crypto market seems poised for bullish trends after Senate Banking Chair Tim Scott stated that most of the pending crypto bills will be passed by August 2025. As this deadline fast approaches, crypto traders are looking for the best altcoins to buy to make significant gains once demand for digital assets rises.
The recent remarks by Senator Scott coincide with a notable recovery across the crypto market today, April 13. At press time, Bitcoin and all the top ten altcoins were edging higher as the total crypto marketcap reached $2.79 trillion.
This rally may extend in the coming months as the US emerges as a leading crypto hub. According to Senator Scott, the pending crypto bills will ensure that the US dominates the digital asset space.
The statement also comes after US President Trump signed the first crypto-related bill. The bill, which was signed earlier this week, seeks to remove tax reporting requirements in the DeFi industry.
Top Altcoins to Buy Before August
With the US emerging as one of the most pro-crypto countries, the top altcoins to buy today for investors to make significant gains are Ripple (XRP), Solana (SOL), and Pi Network (PI).
Ripple (XRP)
XRP is one of the top altcoins to buy today. One of the reasons that makes Ripple a good buy is that it is the largest US-made altcoin by market cap. Therefore, as the US crypto regulatpry framework changes, XRP is well-positioned to benefit.
The four-hour XRP price chart suggests the altcoin is in an uptrend. The RSI has risen to 63 showing a prevalence of buying pressure. Meanwhile, the MACD line and green histogram bars support the bullish thesis.
If the uptrend continues, XRP price may flip resistance at $2.23. Doing so will trigger a 17% rally to the 161.8% Fibonacci level of $2.61. If Ripple reaches This level, it might pave the way for more gains to new highs above $3.


Solana (SOL)
Solana also ranks among the best altcoins to buy today. SOL trades at $132 today. April 13 after a 10% increase in 24 hours. Analyst Momin has shared a bullish Solana price prediction saying the altcoin might rally to $180 in the coming weeks.
The analyst also added that Solana is on the verge of making a decisive close above $120 on the weekly chart. If this happens, it will spark a Solana price rally towards $180. Additionally, Solana price has breached the upper trendline of a descending trendline, showing that the bullish momentum is strong, which may spark a surge to $257.


Pi Network (PI)
Pi Network price had posted a 15% gain at press time. Data from CoinMarketCap also shows that trading volumes have increased by 200% to over $663 million as buyers purchased the asset.
One of the reasons why Pi Coin is one of the best altcoins to buy ahead of the crypto bills being passed is the asset’s rising presence in the US. The altcoin will be adopted as a means of payment by firms like Zito Realty. At the same time, Chainlink has added Pi Network token to its Data Streams, making it more accessible.
Pi Coin is trading within an ascending triangle pattern on the four-hour price chart, which shows a positive outlook. At the same time, the AO histogram bars and the RSI are tipping north, which supports a bullish Pi Network price forecast.


Summary of Top Altcoins to Buy
The US will pass most of the pending crypto bills before August according to the Senate Banking Chair Tim Scott. Once these bills are passed, the crypto market is poised to make significant gains. The top altcoins to buy today to position yourself for these gains are XRP, SOL and Pi Coin.
Frequently Asked Questions (FAQs)
The best altcoins to buy today include Ripple (XRP0, Solana (SOL), and Pi Network (PI). These altcoins have solid fundamentals and a bullish technical outlook.
XRP price can reach $3 before August 2025. This rally will be driven by bullish catalysts like the approval of spot XRP ETFs and a pro-crypto regulatory framework in the US.
Pi Network price is gaining today after Chainlink mentioned Pi among the assets supported in its Data Streams.
muthoni
Muthoni Mary is a seasoned crypto market analyst and writer with over three years of experience dissecting blockchain trends, price movements, and market dynamics. With a sharp eye for technical analysis and an in-depth understanding of on-chain metrics, she delivers insightful, data-driven content that helps investors navigate the fast-paced world of digital assets.
Disclaimer: The presented content may include the personal opinion of the author and is subject to market condition. Do your market research before investing in cryptocurrencies. The author or the publication does not hold any responsibility for your personal financial loss.
Source link
Altcoin
Sonic token eyes higher ground following a bullish engulfing impulse
Published
2 days agoon
April 12, 2025By
admin
Sonic token has caught the eye of traders after a powerful bullish move from support. With price now consolidating under key resistance, the next breakout could be just around the corner—here’s what the chart is telling us.
Sonic (S) token has shown some serious momentum lately, catching the attention of traders with a powerful bullish engulfing candle. With price now grinding against key technical levels, the next few moves could be crucial in determining whether we see continuation—or signs of a reversal.
Key points:
- Strong bullish engulfing candle from the value area low and daily support at $0.39
- Price consolidating just under point of control, hinting at vertical accumulation
- $0.52 liquidity target aligns with 0.618 Fibonacci and VWAP resistance
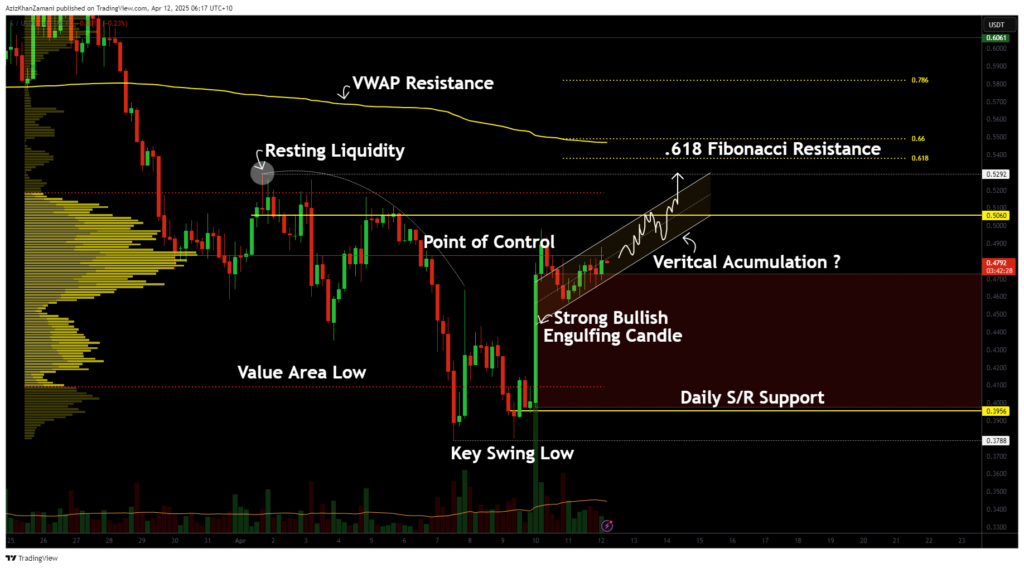
The recent price action on Sonic Token has been notably impulsive, starting with a strong bullish engulfing candle that formed right at the value area low. This region also aligned perfectly with daily support around $0.39, giving the move significant technical weight.
The surge was accompanied by a rising volume profile, confirming buyer interest and demand at that level. Following the push, price now finds itself consolidating near the point of control—typically a sign that the market is building a base, not reversing.
Potential vertical accumulation
If Sonic continues to trade above the point of control, this could signal the presence of vertical accumulation. This kind of price action, characterized by higher lows on the lower time frame within a compact trading range, often leads to further bullish continuation.
One critical area to watch is the resting liquidity around $0.52. This level stands out as an untapped high and a magnet for price, especially with the 0.618 Fibonacci level and VWAP resistance stacked just above it.
Reaching that $0.52 region makes both technical and psychological sense. The theory of liquidity suggests that markets seek out areas of uncollected orders. Once price had taken the lower-side liquidity and bounced hard, the next logical move is to target the highs.
That target also lines up with the value area high of the current range, meaning a tap of that level would complete a full range rotation from low to high. If Sonic starts distributing around that resistance area, that could mark the start of a longer consolidation phase.
Right now, the chart is still showing signs of strength. There are no clear signals of weakness, and vertical accumulation patterns tend to continue until exhaustion. While it’s smart to be cautious near resistance, prematurely shorting Sonic without a clear rejection could be risky. For now, the bulls are in control—and the $0.52 target remains in play until proven otherwise.
Source link
Michael Saylor Teases New Bitcoin Buy After Strategy’s $7.69 Billion Q1 BTC Buying Spree

Crypto markets ‘relatively orderly’ despite Trump tariff chaos: NYDIG

Fartcoin ‘Hot Air Rises’ — $1.50 Just A Whiff Away

What happened to the RWA token?

Crypto Strategist Sees Solana-Based Memecoin Surging Higher, Says One AI Altcoin Flashing Strong Chart

Mantra Team Responds As The OM Token Price Crashes Over 80% In 24 Hours

This Week in Crypto Games: Gaming Tokens Crash Out, Eve Frontier Opens Up

Commerce Secretary Lutnick walks back tariff relief on electronics

Gold ETF Inflows Hit Three-Year High as PAXG, XAUT Outperform Wider Crypto Market

Israel’s New Study Shows 51% Of Public Is Interested In Adopting CBDC (Digital Shekel) – Is That So?

Solana Price Eyes Breakout Toward $143 As Inverse Head & Shoulders Pattern Takes Shape On 4-hour Chart

Crypto malware silently steals ETH, XRP, SOL from wallets

Binance Executives Met With US Government Officials To Discuss Easing of Regulatory Supervision: Report

Michael Saylor Hints At Another MicroStrategy Bitcoin Purchase, BTC Price To Rally?

From the Crypto Trenches to the Hill: Why Solana Is Making a Big Push in Washington

Arthur Hayes, Murad’s Prediction For Meme Coins, AI & DeFi Coins For 2025

Expert Sees Bitcoin Dipping To $50K While Bullish Signs Persist

Aptos Leverages Chainlink To Enhance Scalability and Data Access

Bitcoin Could Rally to $80,000 on the Eve of US Elections

Crypto’s Big Trump Gamble Is Risky

Sonic Now ‘Golden Standard’ of Layer-2s After Scaling Transactions to 16,000+ per Second, Says Andre Cronje

Institutional Investors Go All In on Crypto as 57% Plan to Boost Allocations as Bull Run Heats Up, Sygnum Survey Reveals

Ripple-SEC Case Ends, But These 3 Rivals Could Jump 500x

Has The Bitcoin Price Already Peaked?

A16z-backed Espresso announces mainnet launch of core product

The Future of Bitcoin: Scaling, Institutional Adoption, and Strategic Reserves with Rich Rines

3 Voting Polls Show Why Ripple’s XRP Price Could Hit $10 Soon

Xmas Altcoin Rally Insights by BNM Agent I

Blockchain groups challenge new broker reporting rule

I’m Grateful for Trump’s Embrace of Bitcoin
Trending

 24/7 Cryptocurrency News5 months ago
Arthur Hayes, Murad’s Prediction For Meme Coins, AI & DeFi Coins For 2025

 Bitcoin3 months ago
Expert Sees Bitcoin Dipping To $50K While Bullish Signs Persist

 24/7 Cryptocurrency News3 months ago
Aptos Leverages Chainlink To Enhance Scalability and Data Access

 Bitcoin5 months ago
Bitcoin Could Rally to $80,000 on the Eve of US Elections

 Opinion5 months ago
Crypto’s Big Trump Gamble Is Risky

 Altcoins2 months ago
Sonic Now ‘Golden Standard’ of Layer-2s After Scaling Transactions to 16,000+ per Second, Says Andre Cronje

 Bitcoin5 months ago
Institutional Investors Go All In on Crypto as 57% Plan to Boost Allocations as Bull Run Heats Up, Sygnum Survey Reveals

 Price analysis5 months ago
Ripple-SEC Case Ends, But These 3 Rivals Could Jump 500x


✓ Share: